The Office Recovery Looks Different Beneath the Headline
Office deal counts look recovered. But large buildings are returning at sharply lower prices, revealing a market that has reset, not rebounded.
The Office Recovery Looks Different Beneath the Headline
Office deal counts look recovered. But large buildings are returning at sharply lower prices, revealing a market that has reset, not rebounded.
Author

Cole Perry
Associate Director of Research, Altus Group
Key highlights:
Office looks recovered on volume but not on price: transactions are back near pre-pandemic levels, while the pricing advantage large buildings once held has largely eroded
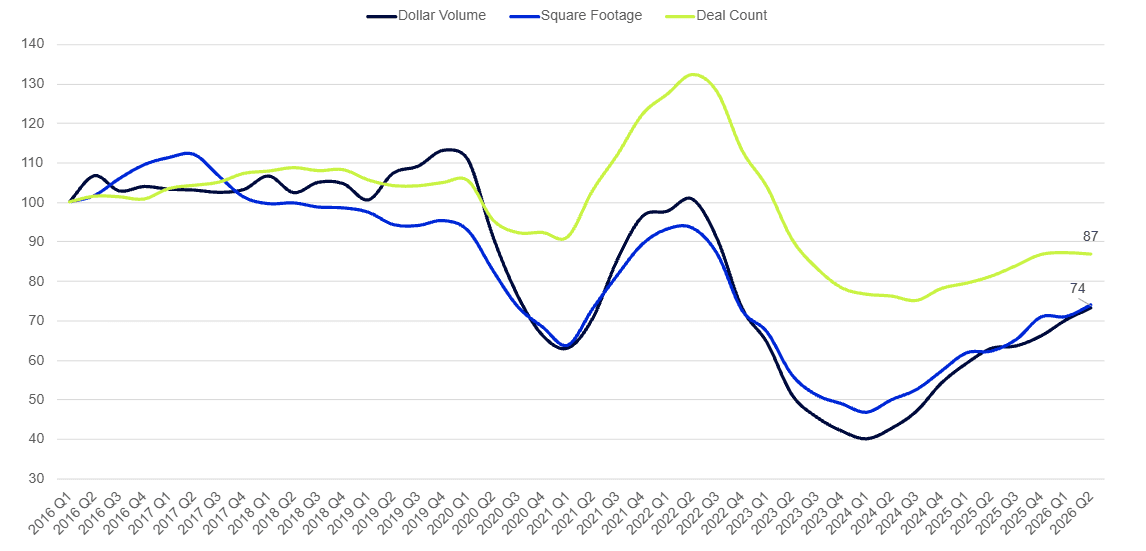
The recovery has been carried by deal count: at the post-pandemic peak, office deals reached roughly 130% of their 2016 baseline, while square footage and dollar volume barely returned to it.
Large assets left first and are returning last: from peak to trough, deal count fell 43%, square footage 50%, and dollar volume 64%
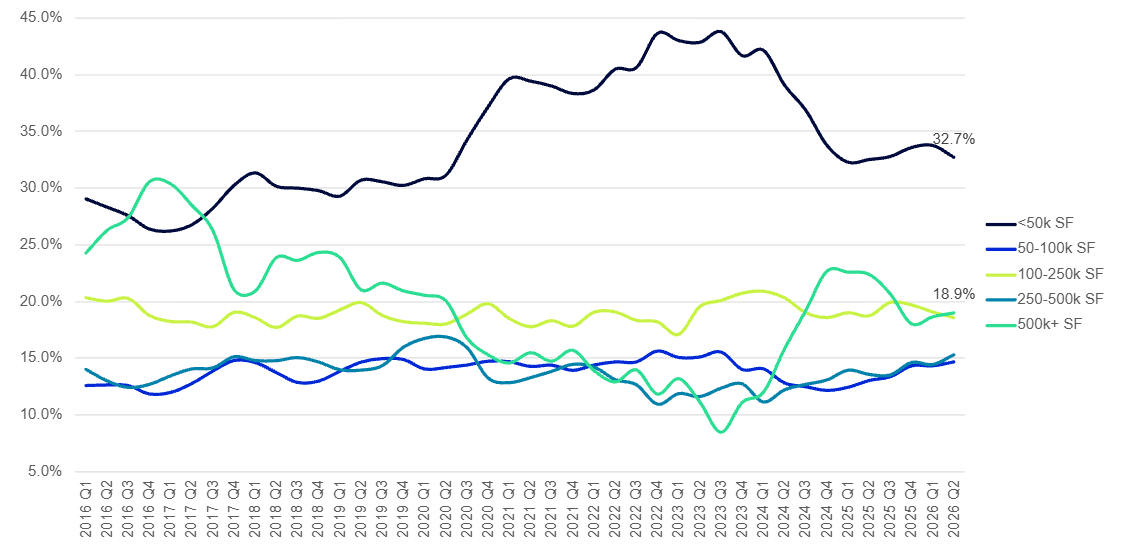
Composition is normalizing, but pricing is not: space traded above 500,000 square feet has recovered to near its 20.9% pre-pandemic share, yet its median price per square foot is down 36% since 2019 Q4
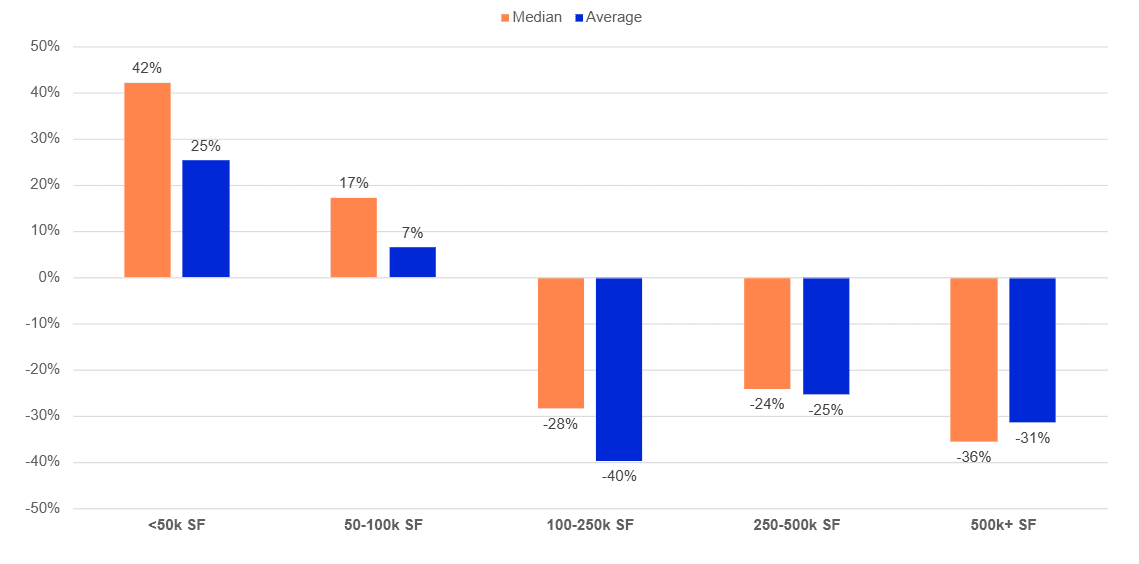
Pricing diverged by size: since 2019 Q4, median price per square foot rose 42% for buildings below 50,000 square feet but fell 24% to 36% for those above 100,000
Volume alone cannot separate a recovery from a repricing
Imagine an equity market that reported trading volume but not share prices. It would be hard to tell a boom from a bust: heavier trading could mean renewed confidence, forced selling, or simply a market clearing at lower values. Office real estate poses the same problem, and the post-pandemic period is a case in point. During the boom, deal count climbed to roughly 130% of its 2016 baseline, yet square footage and dollar volume barely reached that baseline over the same stretch. By the volume measure it looked like a boom; by the space and capital measures it looked like something far more muted. The current office recovery is tracing a fairly similar shape, which is why activity alone cannot tell us what is actually clearing the market or at what price.
The recovery has been carried by deal count, not size or dollars
The three measures of office activity, deal count, square footage, and dollar volume, did not move together. From post-COVID peak to trough (trailing four quarters), deal count fell 43%, square footage 50%, and dollar volume 64%. A large property adds only one transaction to the count but a disproportionate share of square footage and value, so the shallow drop in deal count relative to the steep drops in square footage and dollars shows activity concentrating in smaller deals while the large end withdrew.
The pattern predates the downturn. Even at the 2021 to 2022 peak, deal count ran well above its 2019 Q4 level while square footage and dollar volume never returned to it. The boom was a small-deal boom: more transactions, but not more space or more capital than before the pandemic.
Figure 1: Trailing 4Q transaction activity (Q1 2016 = 100)
Sources: Q2 2026 Investment & Transactions Quarterly; Altus Group’s Research Team
Composition confirms that shift. Buildings below 50,000 square feet grew from 30.2% of office square footage traded in 2019 Q4 to a peak of 43.8% in 2023 Q3, while space from buildings above 500,000 square feet collapsed from 20.9% to 8.4% over the same window. Since then the mix has moved back toward normal: by 2026 Q2, the 500,000-plus segment had recovered to 18.9%, close to its 2019 Q4 share, and the average building traded grew from roughly 27,700 square feet in late 2023 to about 35,200 square feet in the most recent quarter. The assets changing hands look increasingly familiar by size, but the prices they command do not.
Figure 2: Share of transacted office space by size
Sources: Q2 2026 Investment & Transactions Quarterly; Altus Group’s Research Team
Office pricing diverged sharply by building size
Comparing 2019 Q4 with 2026 Q2, median price per square foot rose 42% for buildings below 50,000 square feet and 17% for those between 50,000 and 100,000. Above that line it actually fell: 28% for 100,000 to 250,000 square feet, 24% for 250,000 to 500,000, and 36% for buildings above 500,000. Average pricing traces nearly the same shape. Large assets are re-entering the market, but at values that no longer lift market-wide pricing the way they once did.
Figure 3: Percent change in price per square foot in office space since Q4 2019
Sources: Q2 2026 Investment & Transactions Quarterly; Altus Group’s Research Team
Larger assets are returning without their former pricing influence
Office historically had a clear size premium: buyers paid more per square foot for larger buildings, so the market-wide average sat well above the median. That relationship still exists, but it is much weaker. Across all office buildings, the median price per square foot rose about 36% from 2019 Q4 to 2026 Q2, while the average fell about 13%, narrowing the pricing advantage once associated with larger assets.
The charts show how far that premium has compressed. The gap between average and median pricing narrowed from roughly $72 per square foot in 2019 Q4, when the average was $172 and the median was $100, to about $15 in 2026 Q2, when the average was $150 and the median was $135. Larger buildings still command more per square foot overall, but the market is no longer paying nearly as much extra for more space as smaller assets hold firm and buildings above 100,000 square feet reprice downward.
Figure 4: Average vs. Median price per square foot by property size bucket
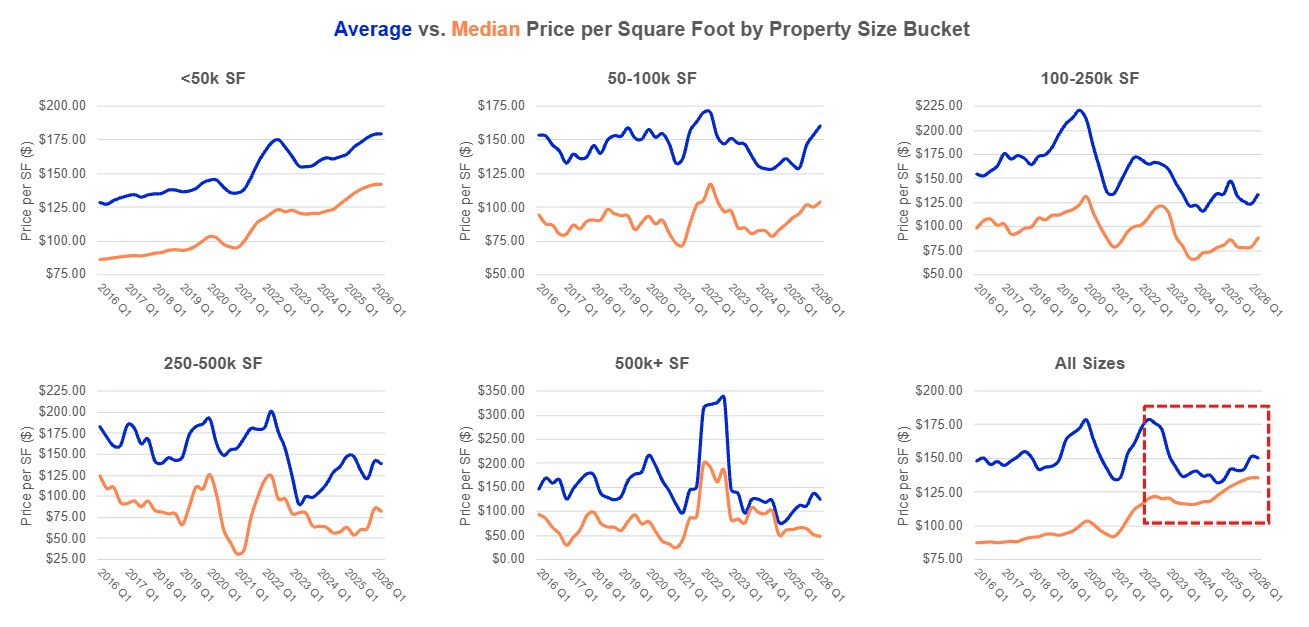
The headline recovery therefore masks a different office market. Large buildings are returning to the transaction mix, but without the pricing strength that once allowed them to pull market-wide values higher. Deal count can recover even as the market clears more capital and space at a discount, making today’s rebound less a return to the previous cycle than a reset in what buyers will pay for scale.
Explore the full Q2 2026 report
The calculations and charts in this analysis were derived from data in the Altus Group US Commercial Real Estate Transaction Analysis - Q2 2026, which provides transaction counts, dollar volume, square footage, pricing, and deal-composition data by property type.

Leverage our real estate data and predictive analytics
The performance attribution, predictive analytics and market intelligence you need to explain performance and improve decision making.
Want to be notified of our new and relevant CRE content, articles and events?
Disclaimer
This publication has been prepared for general guidance on matters of interest only and does not constitute professional advice or services of Altus Group, its affiliates and its related entities (collectively “Altus Group”). You should not act upon the information contained in this publication without obtaining specific professional advice.
A number of factors may influence the performance of the commercial real estate market, including regulatory conditions and economic factors such as interest rate fluctuations, inflation, changing investor sentiment, and shifts in tenant demand or occupancy trends. We strongly recommend that you consult with a qualified professional to assess how these and other market dynamics may impact your investment strategy, underwriting assumptions, asset valuations, and overall portfolio performance.
No representation or warranty (express or implied) is given as to the accuracy, completeness or reliability of the information contained in this publication, or the suitability of the information for a particular purpose. To the extent permitted by law, Altus Group does not accept or assume any liability, responsibility or duty of care for any consequences of you or anyone else acting, or refraining to act, in reliance on the information contained in this publication or for any decision based on it. The distribution of this publication to you does not create, extend or revive a client relationship between Altus Group and you or any other person or entity. This publication, or any part thereof, may not be reproduced or distributed in any form for any purpose without the express written consent of Altus Group.
Author
Cole Perry
Associate Director of Research, Altus Group
Resources
Latest insights