CRE debt markets hit a rate floor in Q2 2026
SOFR flattened after nearly two years of decline while Treasury yields jumped, leaving QoQ all-in borrowing costs sideways even as YoY relief held firm.
CRE debt markets hit a rate floor in Q2 2026
SOFR flattened after nearly two years of decline while Treasury yields jumped, leaving QoQ all-in borrowing costs sideways even as YoY relief held firm.
Author

Omar Eltorai
Senior Director of Research, Altus Group

Andrew Pabon
Director Global Advisory, Altus Group
Key highlights
Total quote volume eased 4% to 1,794 from a smaller but more engaged pool of 105 participants, each reporting 17.1 quotes and about 5.3 competitive quotes for new financing
Quote activity rotated toward fixed-rate products with fixed-rate senior quotes for short-term financing, jumping 28% quarter-over-quarter, while floating senior short quotes fell 16%
SOFR has essentially bottomed, with the benchmark averaging 3.62%, down just 4 bps from Q1 2026 after four straight quarters of sharp declines
All-in rates were roughly flat, with the average all-in rate moving just -4 bps quarter-over-quarter while holding -71 bps lower year-over-year across all property types and subtypes
Treasury yields backed up hard through the quarter, with the average yield on the 5-Year UST rising 32 bps quarter-over-quarter to 409 bps and the 10-Year climbing 22 bps to 442 bps
The second quarter of 2026 marked a turning point for fixed- vs floating-rate products. For nearly two years, SOFR did the heavy lifting on lowering borrowing costs, and every quarter of Fed easing decreased floating all-in rates. But in Q2, as the Fed held rates, and the market’s expectations for a cut anytime in 2026 faded, the floating-rate product became less attractive. SOFR fell just 4 bps to a quarterly average of 362 bps, effectively finding a floor. At the same time, Treasury yields extended the backup that began in Q1, with the 5-Year and 10-Year each moving decisively higher. The direction of cost relief for new financing flipped. Fixed-rate benchmarks are climbing, floating benchmarks have leveled off, and the year-over-year (YoY) improvement that still defines the market is slowing. Based on findings from the Altus Group US Debt Capital Markets Survey for Q2 2026, which captured 1,794 quotes from 105 industry professionals, we got a clear read on where debt pricing sat at the midpoint of the year.
Quote activity and market composition
Total quotes captured in the Q2 survey came in at 1,794, down 4% quarter-over-quarter (QoQ) from Q1 2026's 1,866 and 24% below the 2,346 reported in Q2 2025. While the overall quotes collected decreased, there are still signs of an active market for CRE financing. Each participant reported an average of 17.1 quotes, up slightly from 17.0 in Q1 and matching the high-water mark set in Q2 2025. Borrowers seeking new financing received approximately 5.3 competitive quotes on average, up from 5.1 in Q1 and in line with a year ago. Lender competition remains healthy and stable, and quality assets in favored sectors continue to draw multiple bids.
Surveyed quotes: Count of quotes received by product type
Rate type | Product | Q2 2026 | Q1 2026 | QoQ %Δ | Q2 2025 | YoY %Δ |
|---|---|---|---|---|---|---|
Fixed | Senior Short (1) | 498 | 388 | 28% | 609 | -18% |
Fixed | Senior Long (2) | 312 | 358 | -13% | 286 | 9% |
Fixed | Mezzanine (2) | 83 | 73 | 14% | 118 | -30% |
Fixed | Pref. Eq. (3) | 54 | 44 | 23% | 81 | -33% |
Floating | Senior Short (4) | 608 | 720 | -16% | 958 | -37% |
Floating | Mezzanine (4) | 132 | 159 | -17% | 153 | -14% |
Floating | Repo/Facility (4) | 107 | 124 | -14% | 141 | -24% |
Total (All products) | 1,794 | 1,866 | -4% | 2,346 | -24% |
Benchmarks: 1) 5-Year US Treasury yield; 2) 10-Year US Treasury yield; 3) All-in Coupon Rate %; 4) Term SOFR
Product mix: As percentage of total quotes received
Rate type | Product | Q2 2026 | Q1 2026 | QoQ %Δ | Q2 2025 | YoY %Δ |
|---|---|---|---|---|---|---|
Fixed | Senior Short (1) | 28% | 21% | 7% | 26% | 2% |
Fixed | Senior Long (2) | 17% | 19% | -2% | 12% | 5% |
Fixed | Mezzanine (2) | 5% | 4% | 1% | 5% | 0% |
Fixed | Pref. Eq. (3) | 3% | 2% | 1% | 3% | 0% |
Floating | Senior Short (4) | 34% | 39% | -5% | 41% | -7% |
Floating | Mezzanine (4) | 7% | 9% | -1% | 7% | 1% |
Floating | Repo/Facility (4) | 6% | 7% | -1% | 6% | 0% |
Total (All products) | 100% | 100% | 100% |
Benchmarks: 1) 5-Year US Treasury yield; 2) 10-Year US Treasury yield; 3) All-in Coupon Rate %; 4) Term SOFR
The product mix tells a story of rotation. Fixed-rate senior short quotes accounted for 28% of all quotes received, a 7 percentage point (pp) increase from the prior quarter, while the share of floating-rate senior short quotes slipped 5 pp from Q1 2026 to 34% of all quotes. With SOFR no longer coming down and the market consensus of hold-or-hike for the Fed’s next move, fixed-rate financing looks more attractive. Borrowers who see a flat short-rate outlook and rising long rates have reason to lock in now rather than later. Fixed-rate senior long-term financing accounted for 17% of total quote volume, floating mezzanine at 7%, and repo/warehouse facilities at 6%.
Collateral sector mix: As percentage of total quotes received
Property type | Q2 2026 | Q1 2026 | QoQ %Δ | Q2 2025 | YoY %Δ |
|---|---|---|---|---|---|
Residential | 23% | 23% | -1% | 23% | -1% |
Industrial | 15% | 18% | -3% | 18% | -3% |
Office | 19% | 17% | 2% | 18% | 1% |
Retail | 20% | 17% | 3% | 13% | 7% |
Hotel | 6% | 8% | -1% | 10% | -4% |
Specialty | 6% | 8% | -1% | 7% | 0% |
Construction | 10% | 10% | 0% | 11% | -1% |
All Collateral | 100% | 100% | 100% |
On the collateral side, the sector mix shifted toward office and retail. Residential held the top spot in terms of quotes received, at 23% of all quotes. Retail climbed to 20%, and office rose to 19%, both gaining share on a QoQ and YoY basis. Industrial’s quote share retreated to 15%, down 3pp QoQ, hotel and specialty also saw their shares decline slightly, each eased to 6%, and construction held steady at 10%. The continued re-engagement on office financing is notable. Two quarters of stable-to-rising share and quote activity suggest lending is coming back to the beleaguered sector.
Benchmark rates: SOFR finds a floor as the curve steepens
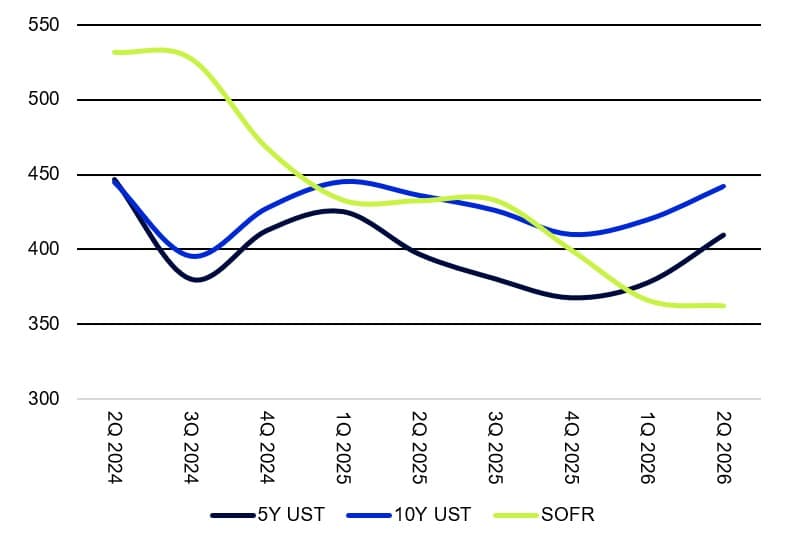
The benchmark story flipped this quarter – from declining to rising. SOFR, which had fallen 34 bps in Q1 and 67 bps YoY at that point, essentially stopped moving in Q2. Over the quarter, the SOFR averaged 362 bps, down a marginal 4 bps from 366 bps in Q1. The YoY decline is still substantial at 71 bps, but the sequential trend has flattened. Barring a fresh round of Fed cuts (unlikely per current market consensus), would-be borrowers should not expect much more relief from the benchmark side for floating-rate products.
Figure 1: Benchmark yields (Quarterly average, bps)
Source: US Treasury
Yields on US Treasury securities moved up, and with force. The yield on the 5-Year UST averaged 4.09% through Q2, up 32 bps from 3.77% in Q1 and 13 bps higher than a year ago. The yield on the 10-Year averaged 4.42%, an increase of 22 bps QoQ and 6 bps YoY. For the first time in this cycle, both Treasury tenors sit above where they were twelve months ago.
Benchmark | Q2 2026 (%) | Q1 2026 (%) | QoQ Δ (bps) | Q2 2025 (%) | YoY Δ (bps) |
|---|---|---|---|---|---|
5-Year UST | 4.09 | 3.77 | +32 | 3.97 | +13 |
10-Year UST | 4.42 | 4.20 | +22 | 4.36 | +6 |
Term SOFR | 3.62 | 3.66 | -4 | 4.32 | -70 |
This divergence is the defining feature of the quarter. Floating all-in costs held steady while fixed all-in costs pushed higher. Spread compression, covered below, softened the blow for fixed borrowers, but it could not fully offset a 32 bps move in the 5-Year benchmark.
Spreads: Compression continues, mostly on the floating side
Spreads continued to tighten in Q2 2026, with the sharpest moves on the floating side. The biggest floating-rate spread movements (QoQ) were lower-leverage floating-rate senior short-term products, which came in at 239 bps over SOFR, down from roughly 267 bps last quarter. Repo/facility financing also came down meaningfully, to a quote-weighted average of 176 bps, from 206 bps in Q1 2026 and 232 bps a year prior.
Spreads: Average spread by product type
Rate type | Product | Leverage (LTV) | Q2 2026 | Q1 2026 | QoQ %Δ | Q2 2025 | YoY %Δ |
|---|---|---|---|---|---|---|---|
Fixed | Senior Short (1) | Lower (≤65%) | 216 | 218 | -1% | 270 | -20% |
Fixed | Senior Short (1) | Higher (>65%) | 313 | 303 | 3% | 389 | -19% |
Fixed | Senior Long (2) | Lower (≤65%) | 195 | 203 | -4% | 221 | -12% |
Fixed | Senior Long (2) | Higher (>65%) | 249 | 273 | -9% | 313 | -21% |
Fixed | Mezzanine (2) | 70-90% | 759 | 787 | -4% | 996 | -24% |
Fixed | Pref. Eq. (3) | ≥70% | 13.57 | 13.19 | 3% | 12.18 | 11% |
Floating | Senior Short (4) | Lower (≤65%) | 239 | 267 | -10% | 283 | -16% |
Floating | Senior Short (4) | Higher (>65%) | 332 | 348 | -4% | 402 | -17% |
Floating | Mezzanine (4) | 70-90% | 721 | 762 | -5% | 851 | -15% |
Floating | Repo/Facility (4) | Adv Rate (50-80%) | 176 | 206 | -14% | 232 | -24% |
Benchmarks: 1) 5-Year US Treasury yield; 2) 10-Year US Treasury yield; 3) All-in Coupon Rate %; 4) Term SOFR
The fixed-rate side saw less overall spread compression. Lower-leverage fixed senior short held near 216 bps over the 5-Year, roughly flat with the prior quarter, while higher-leverage fixed senior short widened modestly to 313 bps, up 10 bps QoQ. Higher-leverage fixed-rate senior long-term financing saw the most spread compression of fixed-rate products, down about 24 bps QoQ to 249 bps. Preferred equity saw coupons rise on both a QoQ and YoY basis.
Senior-short spreads: Average spreads by select collateral type*
Property type | Q2 2026 | Q1 2026 | QoQ %Δ | Q2 2025 | YoY %Δ |
|---|---|---|---|---|---|
Residential | 218 | 240 | -9% | 267 | -18% |
Industrial | 231 | 247 | -6% | 264 | -13% |
Office | 318 | 330 | -3% | 379 | -16% |
Retail | 268 | 296 | -9% | 352 | -24% |
Hotel | 337 | 324 | 4% | 406 | -17% |
Specialty | 341 | 302 | 13% | 397 | -14% |
Construction | 324 | 344 | -6% | 437 | -26% |
Note: Average spreads for senior, short-term fixed and floating rate debt; not all property types shown
All-in rates: The easy gains are behind us
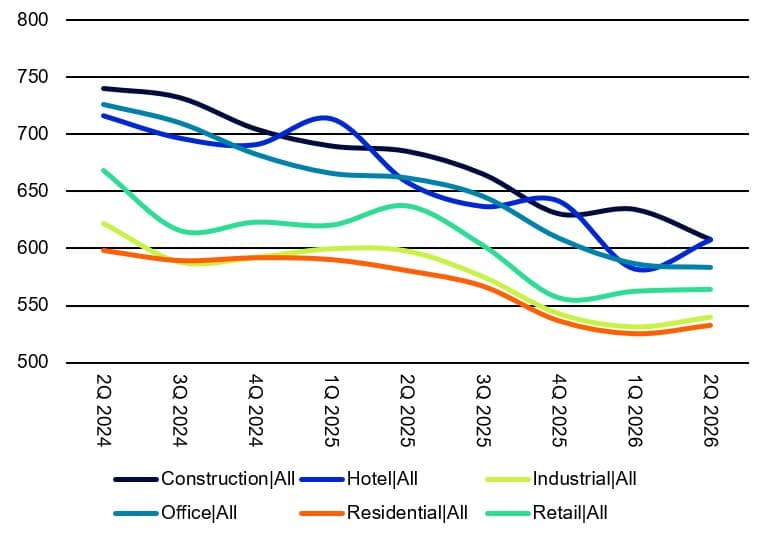
The all-in rate is the number that matters most to a borrower, and in Q2 it barely moved. Across all property types and subtypes, the average all-in rate fell just 4 bps QoQ. That is a sharp deceleration from the average 10 bps decline in Q1, and the 45 bps decline seen in Q4 2025. The YoY picture is still strongly favorable, with the average all-in rate down 71 bps from a year ago, but the sequential declines are slowing. In fact, most property types edged higher on the quarter as the Treasury backup outran spread compression.
At the property type level, construction was the biggest mover in terms of falling all-in rates, declining 26 bps QoQ to 608 bps and down 77 bps YoY. That decrease was driven almost entirely by one subtype; office construction all-in rates collapsed 178 bps to 619 bps, unwinding the 133 bps spike that made it the first quarter’s most conspicuous outlier at 797 bps. Whatever repricing shock hit new office development last quarter has largely reversed, though its all-in rate of 6.19% remains among the most costly in the survey. Quoted retail construction financing also fell, down 57 bps to 5.99%.
After leading all sectors lower in Q1 with a 59 bps drop, hotel all-in rates rose 25 bps this quarter to 6.07%, the largest increase of any property type. Limited service led the move, climbing 42 bps to 6.15%, while full service edged up 9 bps to 6.00%. This looks less like renewed caution and more like a give-back after an aggressive repricing, with both subtypes still down more than 40 bps YoY.
Office continued its slow grind lower even as the broader market flattened. Office all-in rates slipped 3 bps QoQ to 5.84% and remain 78 bps below a year ago. Trophy office was flat on the quarter at 5.67% but posted the steepest YoY decline in the sector at 88 bps, or 13.5%. Medical office fell 14 bps to 5.58%, the lowest all-in rate in the office category. The narrowing gap between trophy and commodity product suggests capital is still spreading through the sector rather than clustering only at the top.
Residential and industrial, the two lowest-cost conventional asset classes, both ticked up with the Treasury move. Residential rose 7 bps to 5.33% and industrial rose 9 bps to 5.40%, though each remains down 48 bps and 57 bps YoY respectively. Apartment remained the cheapest financing in the survey at 5.22%. Retail was essentially flat at 5.64%, up 2 bps on the quarter but down 73 bps YoY, with the standout being retail mall, still down a striking 159 bps to 5.86% YoY. Specialty rose 12 bps to 5.83% yet posted the largest YoY decline of any property type at 90 bps, with self-storage the lone subtype to fall on the quarter.
Figure 2: All-in rates (Assume 65% senior, 15% mezzanine; bps)
Source: Altus Group US Debt Capital Markets Survey (Q2 2024 - Q1 2026)
Looking ahead
The survey closed the book on a quarter where SOFR found its floor. What has happened since quarter-end is more telling. The market has stopped debating rate cuts and started pricing the opposite. Fed funds futures now put better than two-thirds odds on a hike before year-end, with the policy rate seen drifting toward 4% from today's 3.50% to 3.75% range. The July 28-29 FOMC meeting should be a hold, but the committee has kept its tightening option open, and the June dot plot leaned that way. That flips the calculus for every floating-rate borrower. The base case is no longer wait for the next cut, it may be the next move up.
The long end offers no refuge. The 10-Year has pushed up, well above its Q2 average. The 5-Year, too, has risen. Sticky services inflation, a labor market that keeps surprising to the firm side, and fresh (continued) energy-price risk out of the Strait of Hormuz all argue for a higher-for-longer front end and a term premium unlikely to compress. The disinflation story is real, but it is no longer linear, and the bond market is treating every soft print as a reason to fade the rally rather than chase it.
For CRE, the implication is direct. The relief window that defined 2025 is closing on both legs of the curve at once. The borrowers who rotated into fixed this quarter read the tape correctly. The ones still holding out for a lower SOFR print may be waiting through a hike instead. Underwrite to a flat-to-higher rate path, hold onto rate-cap optionality while it is still reasonably priced, and treat any near-term rally in the belly of the curve as a chance to lock rather than a trend to ride.

Boost investor confidence with independently managed valuations
Independent appraisals trusted by funds, investors, lenders, and public entities around the world.
Want to be notified of our new and relevant CRE content, articles and events?
Disclaimer
This publication has been prepared for general guidance on matters of interest only and does not constitute professional advice or services of Altus Group, its affiliates and its related entities (collectively “Altus Group”). You should not act upon the information contained in this publication without obtaining specific professional advice.
A number of factors may influence the performance of the commercial real estate market, including regulatory conditions and economic factors such as interest rate fluctuations, inflation, changing investor sentiment, and shifts in tenant demand or occupancy trends. We strongly recommend that you consult with a qualified professional to assess how these and other market dynamics may impact your investment strategy, underwriting assumptions, asset valuations, and overall portfolio performance.
No representation or warranty (express or implied) is given as to the accuracy, completeness or reliability of the information contained in this publication, or the suitability of the information for a particular purpose. To the extent permitted by law, Altus Group does not accept or assume any liability, responsibility or duty of care for any consequences of you or anyone else acting, or refraining to act, in reliance on the information contained in this publication or for any decision based on it. The distribution of this publication to you does not create, extend or revive a client relationship between Altus Group and you or any other person or entity. This publication, or any part thereof, may not be reproduced or distributed in any form for any purpose without the express written consent of Altus Group.
Author
Omar Eltorai
Senior Director of Research, Altus Group
Andrew Pabon
Director Global Advisory, Altus Group
Resources
Latest insights