Where value is created in data center land
What institutional investors need to know about the three factors that drive data center land value.
Where value is created in data center land
What institutional investors need to know about the three factors that drive data center land value.
Author

Adam Mauro, CFA
Director, Valuation Advisory, Altus Group
Key highlights:
Committed utility load capacity is the strongest predictor of data center land pricing, with Northern Virginia's median reaching $2.8M per acre compared to as low as $28K per acre in underserved markets
Sites within half a mile of a high-voltage substation trade at roughly twice the price of comparable sites two to five miles away, making infrastructure proximity a primary comp adjustment
The 120 times spread in per acre pricing across parcel sizes reflects execution risk, not quality; greenfield and infill sites require separate comp frameworks
Data center development is moving fast, and land values are moving with it. But the pricing signals that matter most aren't always the ones transaction records make obvious. This analysis draws on 80 verified land transactions from RCA and infrastructure data from Cliff, a platform that tracks zoning, permitting, and power interconnection data for data center sites, to identify the three variables that drive data center land value: committed power capacity at the market level, physical proximity to electrical infrastructure, and parcel size. Understanding how each factor works, and how they interact, gives institutional investors and appraisers a more accurate foundation for underwriting and portfolio valuation.
Power commitment is the primary pricing variable
After our review of 80 data center land transactions with verified price and acreage data, we have found that committed DC load is the strongest variable for land pricing zoned for data center use. Markets with high utility-committed capacity are, without exception, the most active and most expensive data center land markets in the country. Northern Virginia prices at a median of $2.8M per acre. Central Ohio, Phoenix, and Atlanta; all markets where utilities have made large-scale grid investments and committed capacity for data center load, price between $100K and $460K per acre, and markets with limited committed load trade as low as $28K per acre at the median.
This is not a coincidence of geography. Committed DC load capacity signals to the market that the fundamental constraint on data center development has been solved. It tells a developer that feasibility studies are likely to succeed, utility engineering teams have workflows in place, and that the regulatory environment has accommodated large-scale load growth. The land premium in high-committed-load markets reflects all of that embedded infrastructure and institutional readiness.
In Texas, the distinction between requested and verified capacity became the story. Governor Abbott directed ERCOT and the PUCT to audit every data center advancing through the interconnection queue, halting new grid connections until the review is complete. The moratorium touches roughly 1,800 projects and 474 GW of power requests (far outpacing Texas’ actual delivery capacity). While we believe value in data center land is created by securing power and regulatory certainty, it can also be re-exposed by regulatory action entirely outside a developer's control, and legal advisors are already urging parties to reevaluate in-service dates and contractual timelines.
The implication for investors: the committed DC load figure for a given utility territory is a leading indicator of where data center land values will concentrate. Markets where utilities are actively expanding committed capacity are the markets where land pricing power is building. But as Texas shows, power de-risking should be treated as a current condition to monitor, not a permanent attribute of a site.
The de-risking model that sophisticated buyers use
Conversations with active data center land acquirers reveal an operational model that differs substantially from what transaction records suggest. Institutional developers with hyperscale build-to-suit mandates are not buying land and then pursuing entitlements and power. They are transacting only after both threads have been substantially resolved. The development process looks less like a linear stage-gate from task A to task B and more like a parallel workstream, as illustrated below.
Figure 1: The parallel de-risking model - value is created before the transaction records
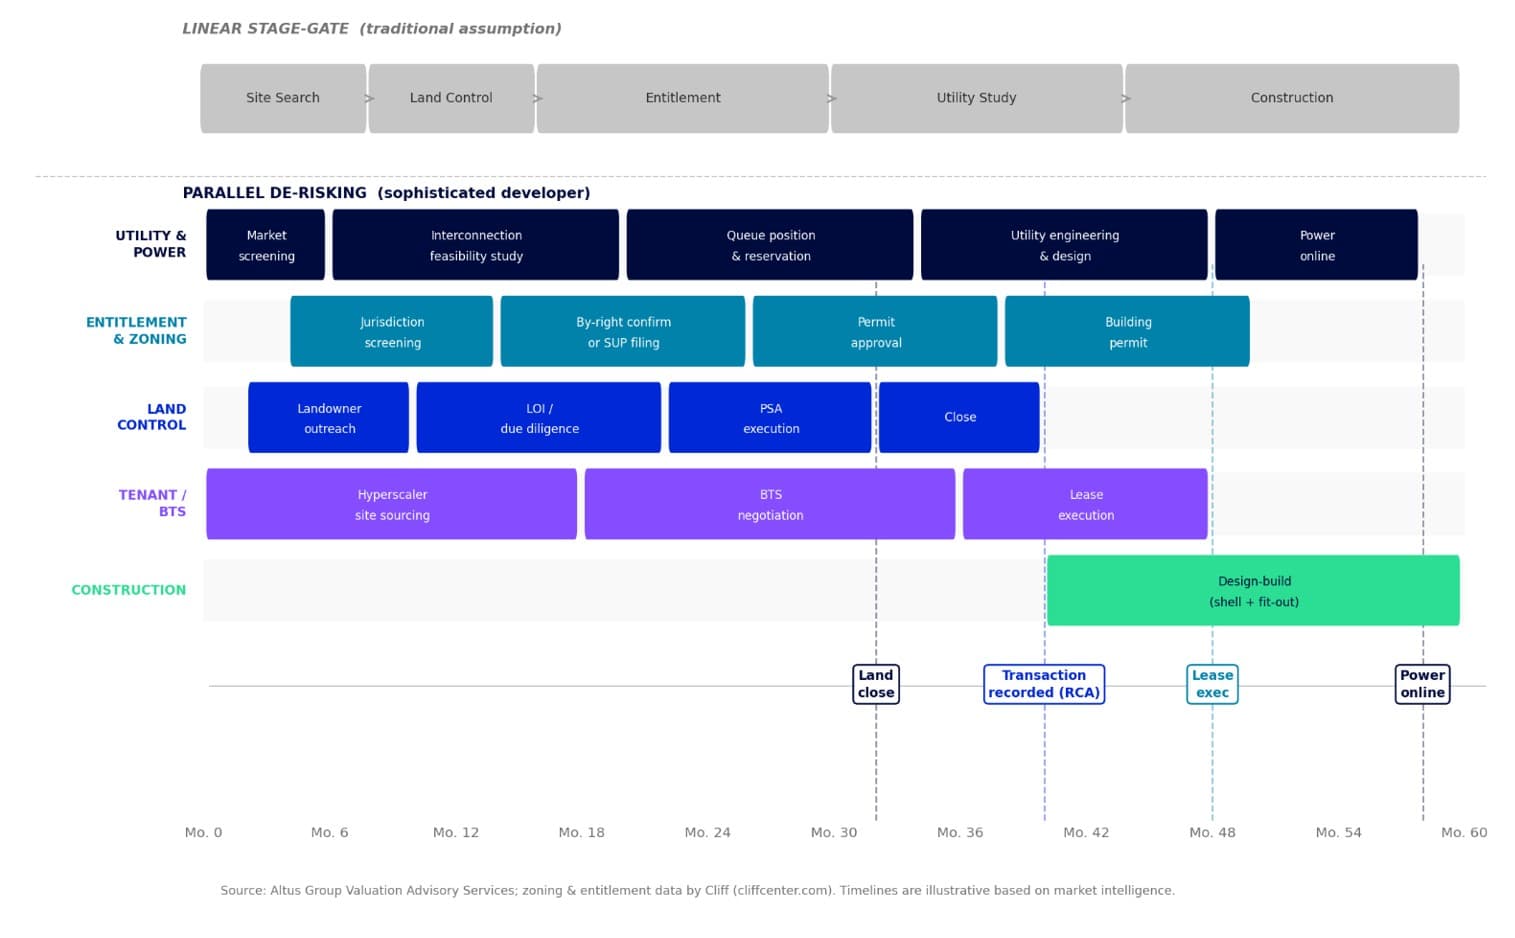
Sophisticated institutional developers run utility, entitlement, land, and tenant workstreams concurrently, not as a linear sequence
The diagram captures a critical valuation insight: by the time a land transaction appears in a database as "announced" or "permitted," typically 30–40 months of concurrent utility coordination, entitlement work, and tenant negotiation has already been completed and priced in. The transaction is the exit of the de-risking process, not the entry.
Utility coordination begins before land control is established. Engineering teams work directly with transmission operators (such as Dominion Energy in Northern Virginia, AEP in Ohio, SRP in Arizona) to identify available interconnection capacity, initiate feasibility studies, and reserve queue position. This work takes 18–36 months in unconstrained markets and significantly longer in constrained ones. It is the primary bottleneck on site supply and the primary barrier to entry for less operationally sophisticated developers.
Entitlement is pursued concurrently, not sequentially. By-right zoning or administrative approval is strongly preferred; discretionary rezoning is avoided because it introduces timeline risk that cannot be hedged. Sites requiring special use permits or comprehensive plan amendments are priced accordingly. Zoning status and permit stack analysis for this study was sourced from Cliff, an AI-native site readiness platform that aggregates live regulatory dockets, zoning approvals, special-use permit history, and interconnection queue health for data center developers.
Hyperscalers increasingly source sites directly. In many build-to-suit transactions, the tenant identifies the site, negotiates with the landowner, and brings the developer in as the capitalized execution partner. This inverts the traditional developer risk stack: the developer carries construction and cost risk, but leasing and power risk is substantially completed at the time of transaction.
The implication for appraisers and investors is development status descriptions in transaction databases are lagging indicators of a de-risking process that began well before any recorded trade. A site described as "announced" in a transaction record may have significant utility coordination and entitlement work embedded in its price. Benchmarks completed that are invisible to a purely comp-based underwriting approach. Understanding what a seller actually did to bring a site to market is as important as knowing the price at which it cleared.
Figure 2: Where value is created - land re-rates as power de-risks
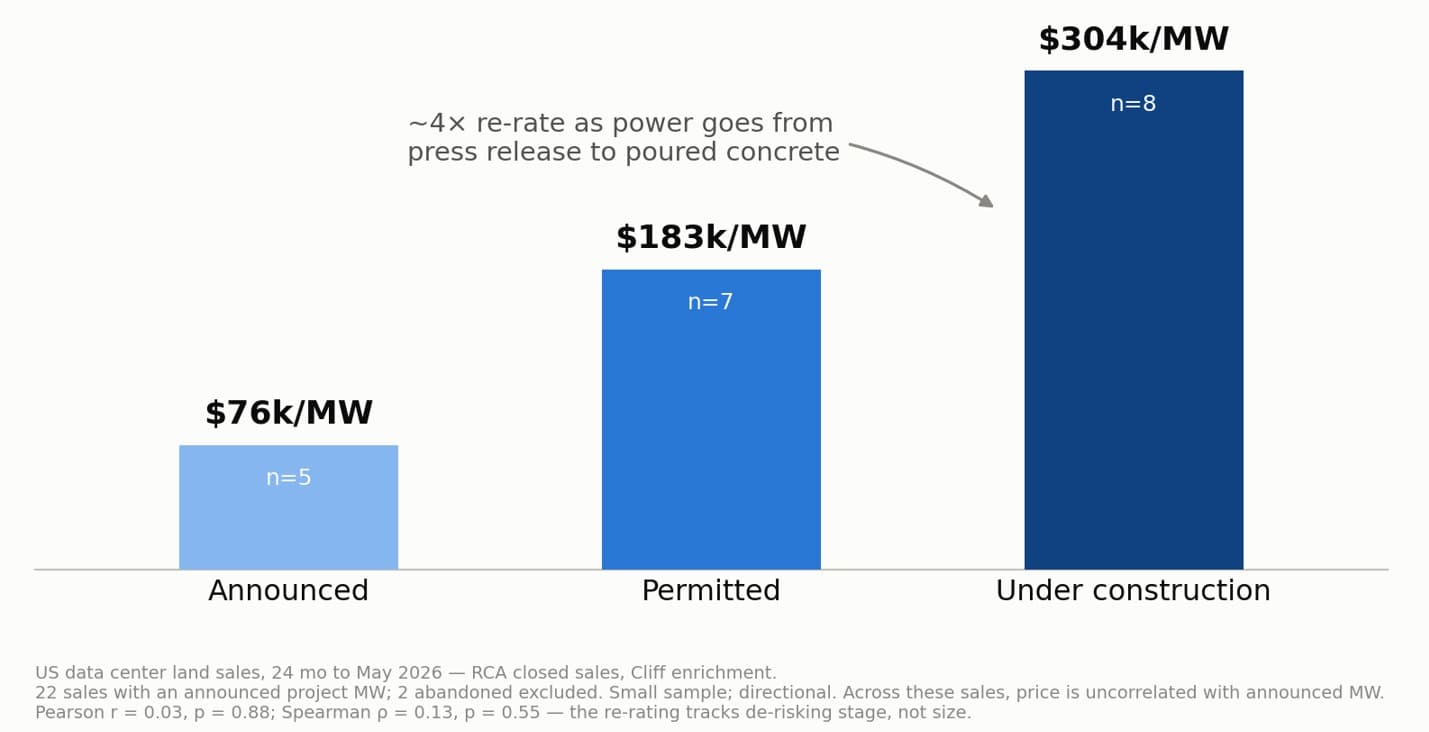
Median land price per announced project MW, by development status at sales
Within a market, distance to infrastructure is what prices the land
Once an investor has identified a high-committed-load metropolitan statistical area (MSA), the primary differentiator between individual sites is physical proximity to existing electrical infrastructure. Infrastructure proximity data sourced from Cliff, shows sites within half a mile of an existing substation trade at approximately twice the per acre price of comparable sites two to five miles away. Transmission voltage compounds the effect. Lines operating at 230kV or 500kV — the thresholds relevant for hyperscale load requirements — command a premium of roughly 2.4× over sites served only by 138kV or lower infrastructure.
Figure 3: Infrastructure proximity drives significant $/acre premiums within a market
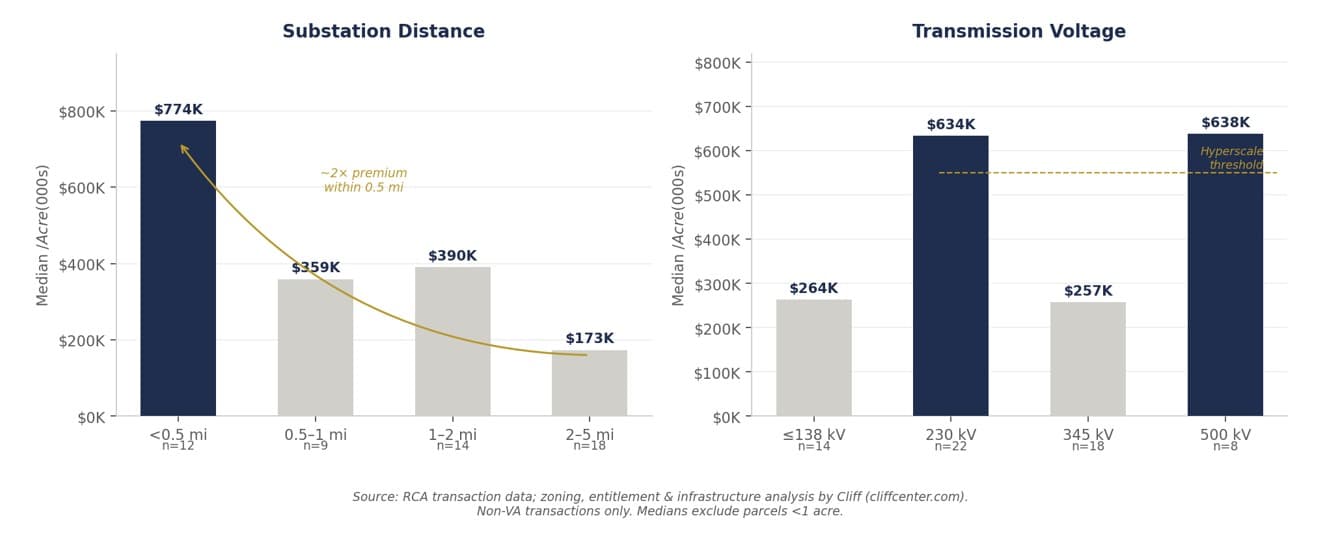
Figure 4: RCA data center land comparables set vs. key substations
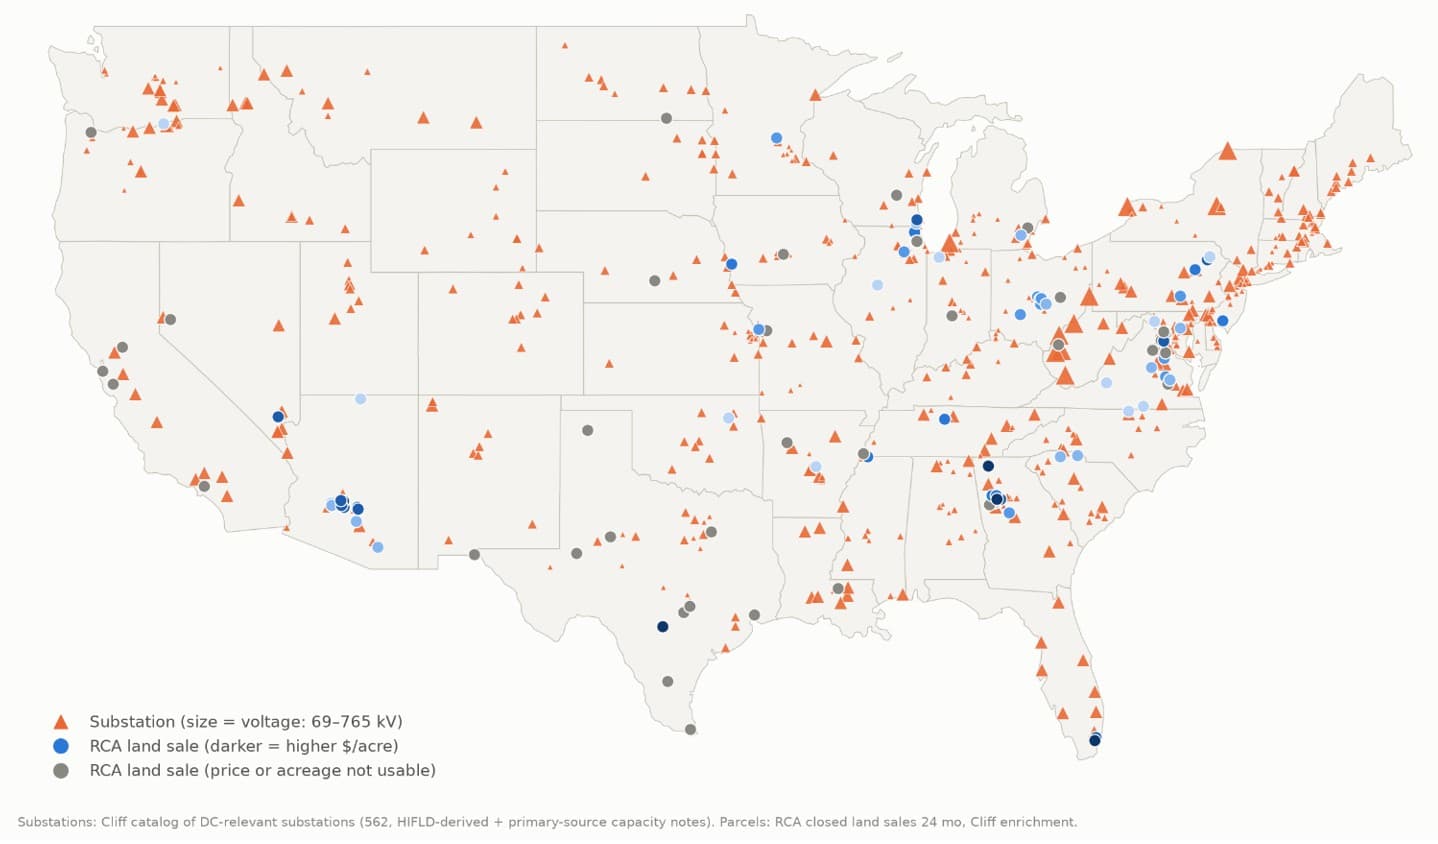
A site adjacent to a high-voltage substation has already solved the most capital-intensive and time-consuming piece of the power delivery problem. The developer does not need to fund a transmission extension, negotiate new substation construction with the utility, or wait for that infrastructure to be permitted and built. That time and capital saving is real, and the market prices it directly into the land.
For investors benchmarking land positions, this means that substation distance and transmission voltage tier should be treated as first-order adjustments in any comp analysis. A site that appears cheap on a per acre basis relative to market comps, but sits two miles from the nearest substation on a 138kV line, is not cheap. The discount is compensating for a real infrastructure gap.
Parcel size is a structural discount, not a quality signal
The transaction data shows a ~120 times spread in per acre pricing from the smallest to the largest parcels in the dataset, from a median of $3.3M per acre for sites under 25 acres to $28K per acre for sites exceeding 1,000 acres. This is frequently misread as a quality differential.
Large greenfield sites, typically defined as 300- to 1,000-acre assemblages that hyperscalers acquire for multi-phase campus development, are priced to reflect the capital, time, and execution risk required to bring them to productive use. The buyer must fund the carry, the infrastructure extensions, the entitlement process, and, in many cases, the utility substation construction before a single megawatt of capacity is delivered.
That burden is priced into the land at acquisition. Small infill sites, by contrast, are typically already adjacent to substations, already zoned for the use, and can begin construction immediately. The per acre premium for infill is compensation for immediacy and certainty, not an indicator of superior underlying real estate.
The practical consequence for comp analysis is that per acre figures are not comparable across size tiers without explicit adjustment. A 500-acre greenfield comp and a 15-acre infill comp in the same submarket are fundamentally different risk and return profiles. Investors applying unadjusted per acre comps across size categories will systematically misprice the positions they are marking.
Implications for underwriting and portfolio valuation
This analysis points to three adjustments for institutional investors underwriting or marking data center land positions:
Committed DC load capacity at the MSA level should be a threshold screen. Before evaluating any individual site characteristic, confirm that the utility serving the market has made a clear commitment to supporting large-scale data center load. Markets without that commitment will not sustain institutional land values regardless of their entitlement status or infrastructure proximity.
Substation distance and transmission voltage must be treated as primary comp adjustments. Per acre benchmarks drawn from transactions without controlling for infrastructure proximity are not actionable. A site two miles from the nearest substation on a 138kV line should not be marked against comps from sites adjacent to 230kV or 500kV infrastructure.
Parcel size must be stratified before any per acre comparison is applied. The 120 times spread in per acre pricing across size tiers is not a quality gradient, it reflects the embedded cost of bringing large greenfield sites to productive use. Appraisers and investors who apply infill per acre comps to greenfield positions, or vice versa, will produce materially incorrect marks.
Applied together, these three adjustments give investors a more complete, defensible picture of where data center land value is created.

Boost investor confidence with independently managed valuations
Independent appraisals trusted by funds, investors, lenders, and public entities around the world.
Want to be notified of our new and relevant CRE content, articles and events?
Disclaimer
This publication has been prepared for general guidance on matters of interest only and does not constitute professional advice or services of Altus Group, its affiliates and its related entities (collectively “Altus Group”). You should not act upon the information contained in this publication without obtaining specific professional advice.
A number of factors may influence the performance of the commercial real estate market, including regulatory conditions and economic factors such as interest rate fluctuations, inflation, changing investor sentiment, and shifts in tenant demand or occupancy trends. We strongly recommend that you consult with a qualified professional to assess how these and other market dynamics may impact your investment strategy, underwriting assumptions, asset valuations, and overall portfolio performance.
No representation or warranty (express or implied) is given as to the accuracy, completeness or reliability of the information contained in this publication, or the suitability of the information for a particular purpose. To the extent permitted by law, Altus Group does not accept or assume any liability, responsibility or duty of care for any consequences of you or anyone else acting, or refraining to act, in reliance on the information contained in this publication or for any decision based on it. The distribution of this publication to you does not create, extend or revive a client relationship between Altus Group and you or any other person or entity. This publication, or any part thereof, may not be reproduced or distributed in any form for any purpose without the express written consent of Altus Group.
Author
Adam Mauro, CFA
Director, Valuation Advisory, Altus Group
Resources
Latest valuation insights





Jun 2, 2026
Performance under pressure: What four CRE leaders agree on, and why it starts with data