US commercial real estate transaction analysis – Q2 2026
US CRE continued to recover in Q2 2026, with increased transactions, rising prices, and a shift in investor preferences toward larger, higher-quality assets.
US commercial real estate transaction analysis – Q2 2026
US CRE continued to recover in Q2 2026, with increased transactions, rising prices, and a shift in investor preferences toward larger, higher-quality assets.
Authors

Omar Eltorai
Senior Director of Research, Altus Group

Cole Perry
Associate Director of Research, Altus Group
Key highlights
Based on analysis of data from Reonomy
Transaction activity improved quarter-over-quarter, with properties transacted up 6.7%, dollar volume up 11.3%, and transacted square footage up 10.3%, highlighting continued momentum in capital markets
On a trailing four-quarter basis, transaction volume increased 16.3% year-over-year, while the count of properties transacted rose 6.0%, reinforcing that the recovery cycle remains intact
Median price per square foot transacted across all property types increased 8.6% from a year earlier, led by industrial properties (+13.2%)
New metrics introduced this quarter reveal important shifts in market structure, including changes in the median age of transacted properties and the growing share of transaction value coming from deals larger than $10 million
By mid-August 2026, investors remain focused on larger, higher-quality assets, with capital increasingly concentrated in sectors and markets demonstrating durable operating fundamentals
CRE market recovery continues, selectively
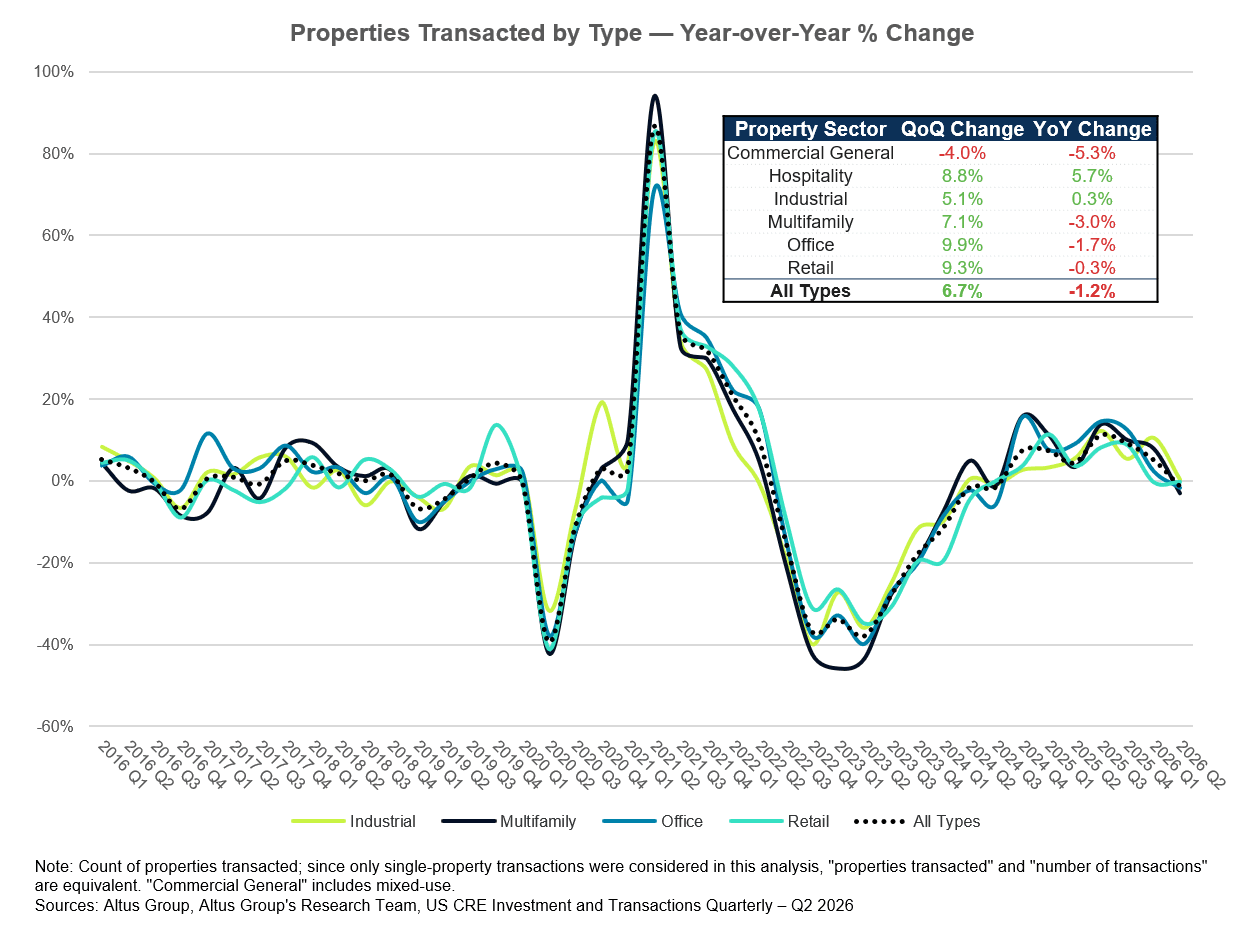
The second quarter of 2026 offered further evidence that the US commercial real estate (CRE) investment market remains on a recovery path. While transaction counts were modestly lower than a year ago (down 1.2% compared to Q2 2025), activity accelerated meaningfully compared with the first quarter. Transaction volume, transaction square footage, and transaction counts all moved higher on a quarterly basis, suggesting investors became increasingly willing to deploy capital despite an environment still shaped by elevated financing costs and shifting economic expectations.
Broader capital markets were relatively constructive through the quarter, and generally improved from the preceding quarter. Calmer credit markets, improving financing availability, and greater clarity around economic growth expectations helped support transaction activity. By mid-August 2026, the market is still digesting the implications of changing US monetary policy expectations, evolving growth outlooks, and the implications of a prolonged conflict in the Middle East; but CRE appears to be benefiting from a gradual improvement in investor confidence. Importantly, that confidence remains selective rather than indiscriminate. Investors continue to prioritize asset quality, durable income streams, and opportunities where operational performance can drive returns.
Commercial property transaction activity and capital flows
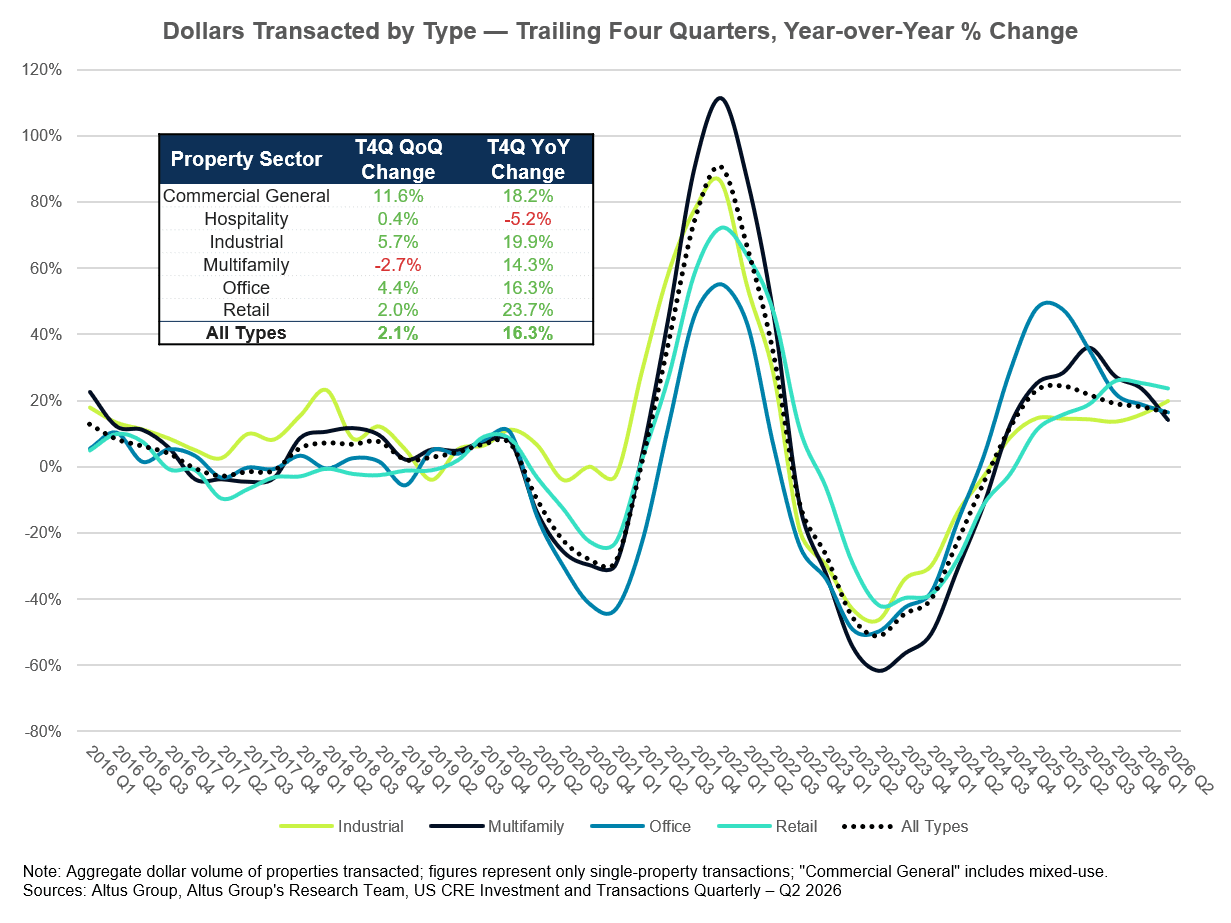
National transaction activity strengthened in Q2 2026. Total properties transacted increased 6.7% quarter over quarter (QoQ), while aggregate dollar volume rose 11.3%. Gains were even more pronounced in several major sectors. Commercial General and Mixed Use led quarterly dollar-volume growth (+25.7%), followed by Industrial (+22.2%) and Hospitality (+18.6%). On a year-over-year (YoY) basis, Commercial General and Mixed Use posted the strongest increase in transaction volume (+52.4%), while Industrial (+26.0%) and Office (+18.9%) also delivered sizable gains.
Figure 1: Transaction rose 6.7% QoQ but remain 1.2% below last year
Looking beyond a single quarter, the trailing-four-quarter trends are perhaps even more encouraging. Aggregate transaction volume increased 16.3% YoY while transaction counts rose 6.0%. These metrics suggest that the recovery first observed during 2025 has continued into 2026, with capital markets gradually reopening and buyers becoming more active.
Figure 2: Trailing 4Q dollar volume up 16.3% YoY on broad-based sector gains
Commercial property pricing continues upward trend
Pricing continued to move higher across most property sectors. Median transaction price per square foot for assets larger than 5,000 square feet reached $131/SF in Q2 2026, up 2.3% from the prior quarter and 8.6% from a year earlier. Industrial remained the strongest major sector, with median pricing increasing 13.2% YoY to $113/SF. Within Industrial, Storage (+24.0%) and Warehouse/Distribution (+15.2%) led gains.
Figure 3: Pricing by property type – Since Q1 2016
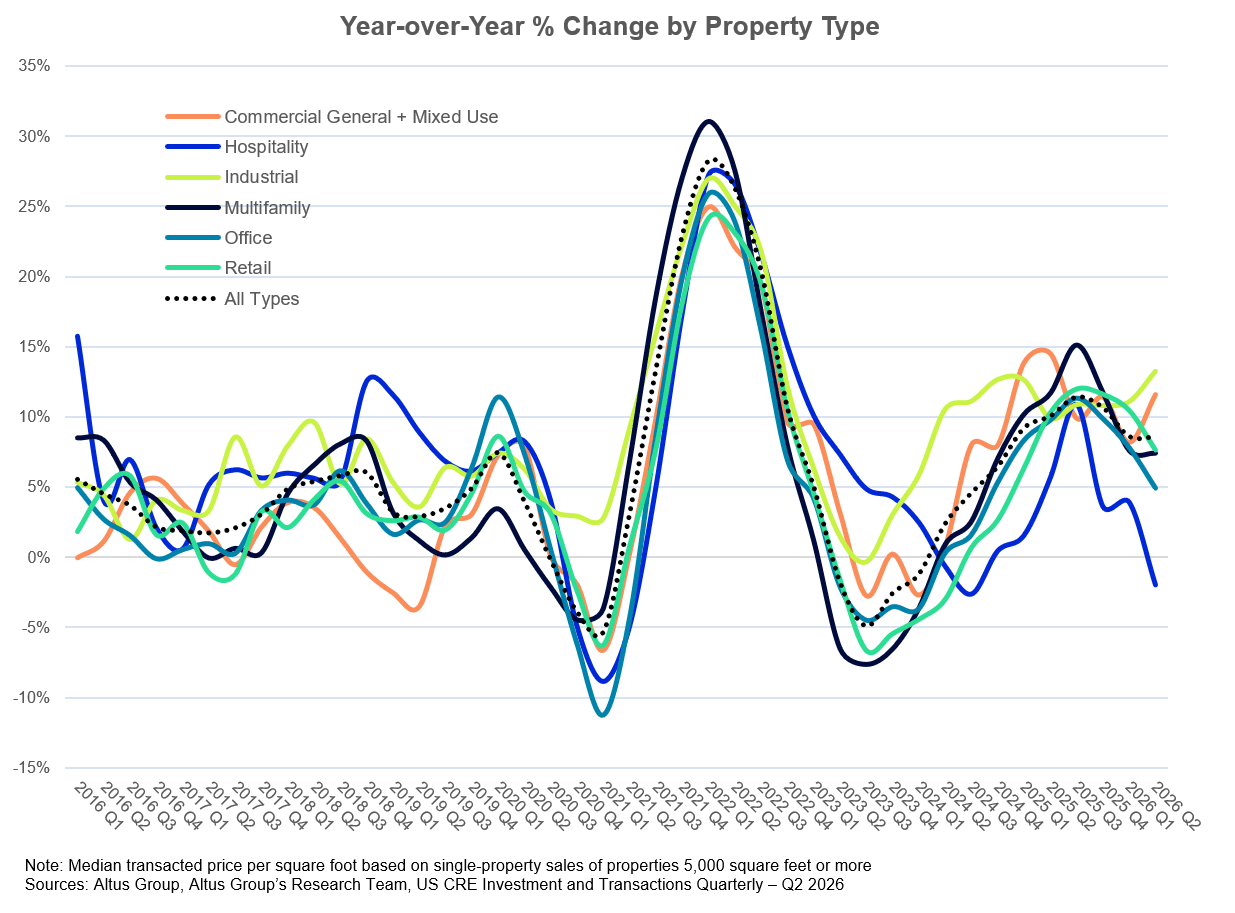
Multifamily pricing climbed to $151/SF (+7.4% YoY), while Retail increased to $142/SF (+7.6%). Office pricing was largely unchanged from the prior quarter but remained 4.9% above Q2 2025. Hospitality was the lone major sector to register an annual decline in pricing, with median pricing slipping 2.0% YoY.
Changing CRE investment landscape
This quarter introduces several new measures that provide additional insight into investor behavior and transaction composition. First, quarterly and trailing-four-quarter annual growth statistics have returned to the report, offering a clearer view of both short-term momentum and longer-term trends.
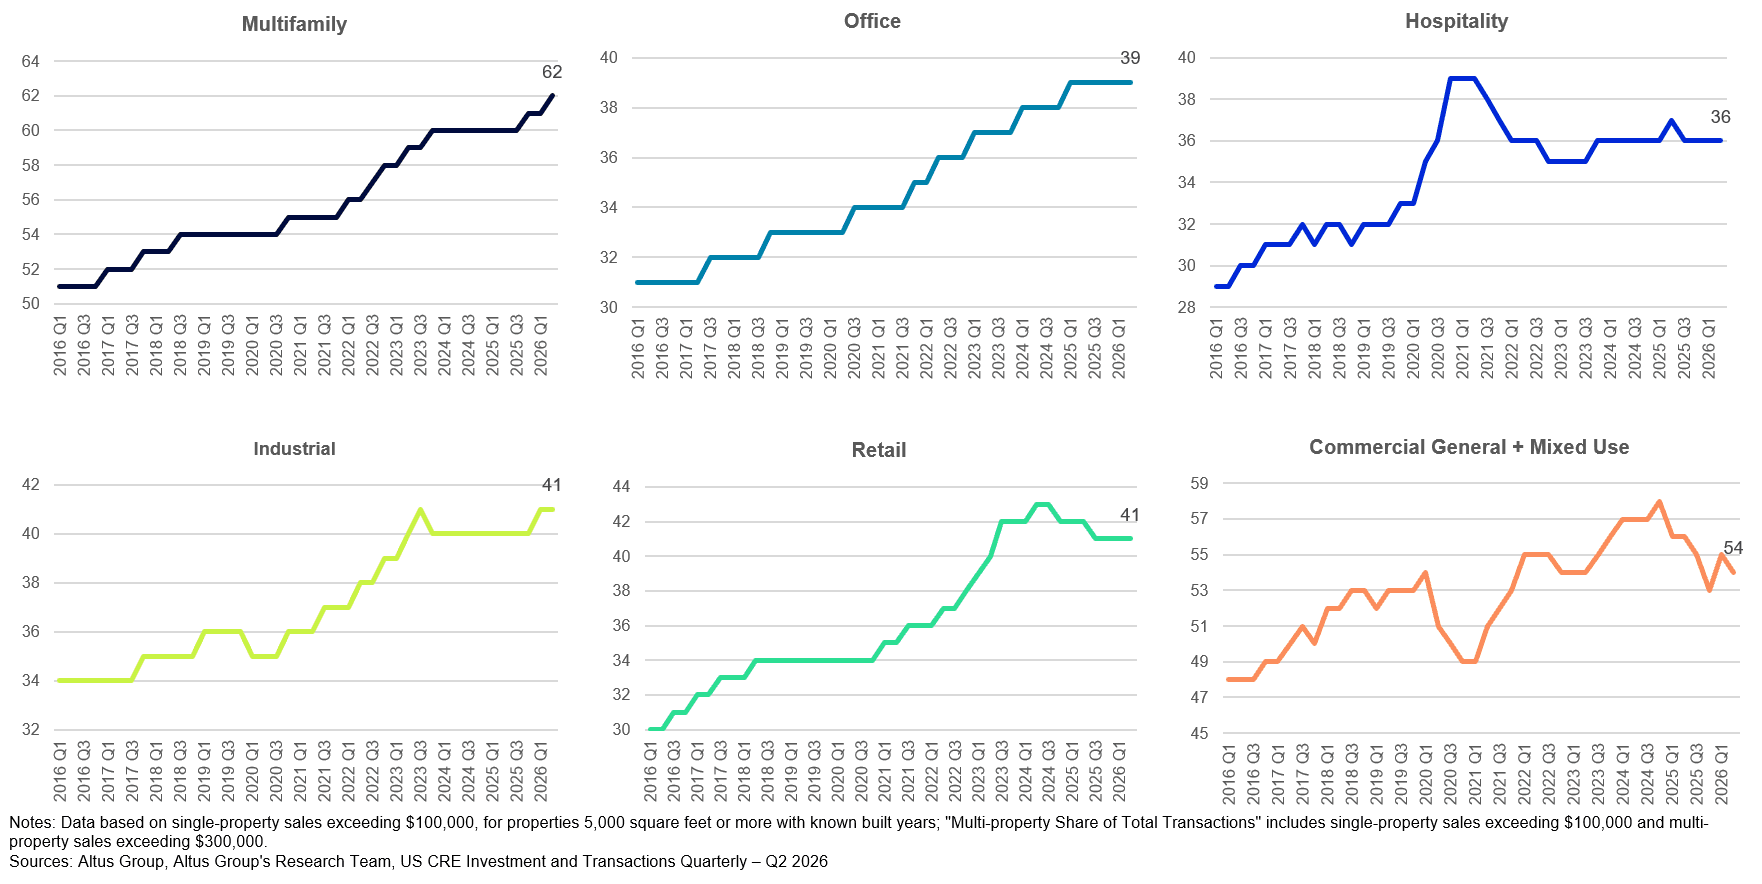
Second, the property-sector dashboards now include median age of transacted properties. This metric highlights changing investor preferences across asset vintages. Multifamily properties changing hands continue to age, with the median transacted asset now approximately 62 years old, up roughly two years from a year ago. In contrast, Commercial General and Mixed Use assets have trended younger. These differences may reflect diverging investment strategies, redevelopment expectations, and capital allocation decisions across sectors.
Figure 4: Median age of transacted property by property type
Third, the report now tracks the share of transaction value represented by deals exceeding $10 million. This new metric helps illustrate the degree to which institutional and larger-scale capital are participating in the market. One of the most notable shifts occurred within Commercial General and Mixed Use, where the share of transaction value attributable to deals above $10 million expanded significantly over both the quarter and the year. More broadly, the data reinforce a theme that has appeared repeatedly throughout the recovery: larger transactions are increasingly accounting for a greater share of market activity.
Figure 5: Share of value from transactions greater than $10M
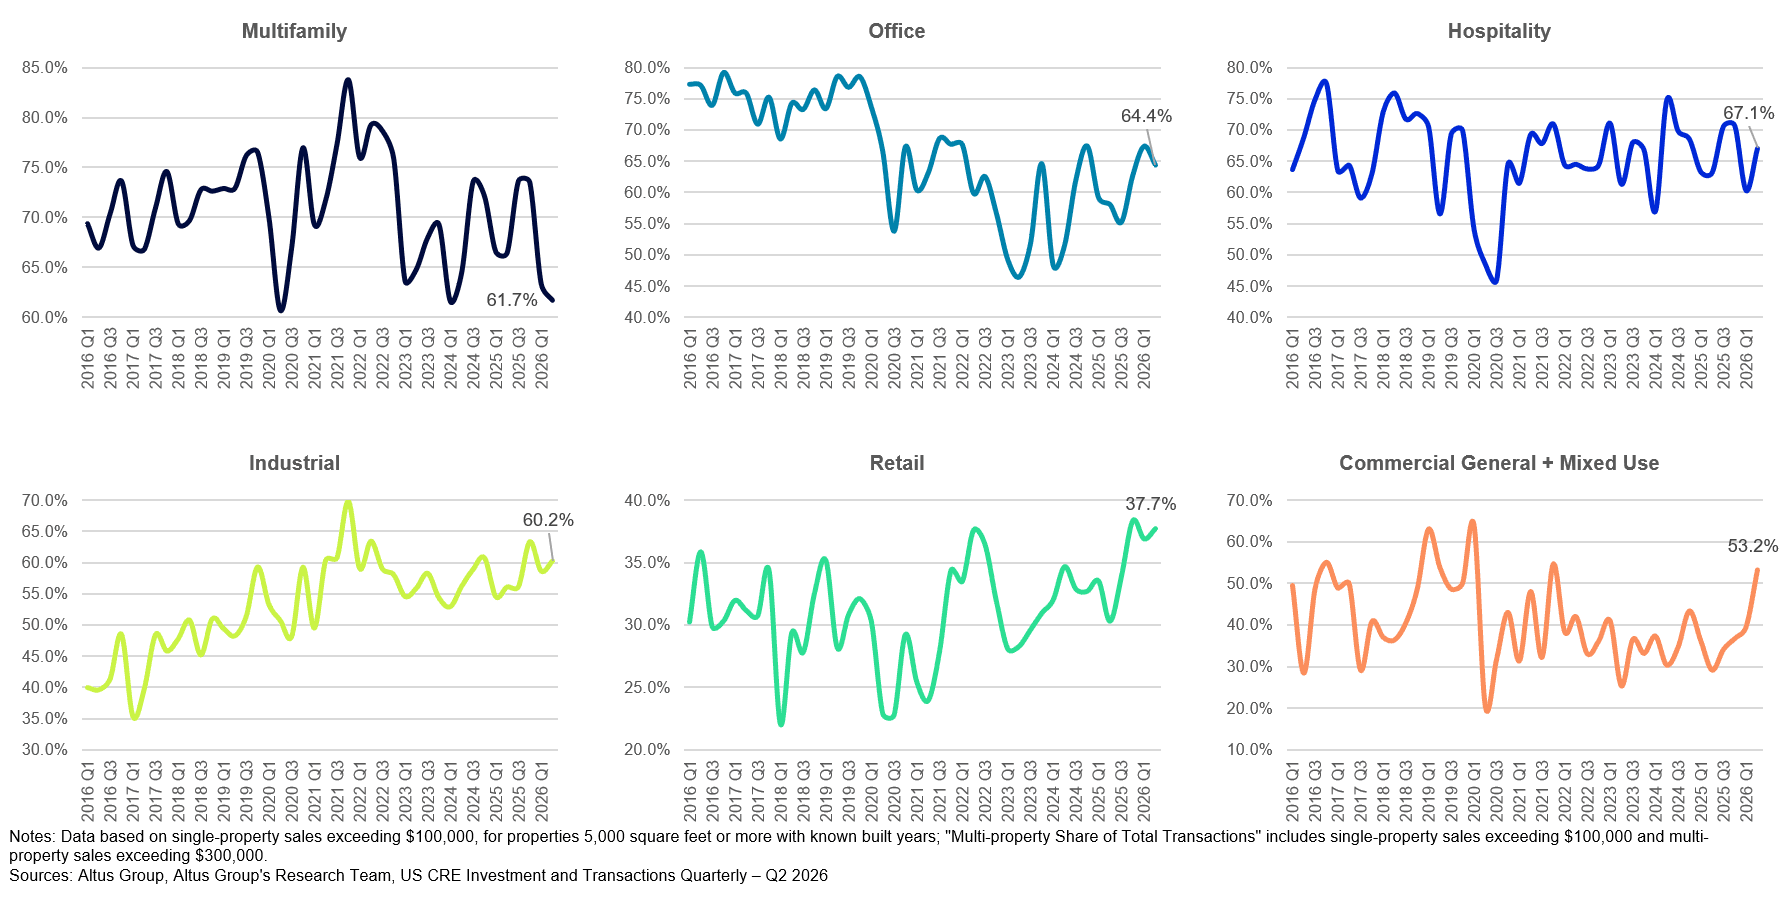
Sector summaries
Figure 6: Median property transaction price per square foot
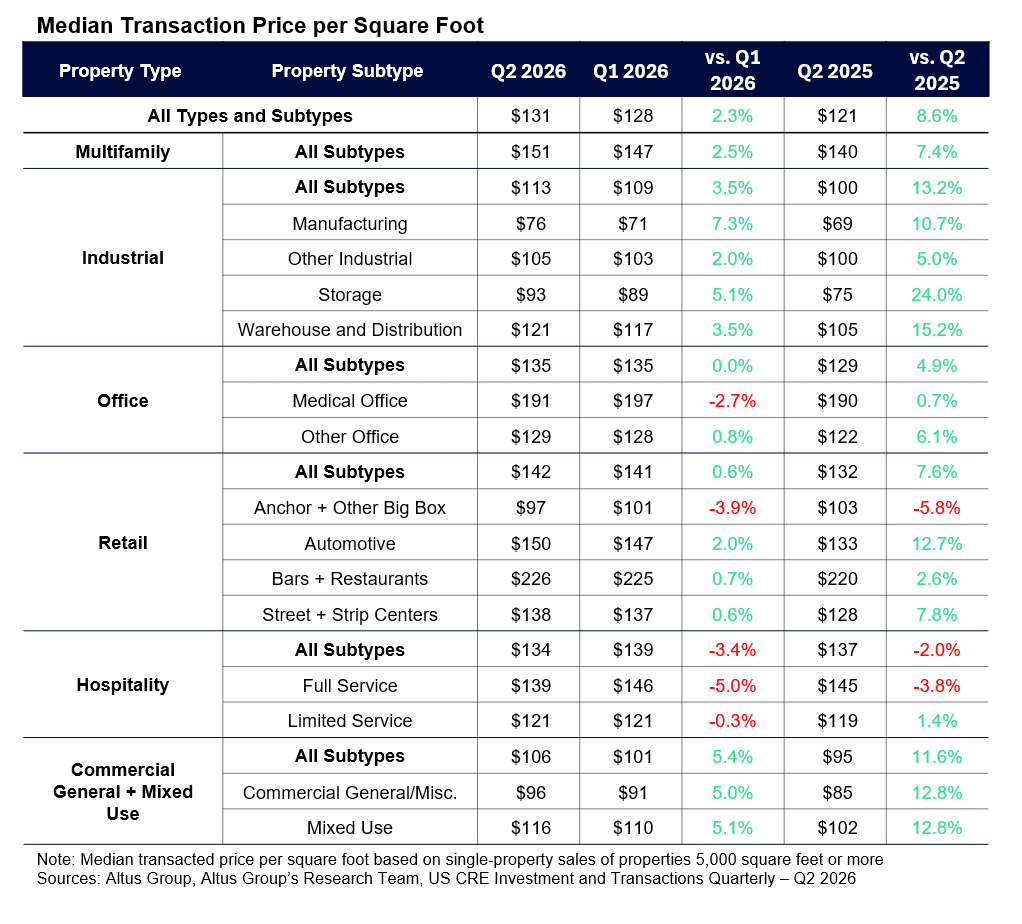
Industrial continues to benefit from strong investor demand and remains one of the strongest sectors across both pricing and volume measures. The combination of rising prices, larger median deal sizes, and higher transaction activity suggests investors remain confident in long-term industrial fundamentals.
Multifamily remains a core allocation target, though transaction volume growth has moderated. Pricing gains persist, but volume trends indicate investors are becoming increasingly selective.
Office continues its gradual rehabilitation. While the sector still faces structural challenges, pricing has stabilized, and transaction volume continues to improve. Activity appears concentrated in higher-quality assets and specialized segments such as Medical Office.
Retail remains surprisingly resilient. Necessity-based retail, restaurants, and automotive-focused properties continue to attract capital, while larger-format retail assets face a more challenging environment.
Hospitality delivered stronger transaction activity but weaker pricing. Investors appear willing to transact, though pricing trends suggest a more cautious assessment of future operating performance.
Looking ahead
As of mid-August 2026, the US CRE investment market appears healthier than it did a year ago, but it is still operating within a highly selective environment. Transaction volumes continue to improve, financing conditions have become somewhat more supportive (albeit still expensive), and pricing shows signs of moderate improvement. Yet the data also show that capital is concentrating in larger transactions, stronger markets, and assets with durable operating fundamentals.
The key question for the remainder of 2026 is not whether capital is available, but where it will continue to flow. Based on the Q2 data, investors appear increasingly comfortable taking risk, provided that risk is paired with scale, quality, and clear fundamentals. If those conditions persist, the recovery that began in 2025 may continue to broaden through the balance of the year.
For the full data behind this analysis, explore the complete Q2 2026 US CRE Investment & Transactions Quarterly report.
Want to be notified of our new and relevant CRE content, articles and events?
Disclaimer
This publication has been prepared for general guidance on matters of interest only and does not constitute professional advice or services of Altus Group, its affiliates and its related entities (collectively “Altus Group”). You should not act upon the information contained in this publication without obtaining specific professional advice.
A number of factors may influence the performance of the commercial real estate market, including regulatory conditions and economic factors such as interest rate fluctuations, inflation, changing investor sentiment, and shifts in tenant demand or occupancy trends. We strongly recommend that you consult with a qualified professional to assess how these and other market dynamics may impact your investment strategy, underwriting assumptions, asset valuations, and overall portfolio performance.
No representation or warranty (express or implied) is given as to the accuracy, completeness or reliability of the information contained in this publication, or the suitability of the information for a particular purpose. To the extent permitted by law, Altus Group does not accept or assume any liability, responsibility or duty of care for any consequences of you or anyone else acting, or refraining to act, in reliance on the information contained in this publication or for any decision based on it. The distribution of this publication to you does not create, extend or revive a client relationship between Altus Group and you or any other person or entity. This publication, or any part thereof, may not be reproduced or distributed in any form for any purpose without the express written consent of Altus Group.
Authors
Omar Eltorai
Senior Director of Research, Altus Group
Cole Perry
Associate Director of Research, Altus Group
Resources
Latest insights