CRE debt markets bounce off the floor in Q3 2026
Treasury yields surged and spread compression slowed, pushing all-in borrowing costs up across property types.
CRE debt markets bounce off the floor in Q3 2026
Treasury yields surged and spread compression slowed, pushing all-in borrowing costs up across property types.

Greater debt transparency for everyday decision making
Gain control over your debt portfolio to manage overall costs, minimise risk and improve decision-making on debt and loan portfolios.
Key takeaways
Total quote volume rose 15% quarter-over-quarter to 2,072 from a smaller but more engaged pool of 101 participants, each reporting 20.5 quotes and approximately 5.2 competitive quotes for new financing
Quote activity rotated back toward floating-rate products, with floating-rate senior short quotes jumping 34% QoQ to 814 while fixed-rate senior short quotes fell 5%
The term Secure Overnight Funding Rate (SOFR) ticked higher, with the benchmark averaging 3.67%, up 5 bps from Q2 2026 as the Fed raised its target range by 25 bps in September
All-in rates jumped across the board, with the average all-in rate rising 29 bps QoQ while holding 27 bps lower YoY across all property types and subtypes
Treasury yields extended their climb through the quarter, with the average yield on the 5-Year UST rising 41 bps QoQ to 4.50% and the 10-Year climbing 33 bps to 4.76%
Construction led the repricing; all-in rates rose 59 bps to 6.67%, driven by a jump in office construction, leaving construction as the only property type priced above year-ago levels
Last quarter we wrote that CRE debt pricing had hit a rate floor. In Q3 2026, it bounced off it. The benchmark side did most of the work; treasury yields extended their climb, with the 5-Year and 10-Year UST each posting their largest quarterly increases in this series. SOFR, which had gone flat in Q2, ticked higher as the Fed raised its target range by 25 bps to 3.75% to 4.00% in September. This time, spreads offered no cushion. After several quarters of steady compression, most senior spreads held flat or widened. The result was the broadest repricing we have recorded since the quarterly survey launched in early 2024. Borrowers did not retreat, though; based on findings from the Altus Group US Debt Capital Markets Survey for Q3 2026, which captured 2,072 quotes from 101 industry professionals, lenders were busier than at any point in the past year.
Quote activity and market composition
Total quotes captured in the Q3 survey were up 15% quarter-over-quarter (QoQ) from Q2 2026's 1,794, and 17% above the 1,770 reported in Q3 2025, making this the highest quote count since Q2 2025. The participant pool shrank again, down to 101 from 105, but those who responded were more active. Each participant reported an average of 20.5 quotes, up from 17.1 in Q2 and the highest since Q3 2024. Borrowers seeking new financing received approximately 5.2 competitive quotes on average, a touch below 5.3 last quarter and slightly above 5.1 a year ago. Rising rates have not thinned the lender bench. Deals are still drawing multiple bids.
Surveyed quotes - count of quotes received by product type
Rate Type | Product | 3Q 2026 | 2Q 2026 | QoQ %Δ | 3Q 2025 | YoY %Δ |
|---|---|---|---|---|---|---|
Fixed | Senior Short¹ | 472 | 498 | -5% | 385 | 23% |
Senior Long² | 321 | 312 | 3% | 235 | 37% | |
Mezzanine² | 143 | 83 | 72% | 140 | 2% | |
Pref. Eq.³ | 55 | 54 | 2% | 111 | -50% | |
Floating | Senior Short⁴ | 814 | 608 | 34% | 695 | 17% |
Mezzanine⁴ | 155 | 132 | 17% | 123 | 26% | |
Repo/Facility⁴ | 112 | 107 | 5% | 81 | 38% | |
Total (All Products) | 2,072 | 1,794 | 15% | 1,770 | 17% |
Benchmarks: 1) 5-Year US Treasury yield; 2) 10-Year US Treasury yield; 3) All-in Coupon Rate %; 4) Term SOFR
Product mix - as % of total quotes received
Rate Type | Product | 3Q 2026 | 2Q 2026 | QoQ %Δ | 3Q 2025 | YoY %Δ |
|---|---|---|---|---|---|---|
Fixed | Senior Short¹ | 23% | 28% | -5% | 22% | 1% |
Senior Long² | 15% | 17% | -2% | 13% | 2% | |
Mezzanine² | 7% | 5% | 2% | 8% | -1% | |
Pref. Eq.³ | 3% | 3% | 0% | 6% | -4% | |
Floating | Senior Short⁴ | 39% | 34% | 5% | 39% | 0% |
Mezzanine⁴ | 7% | 7% | 0% | 7% | 1% | |
Repo/Facility⁴ | 5% | 6% | -1% | 5% | 1% | |
Total (All Products) | 100% | 100% | 100% |
Benchmarks: 1) 5-Year US Treasury yield; 2) 10-Year US Treasury yield; 3) All-in Coupon Rate %; 4) Term SOFR
Last quarter's rotation into fixed-rate products reversed. Floating-rate senior short quotes accounted for 39% of all quotes received, a 5 percentage point (pp) increase from Q2, while fixed-rate senior short slipped 5 pp to 23%. Floating products as a group took back a majority of quote volume at 52%, up from 47% in Q2. The logic is simple: the 5-Year jumped 41 bps while SOFR rose just 5 bps. On a quote-weighted basis, the all-in rate on lower-LTV fixed senior short debt ran about 49 bps above its floating counterpart in Q3, roughly double the 25 bps gap in Q2. When locking in costs that much more, more borrowers chose to float and buy protection. Fixed mezzanine was the other standout, with quotes up 72% to 143, lifting its share by 2 pp to 7%. Fixed-rate senior long-term financing accounted for 15% of total quote volume, floating mezzanine 7%, and repo/warehouse facilities 5%.
Collateral sector mix: as % of total quotes received
Rate Type | Product | 3Q 2026 | 2Q 2026 | QoQ %Δ | 3Q 2025 | YoY %Δ |
|---|---|---|---|---|---|---|
Fixed | Senior Short¹ | 23% | 28% | -5% | 22% | 1% |
Senior Long² | 15% | 17% | -2% | 13% | 2% | |
Mezzanine² | 7% | 5% | 2% | 8% | -1% | |
Pref. Eq.³ | 3% | 3% | 0% | 6% | -4% | |
Floating | Senior Short⁴ | 39% | 34% | 5% | 39% | 0% |
Mezzanine⁴ | 7% | 7% | 0% | 7% | 1% | |
Repo/Facility⁴ | 5% | 6% | -1% | 5% | 1% | |
Total (All Products) | 100% | 100% | 100% |
Construction was the story on the collateral side. Its share of quotes jumped 3 pp to 13%, the largest gain of any sector on both a QoQ and year-over-year basis. Residential held the top spot at 23%, essentially unchanged, and industrial edged up 1 pp to 16%. Office gave back the ground it gained last quarter, falling 3 pp to 16%, though it remains 2 pp above a year ago. Retail slipped 2 pp to 19%, but is still up 4 pp YoY. Hotel and specialty each held near 7%. One quarter is not a trend, but jump in development quotes during a rising-rate quarter suggests sponsors with shovel-ready projects are moving now rather than waiting for a cheaper window that may not come.
Benchmark rates: the whole curve moves higher
Every benchmark moved higher in Q3, which has not happened in any quarter since this survey began in Q2 2024. The yield on the 5-Year UST averaged 4.50% over the quarter, up 41 bps from 4.09% in Q2 and 70 bps higher than a year ago. The 10-Year treasury averaged 4.76%, up 33 bps QoQ and 49 bps YoY. Those averages understate how far yields climbed by quarter-end. The 10-Year touched 5.23% in late September, its highest level since 2007 and 47 bps above its Q3 average. The 5-Year broke above 5% for the first time since 2007 on September 23, and closed the quarter at 5.09% on September 30, 59 bps above its quarterly average. SOFR averaged 3.67%, up 5 bps from 3.62%. While small, it is the largest quarterly increase in SOFR in our survey’s data, and the Q3 average captures only two weeks of the post-hike policy rate. On a YoY basis, SOFR is still 66 bps lower, which is the one remaining source of benchmark relief for floating-rate borrowers.
Figure 1: Benchmark yields (quarterly average, bps)
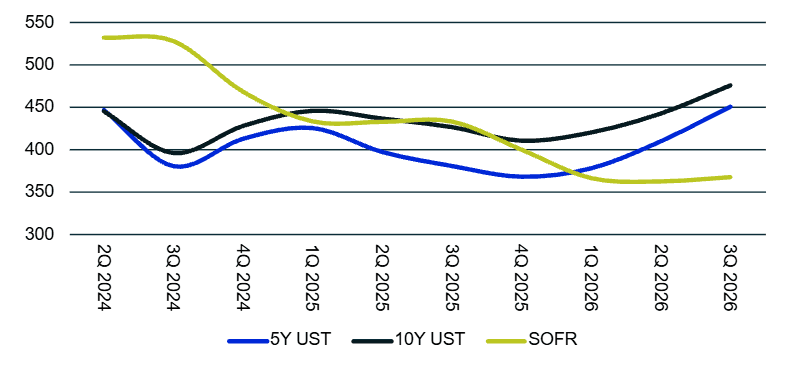
Last quarter, the story was divergence. A flat SOFR and rising Treasuries favored floating over fixed. This quarter both legs moved against borrowers, and the long end moved more. The 5-Year rose eight times as much as SOFR, which explains the swing back to floating in the product mix.
Benchmark | 3Q 2026 (%) | 2Q 2026 (%) | QoQ Δ (bps) | 3Q 2025 (%) | YoY Δ (bps) |
|---|---|---|---|---|---|
5-Year UST | 4.50 | 4.09 | +41 | 3.80 | +70 |
10-Year UST | 4.76 | 4.42 | +33 | 4.26 | +49 |
Term SOFR | 3.67 | 3.62 | +5 | 4.33 | -66 |
Spreads: Compression stalls
The spread compression that cushioned borrowers through the first half of 2026 largely stalled in Q3. Lenders did not absorb the Treasury move with tighter pricing. In several products, they widened on top of them. The biggest moves came in fixed-rate senior long-term debt. Higher-LTV fixed senior long spreads widened 37 bps to 286 bps over the 10-Year, up 15% QoQ and now 16% wider than a year ago. Lower-LTV fixed senior long widened 15 bps to 210 bps, and fixed mezzanine widened 60 bps to 818 bps. On the floating side, lower-LTV senior short spreads widened 14 bps to 253 bps over SOFR, and higher-LTV senior short widened 11 bps to 343 bps.
Average spread by product type
Rate Type | Product | Leverage (LTV) | 3Q 2026 | 2Q 2026 | QoQ %Δ | 3Q 2025 | YoY %Δ |
|---|---|---|---|---|---|---|---|
Fixed | Senior Short¹ | Lower (≤65%) | 219 | 216 | 1% | 240 | -9% |
Higher (>65%) | 302 | 313 | -4% | 347 | -13% | ||
Senior Long² | Lower (≤65%) | 210 | 195 | 8% | 198 | 6% | |
Higher (>65%) | 286 | 249 | 15% | 246 | 16% | ||
Mezzanine² | 70-90% | 818 | 759 | 8% | 848 | -3% | |
Pref. Eq.³ | ≥70% | 13.29 | 13.57 | -2% | 13.75 | -3% | |
Floating | Senior Short⁴ | Lower (≤65%) | 253 | 239 | 6% | 286 | -11% |
Higher (>65%) | 343 | 332 | 3% | 380 | -10% | ||
Mezzanine⁴ | 70-90% | 716 | 721 | -1% | 852 | -16% | |
Repo/Facility⁴ | Adv Rate (50-80%) | 162 | 176 | -8% | 170 | -5% |
Benchmarks: 1) 5-Year US Treasury yield; 2) 10-Year US Treasury yield; 3) All-in Coupon Rate %; 4) Term SOFR
There were pockets of tightening. Repo/facility spreads fell 14 bps to 162 bps, extending a multi-quarter run of compression on warehouse lines. Higher-LTV fixed senior short tightened 11 bps to 302 bps, and preferred equity coupons eased to 13.29% from 13.57%. YoY, most products are still tighter, with floating mezzanine 16% below year-ago levels. The exception is fixed senior long, where both LTV buckets now price wider than in Q3 2025. Part of the widening reflects mix, since construction quotes carry wider spreads and made up a larger share of the survey this quarter.
Senior-short spreads: Average spreads by select collateral type
Property Type | 3Q 2026 | 2Q 2026 | QoQ %Δ | 3Q 2025 | YoY %Δ |
|---|---|---|---|---|---|
Residential | 231 | 218 | 6% | 248 | -7% |
Industrial | 228 | 231 | -2% | 254 | -10% |
Office | 321 | 318 | 1% | 381 | -16% |
Retail | 267 | 268 | -1% | 322 | -17% |
Hotel | 327 | 337 | -3% | 335 | -2% |
Specialty | 331 | 341 | -3% | 437 | -24% |
Construction | 371 | 324 | 14% | 417 | -11% |
Note: Average spreads for senior, short-term fixed and floating rate debt; not all property types shown
By collateral, senior-short spreads tightened modestly for industrial, retail, hotel, and specialty, and held roughly flat for office at 321 bps. Construction widened the most, up 46 bps to 371 bps. Residential widened 14 bps to 231 bps and now prices slightly wider than industrial at 228 bps. Every property type remains tighter than a year ago, led by specialty at 24% and retail at 17%.
All-in rates: The easy gains are behind us
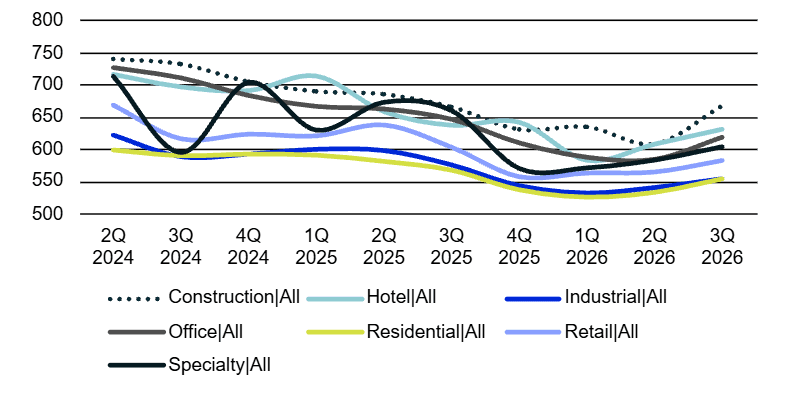
In Q2, the average all-in rate barely moved, down just 4 bps. In Q3, it jumped. Across all property types and subtypes, the average all-in rate rose 29 bps QoQ. That is the first quarterly increase since Q4 2024 and by far the largest in this series. It was also universal; all 29 property types and subtypes with quotes in both quarters moved higher. The YoY comparison still favors borrowers, with the average all-in rate down 27 bps from Q3 2025, but that cushion has shrunk from 71 bps just one quarter ago.
Construction was again the biggest mover, this time in the opposite direction. Construction all-in rates rose 59 bps QoQ to 6.67%, erasing almost all of the YoY improvement. It is now the only property type priced higher than a year ago, up 2 bps. Office construction drove the move, climbing 118 bps to 7.38% and retracing about two-thirds of last quarter's 178 bps drop. That series rests on a thin quote count and has been volatile, but the direction is consistent with lenders demanding more to fund new office supply. Retail construction rose 80 bps to 6.79%. Apartment and industrial construction were more measured, up 22 bps to 6.36% and 16 bps to 6.15%, respectively. Industrial construction remained 59 bps below a year ago.
Office posted the second-largest increase among property types, up 34 bps to 6.18%, and is now 28 bps lower YoY. Commodity product led the move. Commodity suburban rose 46 bps to 6.49%, life science rose 43 bps to 6.32%, and commodity urban rose 40 bps to 6.42%. Trophy office rose a modest 28 bps to 5.95% and still shows the sector's steepest YoY decline at 51 bps. Medical office was the most stable, up just 15 bps to 5.73%, and remains the lowest-cost office subtype. Last quarter, we noted the gap between trophy and commodity pricing was narrowing. That reversed in Q3, as the difference between commodity suburban and trophy all-in rates widened to 54 bps from 36 bps. When rates rise, capital gets choosier, and office is where that shows up first.
Hotel all-in rates rose 23 bps to 6.31%, following last quarter's 25 bps increase. Full service rose 25 bps to 6.25%, and limited service rose 21 bps to 6.36%. Two consecutive quarters of increases left hotel just 6 bps below a year ago, the smallest YoY improvement of any property type outside construction.
Residential and industrial remained the lowest-cost conventional asset classes, tied at 5.54%. Residential rose 21 bps QoQ and was down 13 bps YoY. Student housing led the sector higher with a 29 bps increase to 5.63%, while apartment rose 22 bps to 5.45%, and single family rose 11 bps to 5.53%. Industrial posted the smallest increase of any property type, up 14 bps, and was down 21 bps YoY. Warehouse/distribution rose just 9 bps to 5.44%, edging past apartment by a single basis point to become the cheapest financing in the survey. Flex rose 18 bps to 5.64%.
Retail rose 18 bps to 5.82% and is down 21 bps YoY. Street retail led with a 27 bps increase to 5.92%, followed by mall, up 21 bps to 6.07%. Grocery-anchored and strip each rose 12 bps, to 5.52% and 5.78%. Grocery-anchored remained the standout on a YoY basis, down 44 bps. Specialty rose 21 bps to 6.03% but still posts the largest YoY decline of any property type at 56 bps. Senior housing rose 28 bps to 5.94% and is now 3 bps above a year ago. Self storage rose 20 bps to 5.68%. Data center quotes returned to the survey after an absence in Q2, pricing at 5.81%, 43 bps below a year ago, though on a small sample.
Figure 2: All-in rates (assumes 65% senior, 15% mezzanine; bps)
Looking ahead
What has happened since the end of Q3 suggests the pressure has not let up. The 10-Year and the 5-Year UST remain roughly 40 bps above their Q3 averages, after the 10-Year touched 5.31% on October 5, closing above 5.00% for nearly two thirds of the trading days in Q4 (as of mid-November). If those levels hold, fixed-rate all-in costs have another leg up to go in Q4 before spreads do anything at all.
It is difficult to pin the rise in yields on a single driver. There are a handful of likely causes: geopolitical concerns and oil markets, inflation, and fiscal concerns. No matter the cause or combination of causes, we continue to live through the higher-for-longer environment.
From here, the path for CRE debt depends on where the 10-Year settles. If yields drift back into the high 4% to low 5% range, the market can likely absorb what has already happened. Lenders will stay selective, favoring well-leased assets and stronger sponsors, and some spread widening is still working its way through, as Q3's fixed senior long pricing showed. That adjustment should be moderate rather than disruptive.
The harder scenario is another leg up. If the 10-Year pushes toward 5.25% and beyond, lenders are unlikely to keep absorbing benchmark moves in their spread pricing. They have little room left, and Q3 suggests they have little appetite, too. At that point, higher borrowing costs stop being a debt market problem and become a CRE market problem. Expect more transactions to be delayed or pulled, more development starts to be shelved, and the repricing to flow meaningfully through valuations and asset pricing.
Want to be notified of our new and relevant CRE content, articles and events?
Disclaimer
This publication has been prepared for general guidance on matters of interest only and does not constitute professional advice or services of Altus Group, its affiliates and its related entities (collectively “Altus Group”). You should not act upon the information contained in this publication without obtaining specific professional advice.
A number of factors may influence the performance of the commercial real estate market, including regulatory conditions and economic factors such as interest rate fluctuations, inflation, changing investor sentiment, and shifts in tenant demand or occupancy trends. We strongly recommend that you consult with a qualified professional to assess how these and other market dynamics may impact your investment strategy, underwriting assumptions, asset valuations, and overall portfolio performance.
No representation or warranty (express or implied) is given as to the accuracy, completeness or reliability of the information contained in this publication, or the suitability of the information for a particular purpose. To the extent permitted by law, Altus Group does not accept or assume any liability, responsibility or duty of care for any consequences of you or anyone else acting, or refraining to act, in reliance on the information contained in this publication or for any decision based on it. The distribution of this publication to you does not create, extend or revive a client relationship between Altus Group and you or any other person or entity. This publication, or any part thereof, may not be reproduced or distributed in any form for any purpose without the express written consent of Altus Group.
Authors

Omar Eltorai
Senior Director of Research, Altus Group

Andrew Pabon
Director Global Advisory, Altus Group
Authors
Omar Eltorai
Senior Director of Research, Altus Group
Andrew Pabon
Director Global Advisory, Altus Group
Greater debt transparency for everyday decision making
Gain control over your debt portfolio to manage overall costs, minimise risk and improve decision-making on debt and loan portfolios.
Resources
Latest insights