Following the trucks: why U-Haul migration predicts self-storage supply
Why do the markets leading U-Haul's migration index have the weakest storage rent growth? Because migration signals new supply, not demand.
Following the trucks: why U-Haul migration predicts self-storage supply
Why do the markets leading U-Haul's migration index have the weakest storage rent growth? Because migration signals new supply, not demand.
Author

Adam Mauro, CFA
Director, Valuation Advisory, Altus Group
Key highlights:
In-migration reliably tells you where storage demand is going, however this is a contrarian signal, not a buy signal
The same signal that draws tenants draws developers, and developers overbuild
For owners, it’s an early warning to defend rate
For buyers, it is a clock: wait for the supply wave to deliver, rates to bottom, and absorption to turn, then buy
Where the oldest rule of thumb in self-storage breaks down
"Follow the U-Haul trucks” is the oldest rule of thumb in migration-driven real estate. People are pouring into Texas, Florida and the Carolinas, and storage demand follows households. Therefore, those are the markets to own - right?
Sounds logical, and the first two points are correct. But Altus Valuation Data tells a different story. While it looks like a demand signal on the surface, it's actually a supply signal.
Storage demand is migrating exactly where U-Haul says it is, but storage is easier and faster to build than traditional real estate. The demand signal that draws tenants also draws developers, and because supply overshoots demand, the markets absorbing the most migration end up with the weakest rental rate growth for years. Meanwhile, over the last 18 months, the markets people are leaving have delivered the best storage returns since late 2024.
Migration draws development
Texas and Florida together added more than 800,000 residents in 2025; both states also lead the country in residential building permits. This relationship is consistent across markets: the states absorbing the most in-migration are the states building the most. The Sun Belt is now working through the oversupply correction that follows.
Figure 1: Development concentrates in the migration-winner states
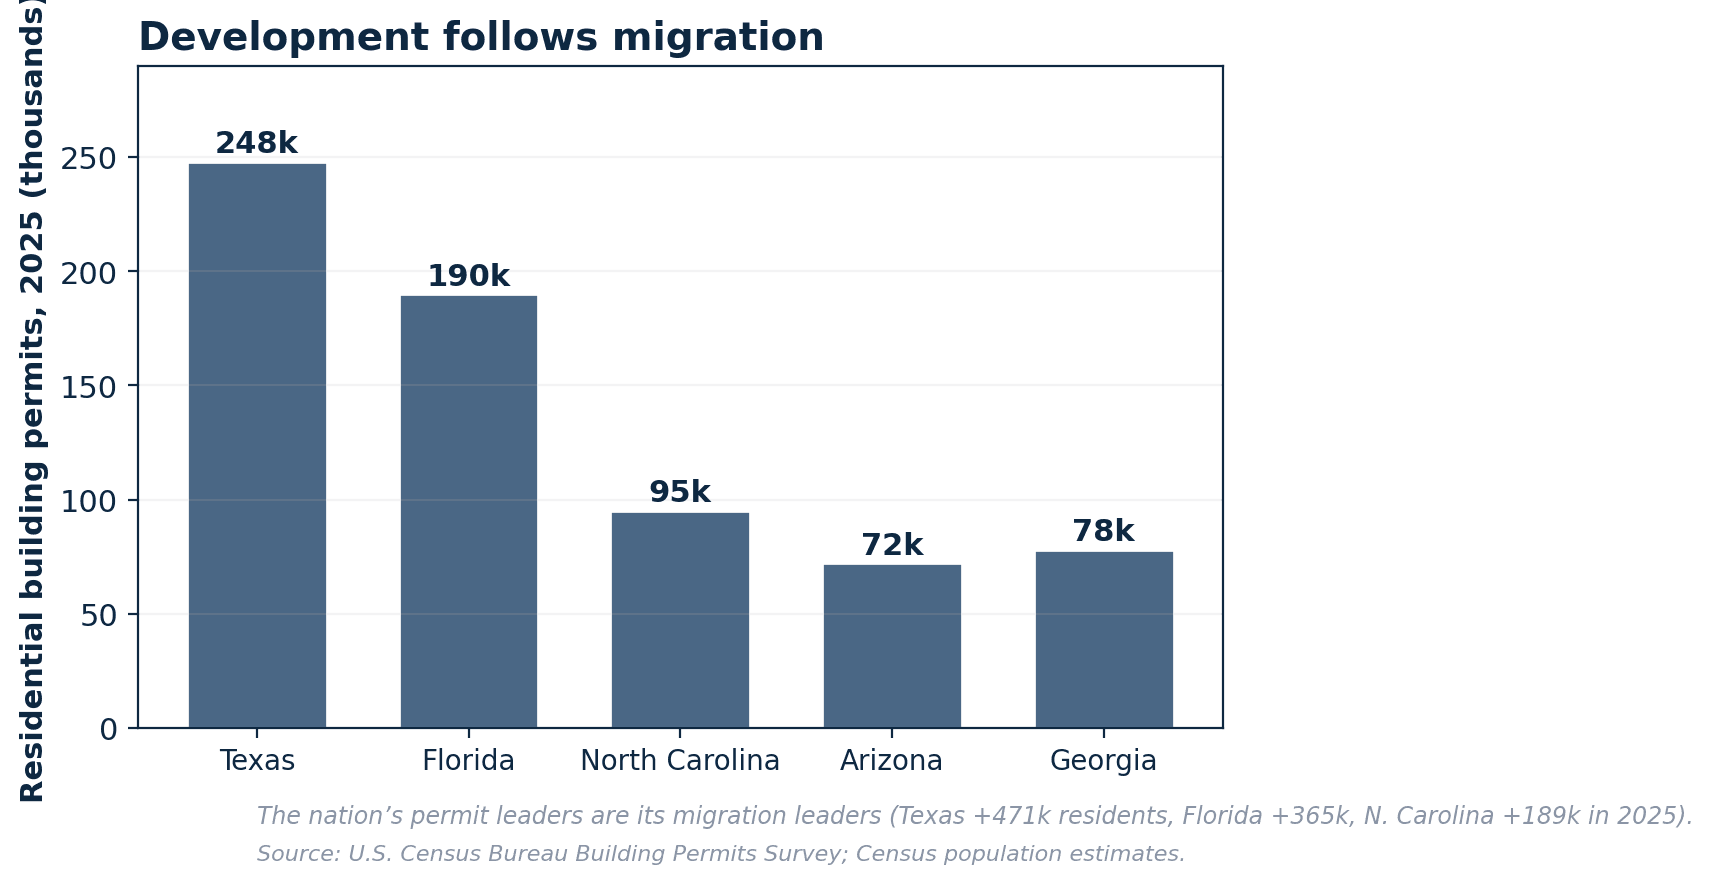
Source: U.S. Census Bureau Building Permits Survey
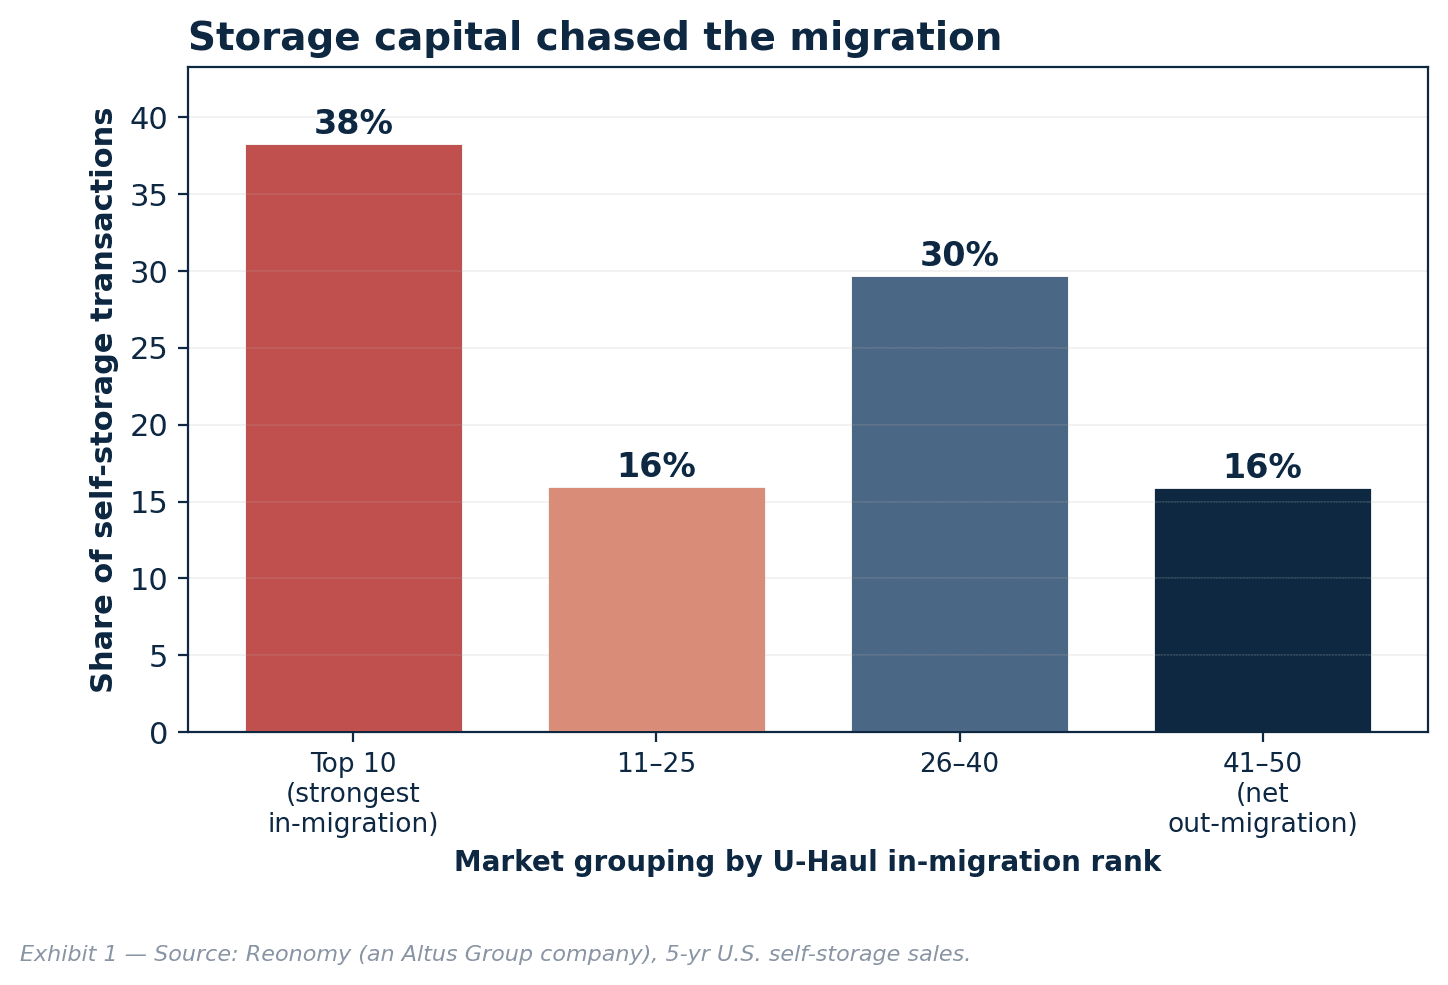
Capital followed the same map. Altus data shows the strongest in-migration states drew roughly 38% of U.S. self-storage acquisition activity over the past five years, concentrating investment in the markets that were about to overbuild. The builders and the buyers chased the demand story into the same place.
Figure 2: Share of self-storage transactions by market grouping
Development is what moves rents
To test this, we ranked major metros by how their storage rents have increased over the last two years, and the migration winners sit at the bottom. The high in-migration Sun Belt markets - Phoenix, Houston, Dallas, and Atlanta - posted the weakest realized rent growth, while the slower-growth coastal and Midwest metros posted the stronger fundamentals.
Figure 3: Realized market-rent change by metro
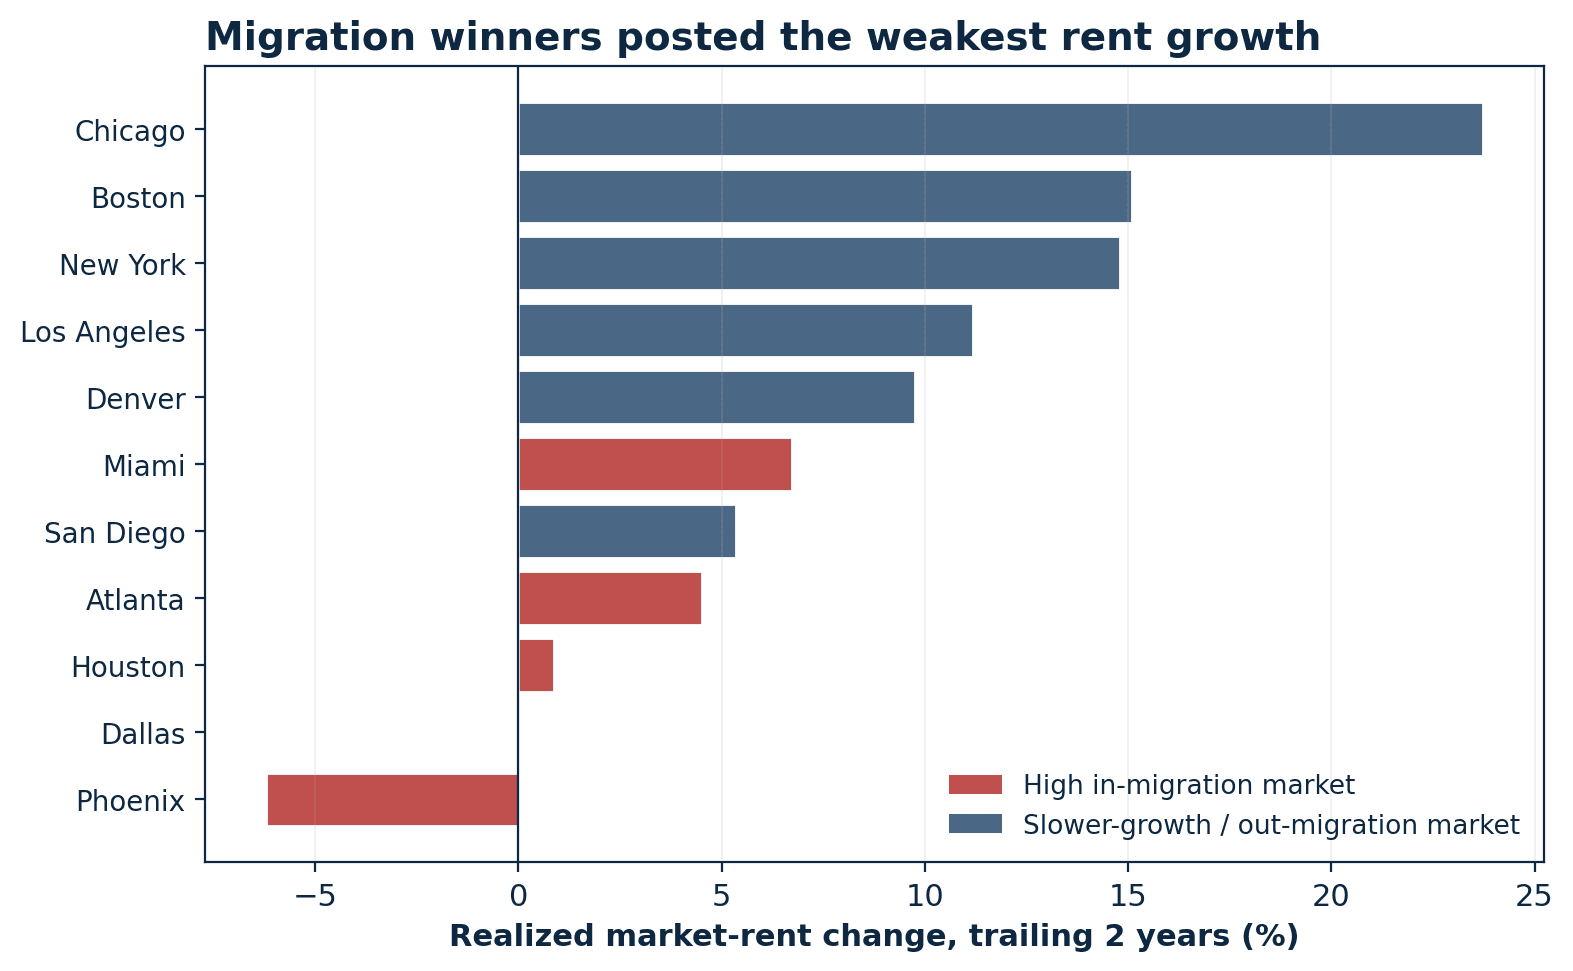
Source: ODCE index self-storage, Altus Valuation Data
An important nuance is that this trend shows up only in realized rents. Appraisers’ forward rent-growth assumptions sit in a tight band across every metro regardless of migration, understating a divergence the market has already delivered. The mechanism is clearest when you trace a single market through the full cycle.
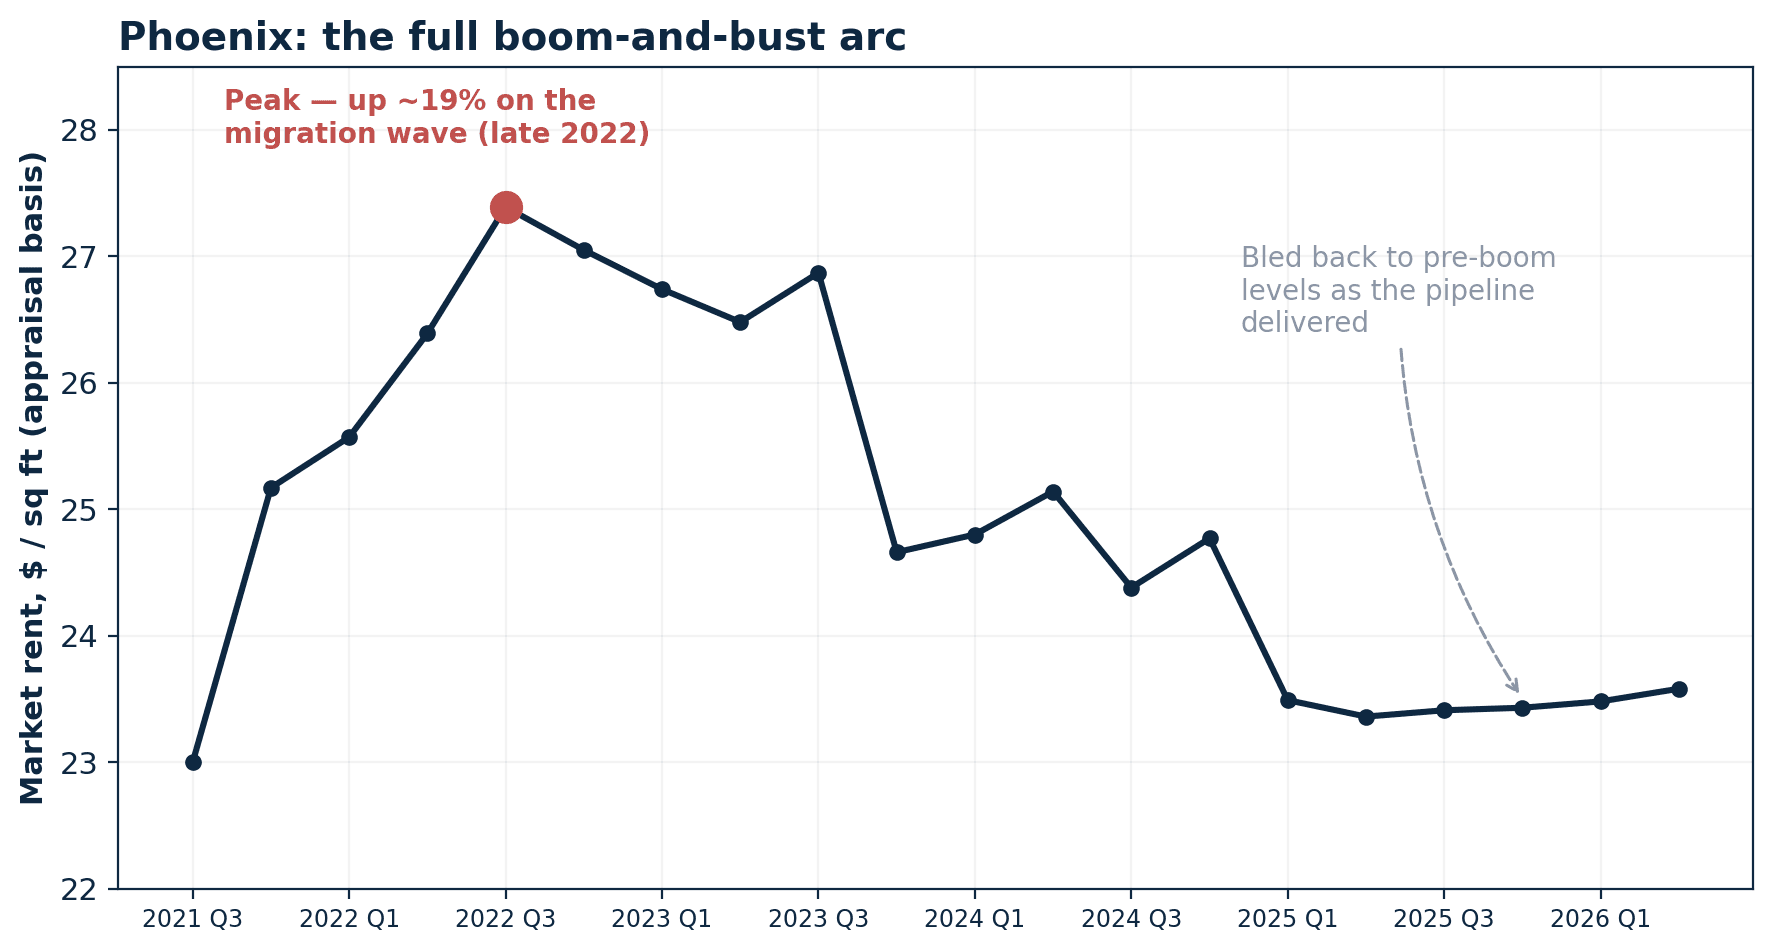
Figure 4: Phoenix, the full boom-and-bust arc
Source: ODCE index self-storage, Altus Valuation Data
Phoenix is the textbook case. Market rents increased by roughly 19% from Q3 2021 to Q3 2022 during the migration wave, then returned to pre-boom levels as its pipeline delivered
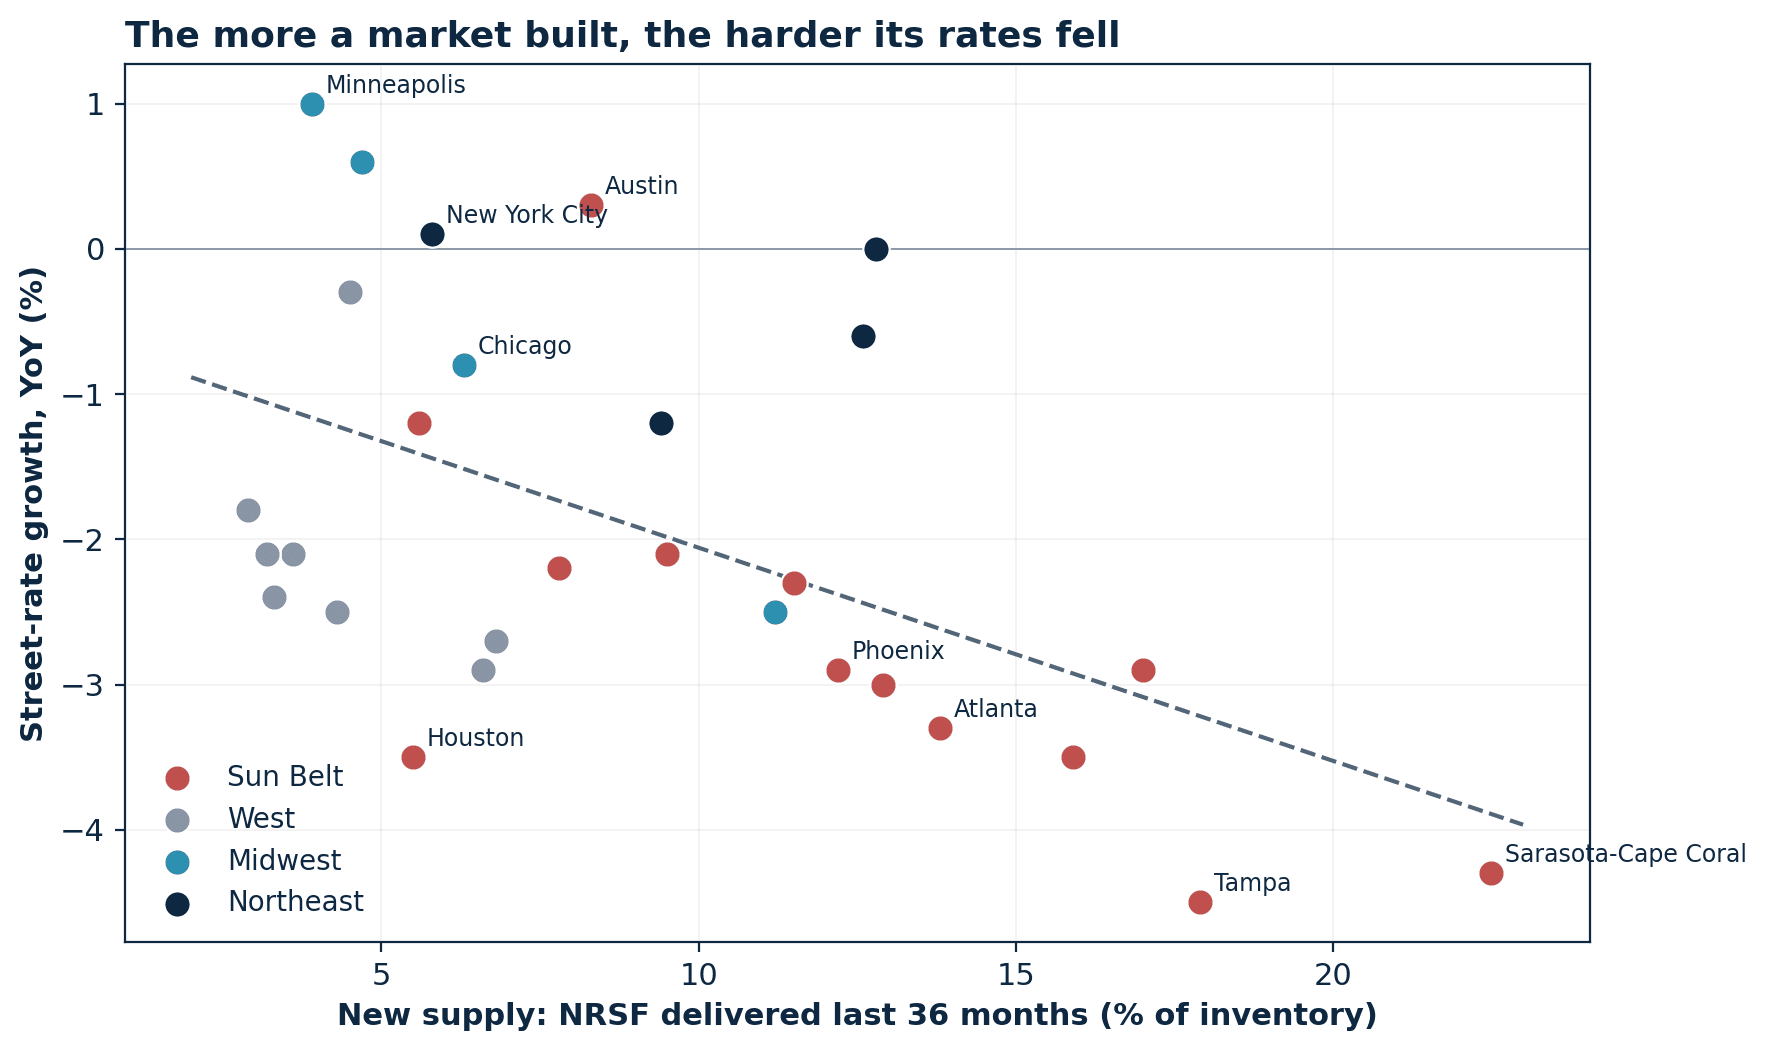
Figure 5: Corroboration across a broader advertised-rate set
Source: Yardi Matrix
The cycle, and its clock
Because the effect runs through construction, it moves at construction’s pace. The demand increase and the initial rate jump arrive within roughly a year of the migration surge. Storage typically takes 18–36 months to build, so the supply response lands in the second and third years after construction completion. That is when rates bottom. The market only becomes attractive once that supply is absorbed, and rate declines flatten, typically three to four years after the migration peak.
Figure 6: Stylized rate path from migration peak through oversupply to absorption. Altus Group analysis
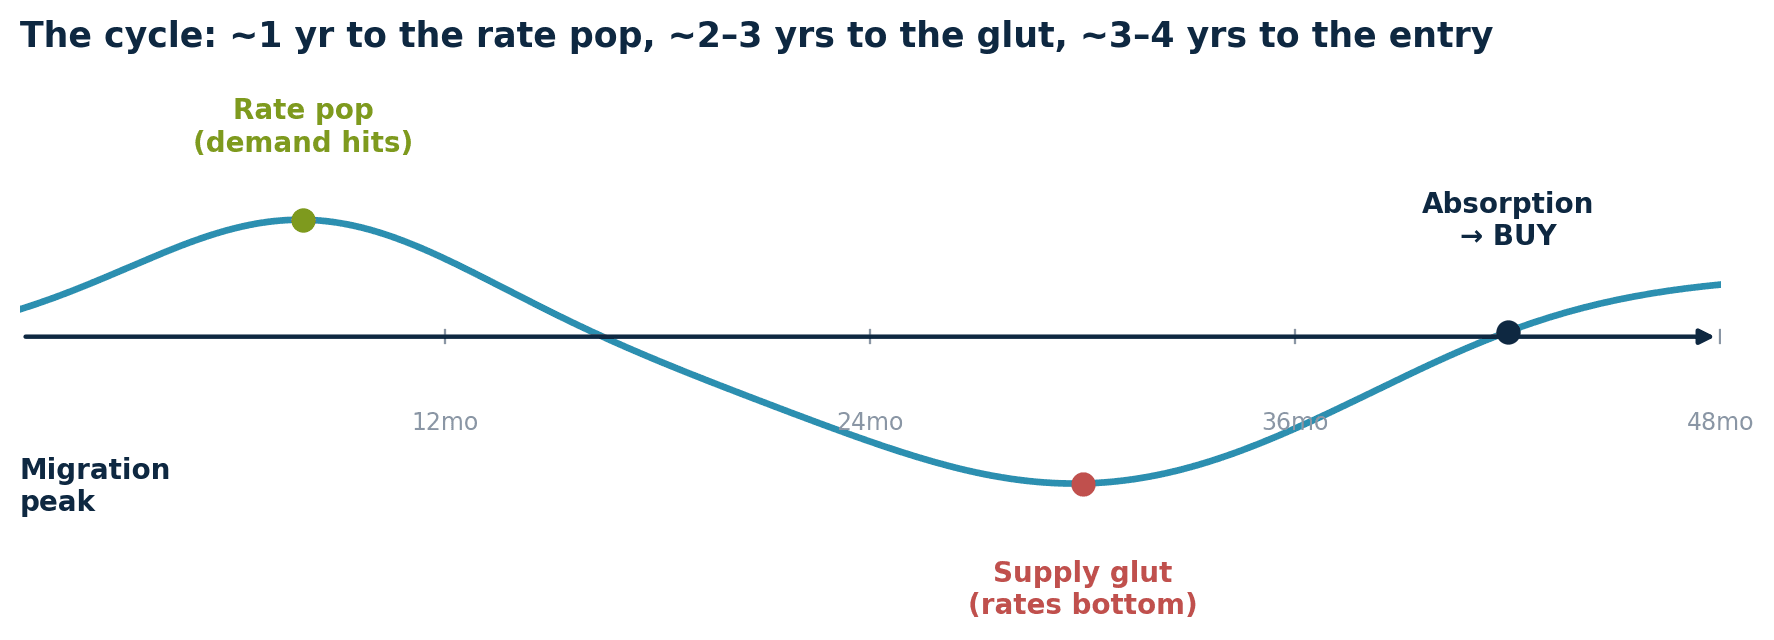
Austin ran the same course as Phoenix and is now emerging from it, with rate growth clawing from −4.4% back toward breakeven as its pipeline empties.
What this means for owners and buyers
The same migration signal has different implications depending on your position.
For owners in high-migration markets, the in-migration that supports today’s occupancy is also the signal developers are responding to. New supply is coming, and when it delivers, street rates will lead occupancy lower. The window to push rate is now, while pricing power is still intact. Lock existing tenants ahead of deliveries, and if you are underwriting new acquisitions in these markets, price the incoming supply explicitly into your assumptions.
For buyers, strong current migration is a reason to wait, not a reason to move. Buying at the migration peak means buying at the top of the development cycle. Street rates fall through lease-up as new supply delivers, then partially recover as the market absorbs it.
When does the market turn?
Two conditions need to align. First, the under-construction pipeline should be shrinking, which indicates the supply wave has already peaked. Second, the year-over-year rate decline should have stopped accelerating and begun to flatten, meaning absorption is catching up. When both are present, the market is near its bottom.
In today's data, Austin is the clearest example. Its pipeline is easing and rate growth is back toward breakeven. Phoenix is further behind, still carrying the nation’s heaviest pipeline at roughly 6.9% of stock, with rates still negative. Sarasota, Tampa and Orlando remain mid-correction. The low-supply Midwest and Northeast markets are stable but were never part of the migration cycle this analysis describes.
Looking ahead
The 2025 U-Haul index puts Texas first, then Florida, North Carolina, Tennessee, and South Carolina. Dallas, Houston and Austin lead the metros.
None of these are buy signals today. They are a watch list: markets where demand remains durable and where an entry point will emerge once construction pipelines finish clearing.
There are early signs that process is underway. The 2026 national new-supply forecast is down roughly 19% year-over-year. The migration-winner markets that led the oversupply cycle are moving toward the other side of it. For buyers tracking the clock this piece describes, that contraction is the first thing to watch.

Access data-powered valuation advisory services
Leverage our market expertise, leading ARGUS technologies, and unique valuation datasets you need to drive asset performance and manage risk.
Want to be notified of our new and relevant CRE content, articles and events?
Disclaimer
This publication has been prepared for general guidance on matters of interest only and does not constitute professional advice or services of Altus Group, its affiliates and its related entities (collectively “Altus Group”). You should not act upon the information contained in this publication without obtaining specific professional advice.
A number of factors may influence the performance of the commercial real estate market, including regulatory conditions and economic factors such as interest rate fluctuations, inflation, changing investor sentiment, and shifts in tenant demand or occupancy trends. We strongly recommend that you consult with a qualified professional to assess how these and other market dynamics may impact your investment strategy, underwriting assumptions, asset valuations, and overall portfolio performance.
No representation or warranty (express or implied) is given as to the accuracy, completeness or reliability of the information contained in this publication, or the suitability of the information for a particular purpose. To the extent permitted by law, Altus Group does not accept or assume any liability, responsibility or duty of care for any consequences of you or anyone else acting, or refraining to act, in reliance on the information contained in this publication or for any decision based on it. The distribution of this publication to you does not create, extend or revive a client relationship between Altus Group and you or any other person or entity. This publication, or any part thereof, may not be reproduced or distributed in any form for any purpose without the express written consent of Altus Group.
Author
Adam Mauro, CFA
Director, Valuation Advisory, Altus Group
Resources
Latest insights