San Francisco’s AI-led multifamily recovery: Why one size does not fit all
A closer look at San Francisco’s multifamily rebound shows why a single CBSA-wide rent or capitalization-rate assumption can mislead more than it informs.
San Francisco’s AI-led multifamily recovery: Why one size does not fit all
A closer look at San Francisco’s multifamily rebound shows why a single CBSA-wide rent or capitalization-rate assumption can mislead more than it informs.
Author

Chisem Phillips
Director, Market Expert, Valuation Advisory
Key highlights:
San Francisco and Oakland posted the strongest year-over-year multi-family market rent growth of any major US CBSA for the year ending Q2 2026, at 8.6% and 6.0% respectively, but that strength is concentrated in a handful of submarkets, not spread evenly across the metros
The rebound appears to be tied to a narrow slice of AI-driven technology hiring rather than a broad-based rehiring wave, concentrated in software publishing and computing infrastructure roles near Anthropic’s and OpenAI’s San Francisco offices
New housing supply in the strongest-performing submarkets has slowed sharply from its 2016-2021 pace, so even modest incremental AI-related demand is translating quickly into outsized rent and value gains
San Francisco multifamily is posting some of the strongest rent growth among major US markets, but the metro-level numbers hide interesting submarket nuance. Comparing assets on a same-store basis from Q3 2025 to Q2 2026, San Francisco and neighboring Oakland recorded year-over-year market rent growth of 8.6% and 6.0%, respectively, per Altus benchmark data. Most of that strength is concentrated in a limited number of submarkets where technology hiring, proximity to growing AI employers, and limited new supply overlap. For investors and appraisers, this creates an opportunity to leverage a granular understanding of the market for more precise valuations.
A volatile recovery
The Bay Area is coming off an unusually volatile post-pandemic period. Remote work and outmigration weakened office and multifamily demand, and Altus benchmark data show market rents fell sharply in 2020 and 2021. Rents recovered in 2022 and continued growing into 2023, before cooling again in 2024. Employment, submarket location, and new supply help explain why the latest recovery has been so uneven.
Figure 1: Bay Area Multifamily Same Store Rent Growth (Annual change in rent, NRA weighted, matched properties year over year | 2016 to 2026*)
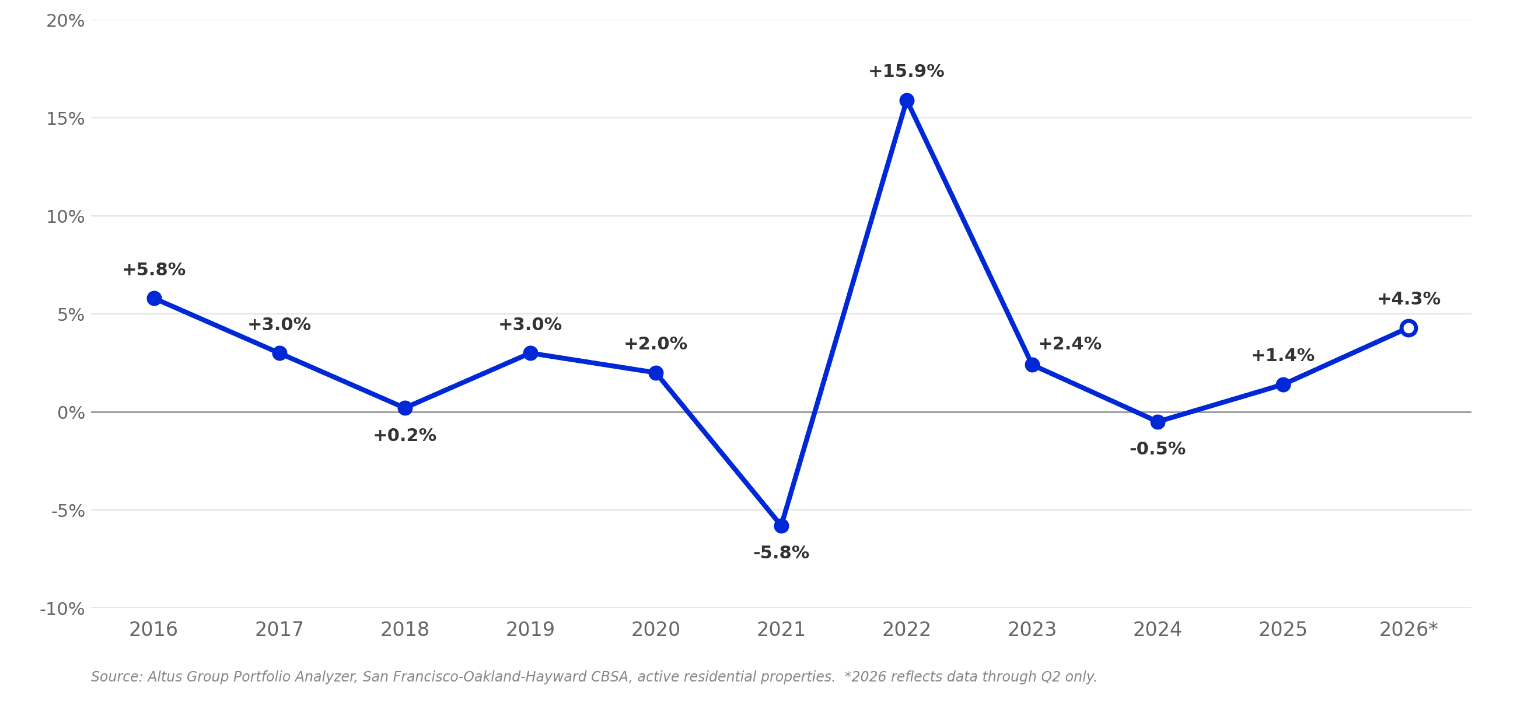
Source: Altus Portfolio Analyzer, San Francisco-Oakland-Hayward CBSA, same-store active residential properties.
Technology employment turns positive
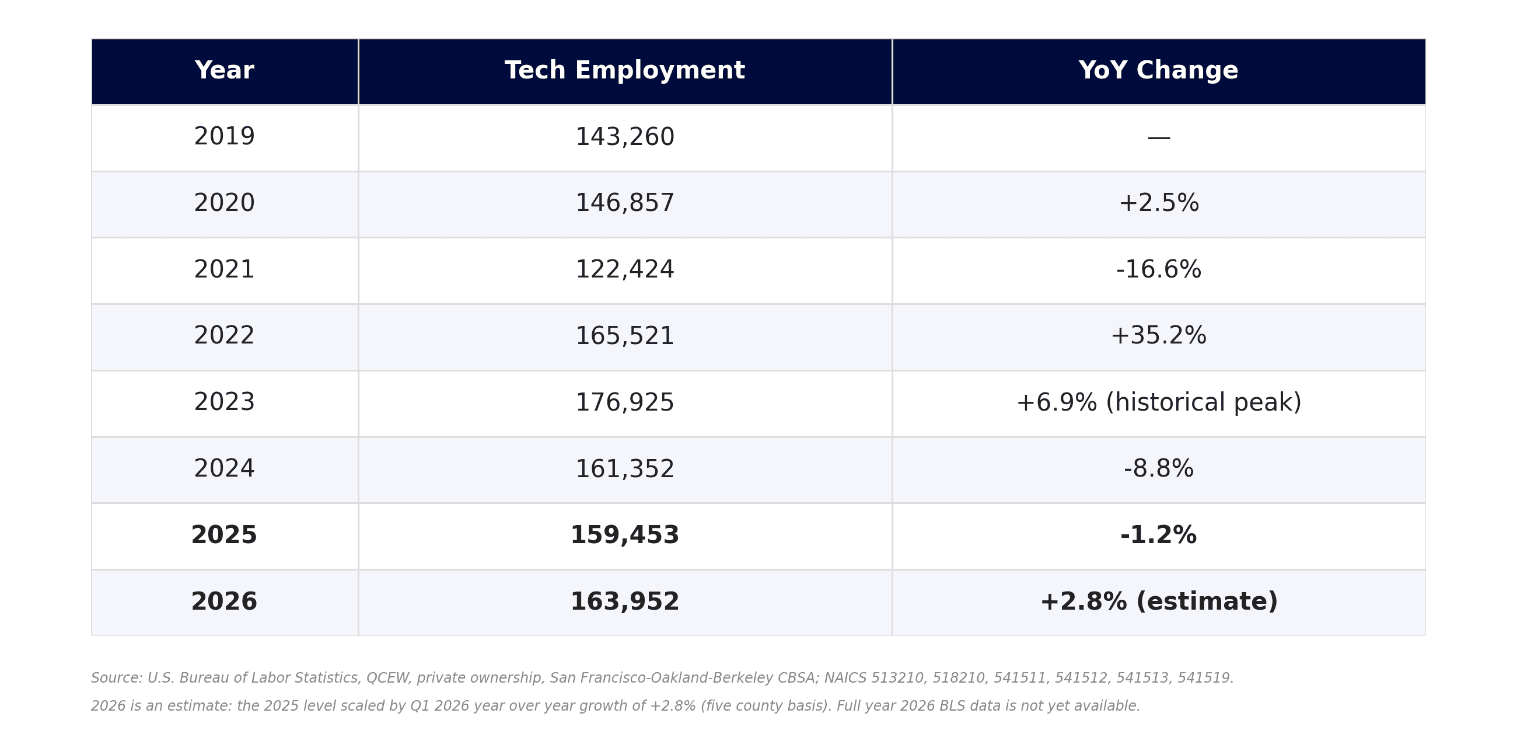
Technology employment peaked in 2023, even as large tech firms launched cost-cutting drives branded the "Year of Efficiency" and laid off workers across the industry. The annual US Bureau of Labor Statistics (BLS) Quarterly Census of Employment and Wages (QCEW) data, shown in the chart below, demonstrates the contraction most clearly in 2024, when employment declined 8.8%, followed by another 1.2% decrease in 2025. The recent rebound coincides with stronger rent growth and improving multifamily fundamentals across the CBSA.
Figure 2: San Francisco Bay Area Tech Employment, 2019 to 2026 (Annual average employees across six core technology industries, with year over year change)
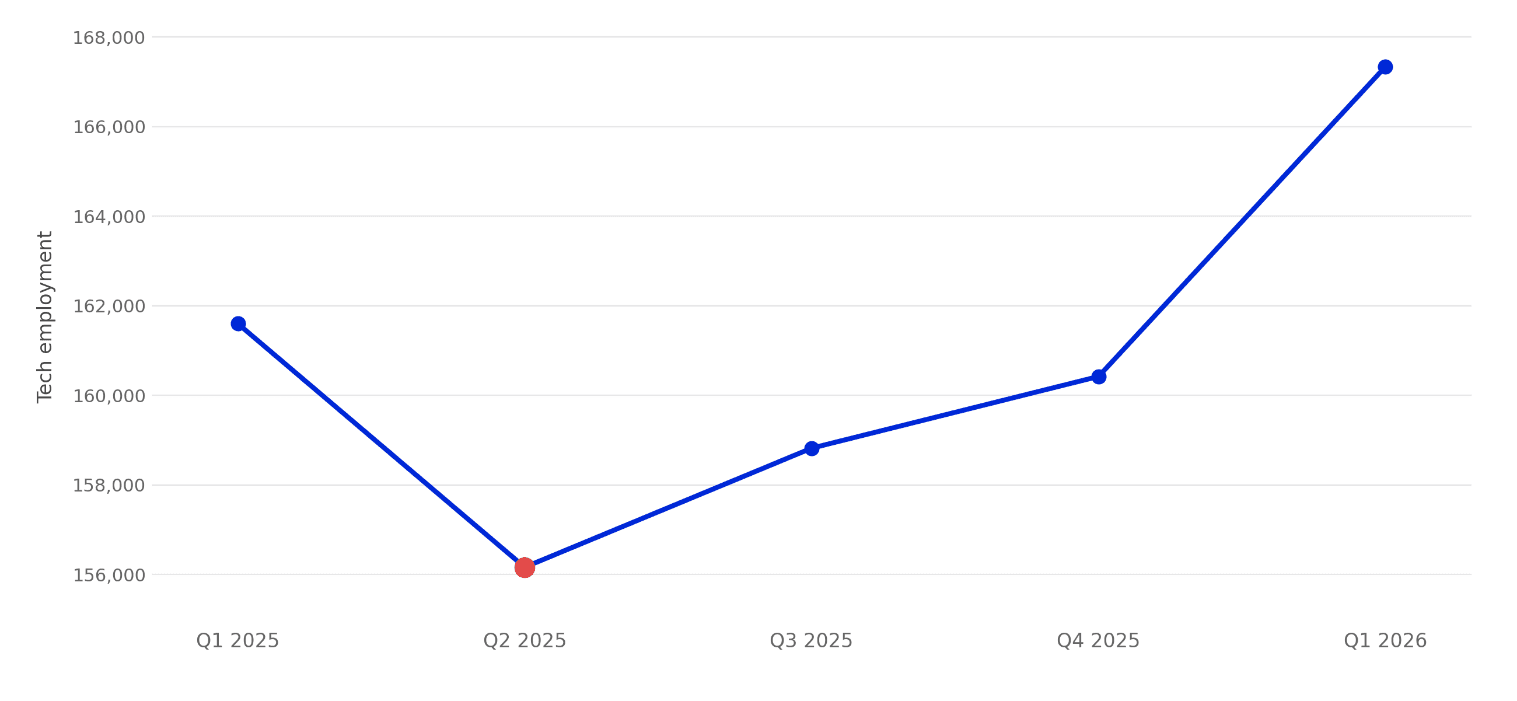
The quarterly BLS data provides a clearer view of the turn. Technology employment declined through Q2 2025 and then increased for three consecutive quarters.
Figure 3: San Francisco Bay Area Tech Employment by Quarter (Q1 2025 to Q1 2026, six core technology industries)
Values rebound as fundamentals improve
Tech employment recovery underpins multifamily rent growth in the San Francisco Metro, but it is not evenly distributed. Figure 4 shows the aggregate employment-rent connection, but beneath this metro-level trend sits a critical differentiation: AI hiring is geographically concentrated in specific employment clusters and submarkets. This means that while overall tech employment validates overall rent recovery, the intensity and durability of rent growth will vary significantly by submarket based on proximity to AI employment concentration. South of Market's value recovery, for example, is anchored to a different employment dynamic than East Bay submarkets. One aggregate employment story does not drive uniform value recovery across all markets. Understanding which submarkets are directly tied to AI job creation versus those reliant on secondary employment effects is essential for distinguishing rent growth that reflects durable demand from rent growth that may be more cyclical.
Figure 4: Tech employment, multifamily value and rent (San Francisco Metro, 2005 to 2026)
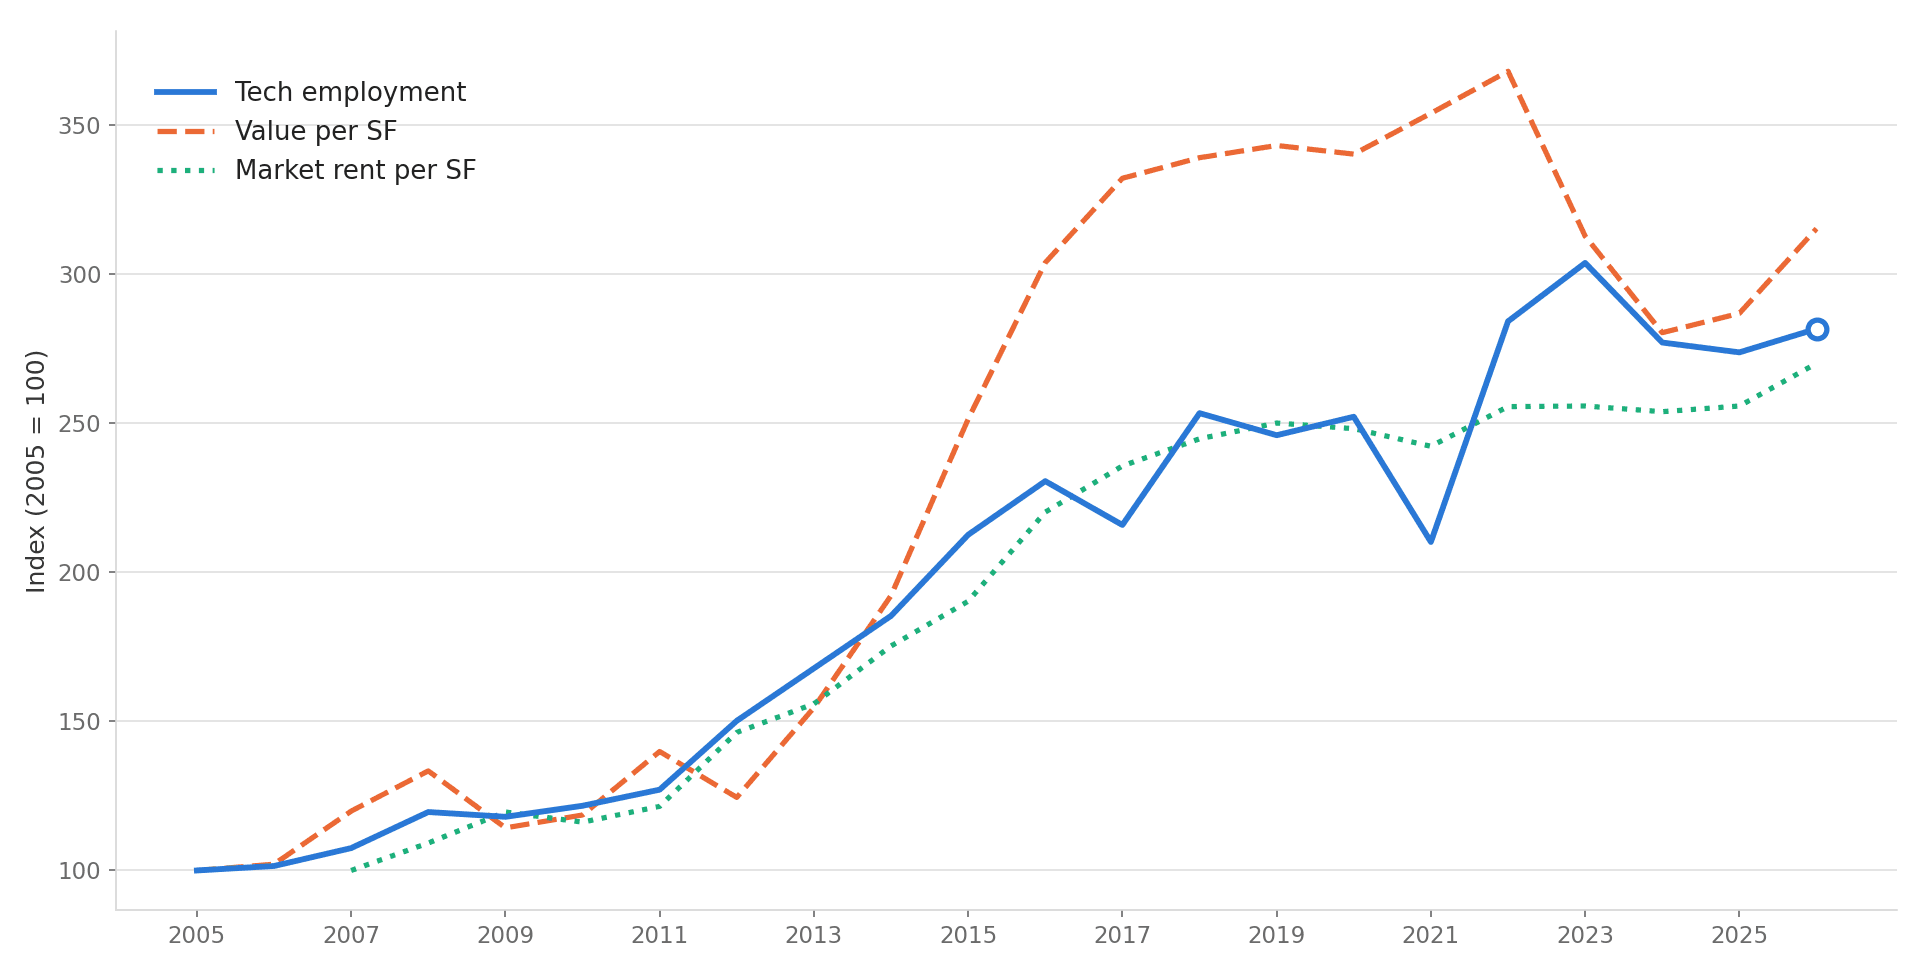
Sources: BLS QCEW (tech employment); Altus Portfolio Analyzer (value, rent); 10-Year Treasury average annual yield.
A concentrated submarket recovery
The rebound varies by submarket. In an unweighted comparison of the Moody’s 17 submarkets, the three strongest areas account for 72.3% of the measured rent acceleration. We consolidated those 17 submarkets into the seven groupings shown below to meet disclosure requirements and make the comparison easier to read. The result is clear: only a handful of locations are driving the recovery.
Figure 5: San Francisco Metro Submarket Rent, Growth, and Vacancy (Effective rent per unit, year over year growth, and vacancy by submarket)
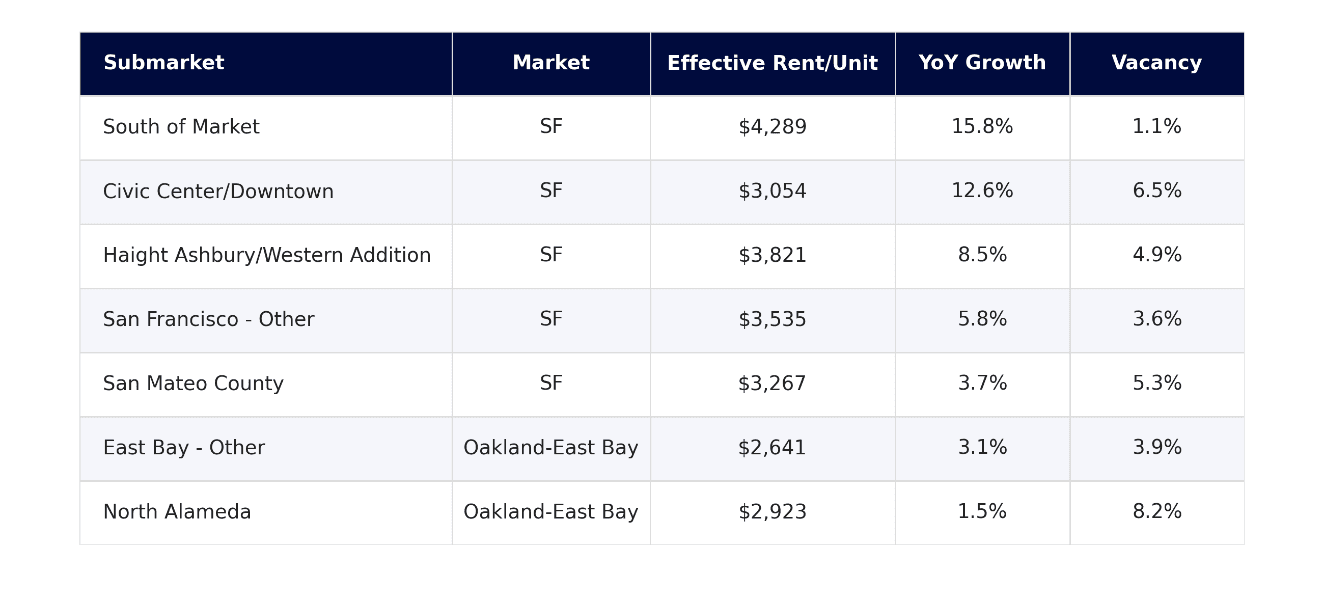
Source: Moody’s Analytics CRE, effective rent, Q2 2026 vs Q2 2025.
The same-store Altus data points in the same direction: submarkets with stronger effective-rent growth generally posted stronger value gains. The relationship is not one-for-one because expenses, capitalization rates, asset quality, and investor expectations also affect value. Still, the pattern supports using submarket-specific operating assumptions before making valuation-rate adjustments where relevant and possible.
Figure 6: San Francisco Metro Multifamily Submarket Performance (Market rent growth and same-store value change by submarket | Q2 2025 to Q2 2026 year over year)
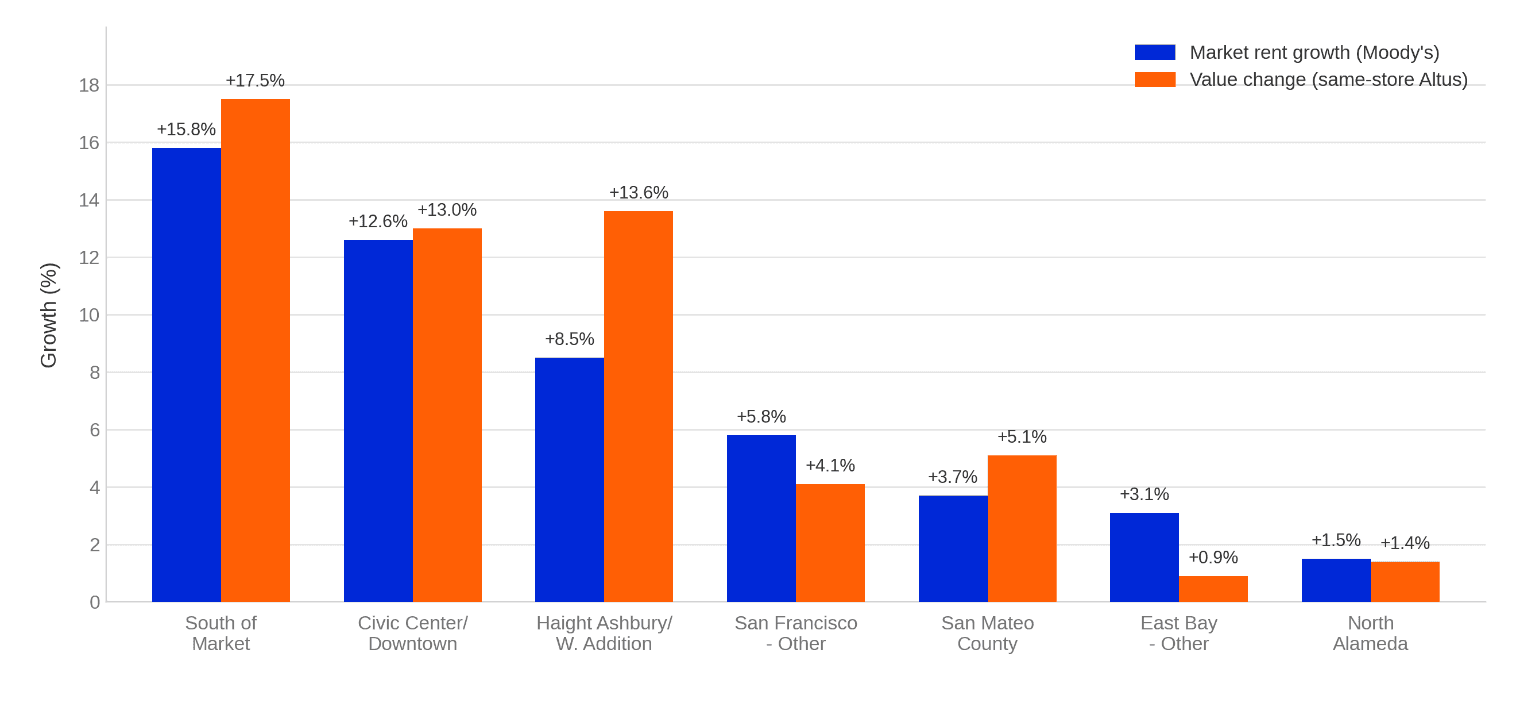
Sources: Moody’s Analytics CRE (rent); Altus Portfolio Analyzer, same-store assets (value).
The rent and value data do not explain why certain submarkets are outperforming. One likely contributor is AI-related employment. The strongest-performing submarkets sit near rapidly growing AI employers and have also seen a sharp slowdown in new housing deliveries.
The composition of hiring matters
The employment data provides more detail on the timing and makeup of the recovery.
The annual employment data and appraised values should not be viewed as having the same type of lag because they use different measurement and reporting processes. Quarterly data shows technology employment reaching its recent low in Q2 2025 and then increasing for three consecutive quarters. By Q1 2026, employment was 4.3% above the prior-year level.
The rebound is narrow, not a broad-based technology rehiring wave. From Q1 2025 to Q1 2026, growth was concentrated in Software Publishers (+12.7%) and Computing Infrastructure Providers (+7.3%), while Computer Systems Design contracted (-13.6%). That mix looks different from the broad technology expansion of the 2010s and is more consistent with the software and infrastructure needs of the current AI cycle.
Figure 7: San Francisco Metro Tech Employment Change by Industry (Q1 2026 versus Q1 2025)
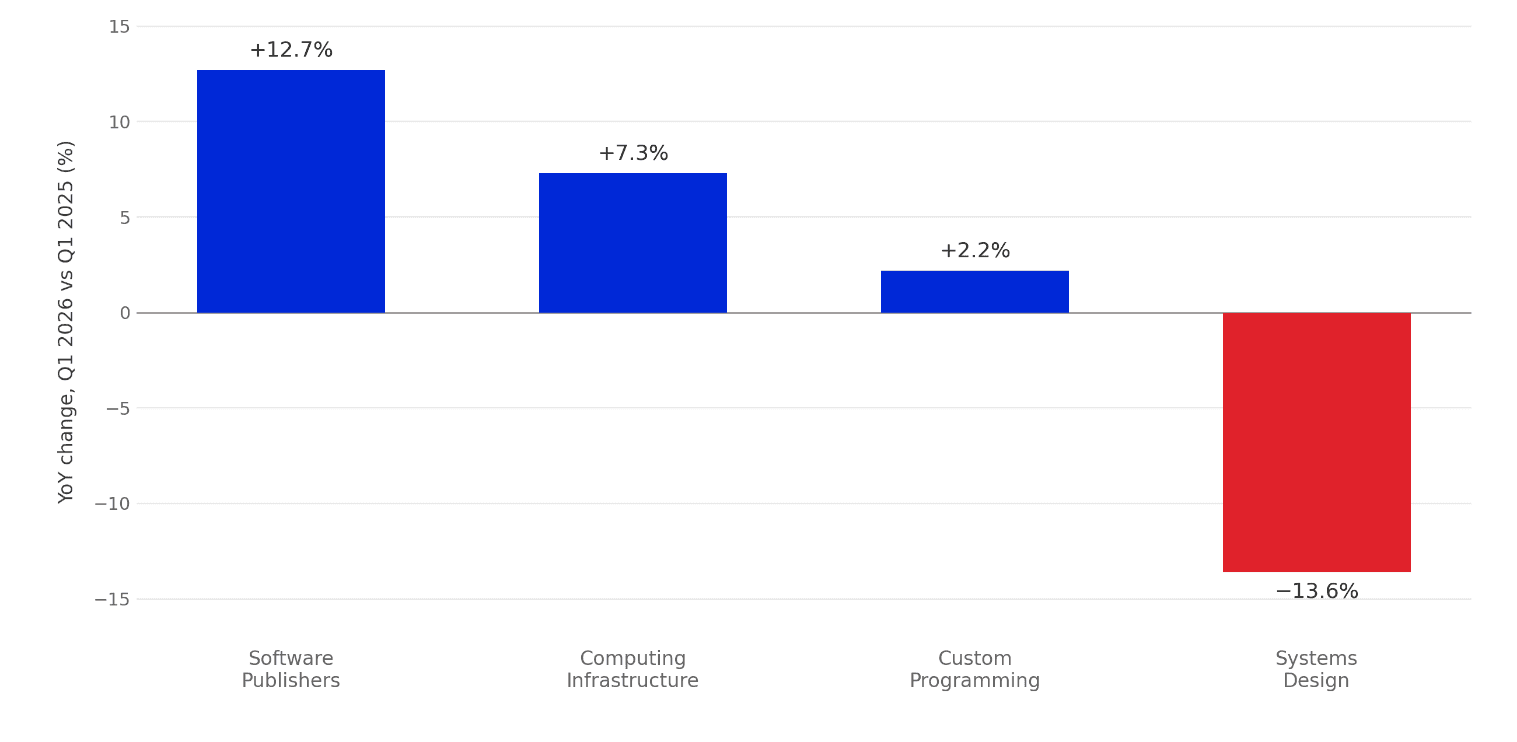
Source: BLS QCEW, five-county CBSA sum, four largest tech-related NAICS codes, Q1 2026 vs Q1 2025.
AI employment nodes and geographic overlap
Anthropic’s headquarters at 500 Howard Street (ZIP code 94105) and OpenAI’s headquarters at 1455 Third Street (ZIP code 94158) both overlap with Altus assets in the South of Market grouping. This puts the strongest rent and value performance next to two major AI employment nodes. In February 2026, Anthropic’s president said the company had more than 1,300 employees in the Bay Area, as it leased all of 300 Howard Street, an office tower near its headquarters. The overlap is suggestive of AI-related demand, and other factors, such as limited new supply, likely contributed.
Demand meets a reduced supply pipeline
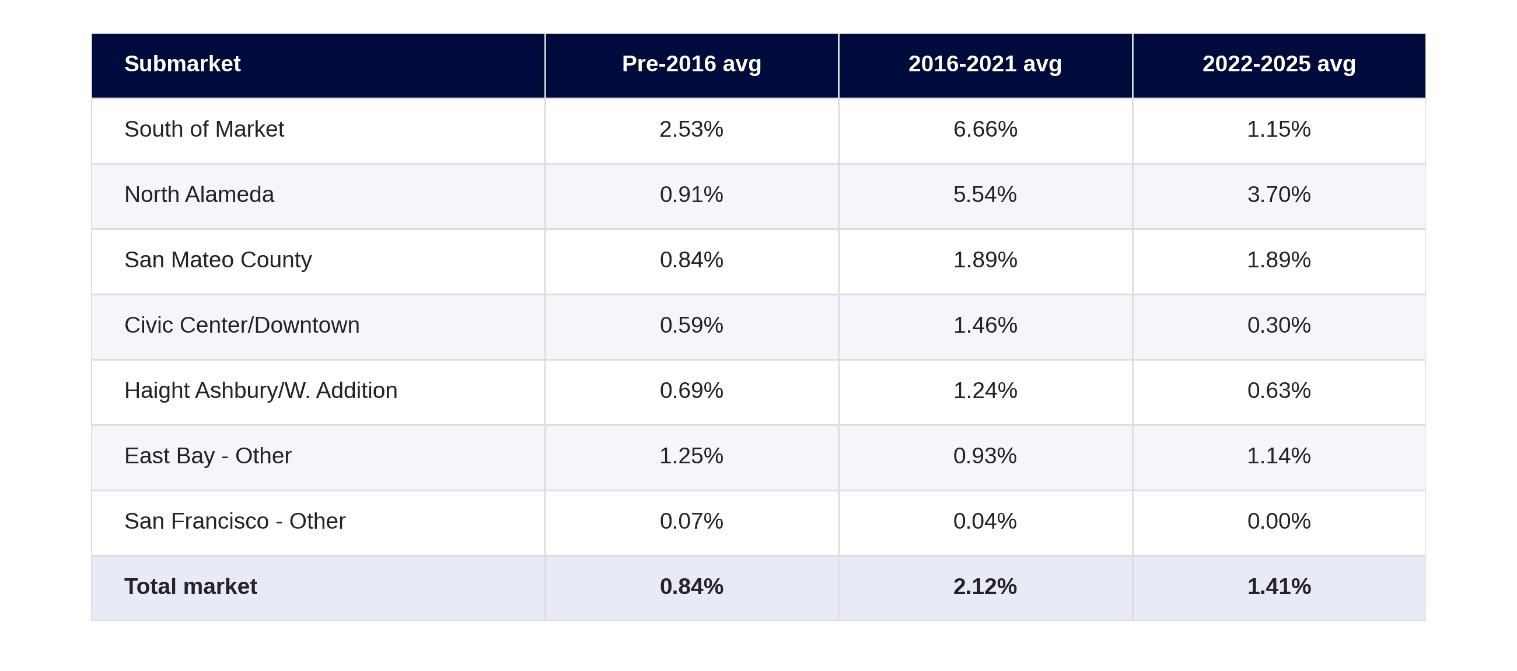
The hiring rebound is also landing in submarkets where new housing deliveries have slowed sharply. South of Market’s (SoMa) annual construction rate fell from an average of 6.66% during 2016-2021 to 1.15% during 2022-2025, below its longer-term average. Civic Center/Downtown also recorded limited deliveries. The table below shows the same comparison across all seven consolidated submarkets and the CBSA.
Figure 8: Average Annual Construction Rate by Submarket (Completions as a share of prior year inventory, by period)
Source: Moody’s Analytics CRE, annual completions relative to prior-year inventory.
North Alameda is a useful comparison. Construction was also elevated there during 2016-2021, but the recent construction rate remains above its long-term average. Rent and value growth have been weaker where supply has continued to come online.
The scale difference is still useful context: SoMa’s recent net absorption is small relative to the reported headcount growth at nearby AI employers.
Implications for valuation
The takeaway is that demand alone does not explain the outperformance. AI hiring near SoMa has coincided with a sharp slowdown in housing deliveries from the prior cycle. Employee residence data is not available, so this analysis links employment, supply, rent and value performance at the submarket level and not at the household level. At that level, concentrated employment growth, tighter vacancy, and limited new supply provide a reasonable explanation for the recent rent and value gains.
The recovery is not uniform across the city. It is led by South of Market, Civic Center/Downtown, and Haight Ashbury/Western Addition. That has practical implications. Portfolio managers should stress test rent growth and capitalization rate assumptions by submarket and not rely on a single CBSA-wide assumption. Appraisers should not treat SoMa sales and leasing evidence as interchangeable with the rest of the CBSA and should adjust comparables for submarket-level differences in rent growth and supply. San Francisco multifamily is not behaving like one market today. A small, supply-constrained group of submarkets is recovering faster, while much of the broader CBSA is growing, albeit at a much slower pace.

Access data-powered valuation advisory services
Leverage our market expertise, leading ARGUS technologies, and unique valuation datasets you need to drive asset performance and manage risk.
Want to be notified of our new and relevant CRE content, articles and events?
Disclaimer
This publication has been prepared for general guidance on matters of interest only and does not constitute professional advice or services of Altus Group, its affiliates and its related entities (collectively “Altus Group”). You should not act upon the information contained in this publication without obtaining specific professional advice.
A number of factors may influence the performance of the commercial real estate market, including regulatory conditions and economic factors such as interest rate fluctuations, inflation, changing investor sentiment, and shifts in tenant demand or occupancy trends. We strongly recommend that you consult with a qualified professional to assess how these and other market dynamics may impact your investment strategy, underwriting assumptions, asset valuations, and overall portfolio performance.
No representation or warranty (express or implied) is given as to the accuracy, completeness or reliability of the information contained in this publication, or the suitability of the information for a particular purpose. To the extent permitted by law, Altus Group does not accept or assume any liability, responsibility or duty of care for any consequences of you or anyone else acting, or refraining to act, in reliance on the information contained in this publication or for any decision based on it. The distribution of this publication to you does not create, extend or revive a client relationship between Altus Group and you or any other person or entity. This publication, or any part thereof, may not be reproduced or distributed in any form for any purpose without the express written consent of Altus Group.
Author
Chisem Phillips
Director, Market Expert, Valuation Advisory
Resources
Latest insights