Canadian commercial real estate market update – Q2 2026
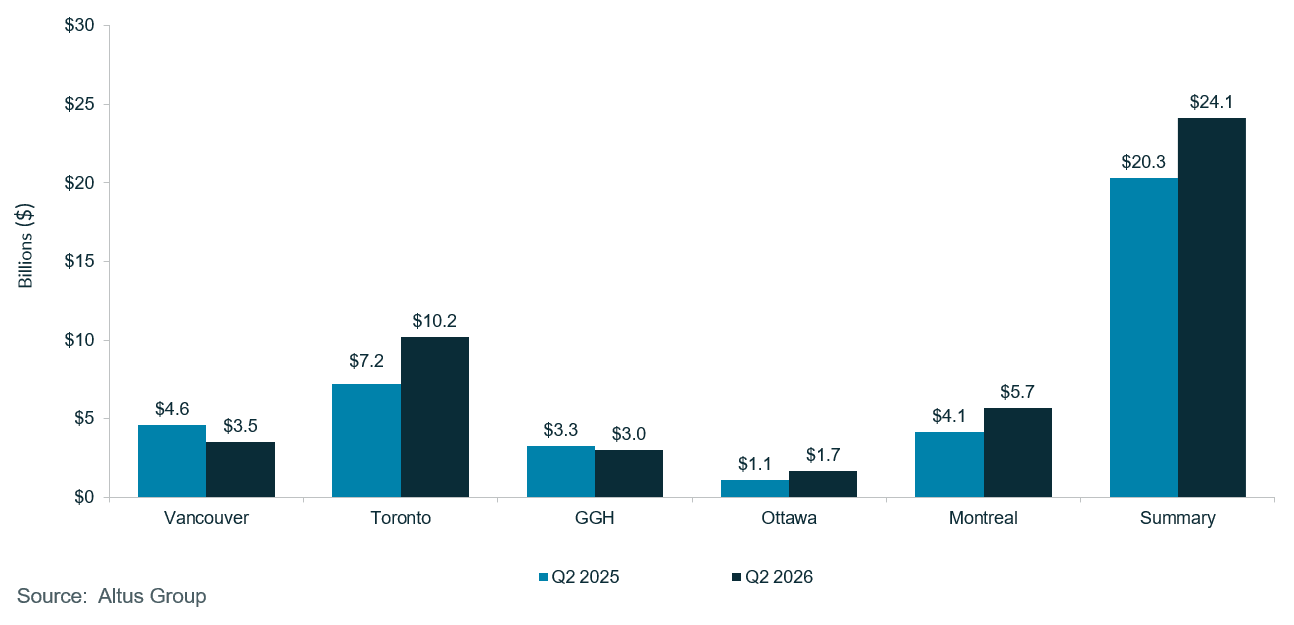
Canada CRE investment hit $24.1B in H1 2026, up 19% YoY, led by multi-family and office growth across key eastern markets.
Canadian commercial real estate market update – Q2 2026
Canada CRE investment hit $24.1B in H1 2026, up 19% YoY, led by multi-family and office growth across key eastern markets.
Author

Jennifer Nhieu
Senior Research Analyst
Key highlights:
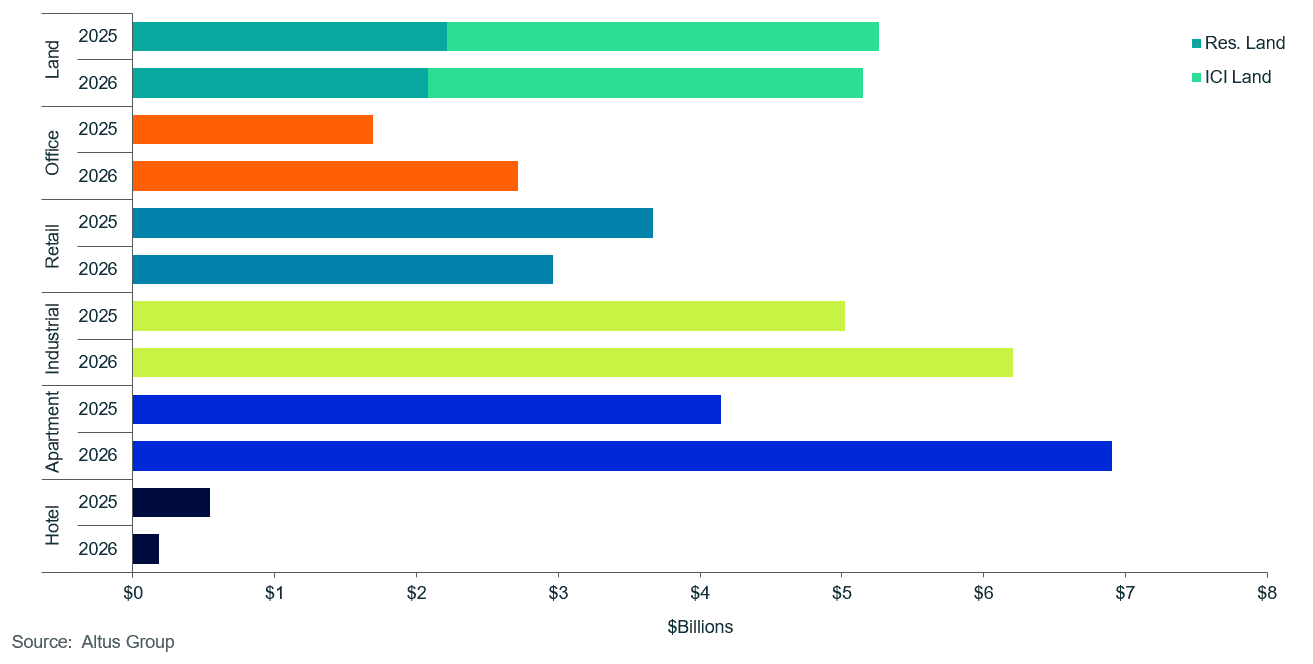
Total national investment volume for the first half of 2026, excluding the Alberta markets, reached $24.1 billion, supported by year-over-year increases of 67% in multi-family and 61% in office activity, with growth concentrated in the eastern markets
Sector performance diverged across the market, with multi-family and office leading national growth, industrial stabilizing and retail remaining constrained by limited premium inventory
Looking ahead, market recovery is expected to remain disciplined, with capital concentrated in high-quality assets offering durable income, strong tenant demand and clear long-term fundamentals
Investment volume and core drivers of resilience
During the first half of 2026 (H1 2026), Canada’s commercial real estate (CRE) market remained resilient amid a complex macroeconomic backdrop, reaching more than $24 billion in total investment volume, a 19% year-over-year increase. Domestic monetary policy offered essential predictability as the Bank of Canada (BoC) held its overnight rate steady amid persistent inflation, which helped anchor long-term cost-of-capital expectations. This monetary policy stability was paired with a strong economic rebound, highlighted by an annualized 3.3% GDP growth in the second quarter, led by higher exports, household spending and business capital investment.
Figure 1: Canada’s total investment activity YTD – All sectors by region ( Q2 2025 vs Q2 2026)
At the same time, shifting demographic and employment patterns began recalibrating space demand across key regions. Moderate labour force adjustments and a shift in net migration trends tempered broad-based rent growth expectations, which prompted institutional buyers to re-evaluate traditional underwriting models. Although solid employment additions in sectors such as logistics and construction continued to support underlying commercial activity, overall labour market moderation kept aggressive absorption projections restrained.
These macroeconomic forces directly reshaped investor sentiment across Canada, particularly within major liquidity hubs such as the Greater Toronto Area (GTA) and Montreal. Rather than relying on general market tailwinds or speculative development, Canadian investors prioritized capital preservation, clear policy support and income durability. Capital allocations grew increasingly selective, concentrating predominantly on prime multi-family and strategically located office assets backed by secure cash flows, while speculative construction remained largely deferred until demand fundamentals and debt markets further stabilized.
Figure 2: Canada’s property transactions by asset class (Q2 2025 vs. Q2 2026)
Regional investment performance
During H1 2026, Canada’s CRE market showed divergent growth patterns across major metropolitan areas. Although the GTA recorded the highest overall investment volume, national growth was driven largely by stronger transaction activity in Ottawa and Montreal. This momentum made these two markets the primary contributors to Canada’s overall upward trajectory, helping offset continued transaction stagnation in Vancouver and the other Greater Golden Horseshoe (GGH) Area.
Greater Toronto Area (GTA)
The GTA continued to be the cornerstone of investment activity in Canada. After a slow start to the year, the market picked up significantly in the second quarter, recording nearly $10.2 billion in investment volume year-to-date, a 41% year-over-year increase. Market expansion remained promising despite broader economic headwinds. Investor sentiment was defensive yet opportunistic, supported by local policy catalysts, including municipal development charge reductions and rental tax relief measures. Capital focused primarily on specific asset classes, such as multi-family, Class AAA office and modern industrial facilities, which offered stronger income stability and long-term resilience.
Ottawa and Montreal
Ottawa surpassed Montreal as a key driver of national growth through the second quarter of 2026, despite broader macroeconomic headwinds. Regional investment volume reached $1.7 billion, up 52% year-over-year, led by multi-family activity and renewed office-sector confidence following sustained return-to-office mandates across both public and private institutions. Montreal also recorded robust growth, with investment rising 38% year-over-year to $5.7 billion. Activity was supported by major institutional transactions including DekaBank’s acquisition of the Tour Deloitte office tower, alongside sustained demand for industrial assets. Together, these diversified capital inflows helped insulate Ottawa and Montreal from the transaction stagnation affecting other major Canadian markets.
Other Greater Golden Horseshoe (GGH)
Investment activity in the other Greater Golden Horseshoe (GGH) areas slowed notably, with total transaction volume reaching a modest $3.0 billion, down 8% year-over-year. This reflected a broad deceleration across most property sectors, with multi-family standing out as the primary exception due to continued intra-provincial migration out of the higher-cost GTA core. The slowdown was driven largely by weaker retail investment activity, reflecting a shortage of premium inventory in high-demand corridors rather than a deterioration in consumer fundamentals.
Vancouver
Vancouver’s investment volume declined 23% year-over-year to $3.5 billion, reflecting weaker activity across nearly all core asset classes amid stringent regional regulatory frameworks and elevated development costs. Office sector momentum in the first quarter was largely supported by BentallGreenOak’s $246 million acquisition of Oxford Properties’ Oceanic Plaza. Retail remained Vancouver’s most defensive sector and the only major asset class to post year-over-year growth, though modest. First-half retail transaction volume edged up 1% to $866 million, supported by steady investor demand for necessity-based grocery-anchored strip centres, prime street-front locations and assets featuring low vacancy and inflation-hedging characteristics.
Calgary and Edmonton
Comprehensive second-quarter performance metrics for Calgary and Edmonton remained incomplete at the time of reporting due to compounding delays at the Alberta Land Titles Office. Initial underlying data indicated that both markets experienced a tempered start to the year. In Calgary, first-quarter investment volume fell 27% year-over-year to $1.1 billion following a strong 2025 finish. This deceleration was driven by a drop in multi-family transactions, down 70% as buyers paused for yield adjustments and downtown office rationalizations following energy-sector consolidation. Similarly, Edmonton recorded measured deal flow with $1.0 billion, down 17%, as capital deployment remained disciplined amid elevated borrowing costs and cautious corporate expansion strategies.
Retail
Through H1 2026, grocery-anchored retail assets remained a preferred defensive investment for institutional and private capital across Canada. Investors gravitated toward essential-service properties supported by near-zero vacancy, minimal tenant turnover and durable protection from e-commerce disruption. Persistent inflation reinforced the sector’s appeal as a capital hedge, while supply constraints further tightened. Existing owners largely retained high-performing, income-generating assets and elevated financing costs continued to restrict new development. As a result, the scarcity of prime inventory, rather than weaker consumer fundamentals, capped second-quarter transaction velocity even as retail demand remained stable.
Faced with limited acquisition opportunities, market participants focused on unlocking value within existing retail footprints. Well-capitalized owners increasingly shifted away from large-scale mixed-use redevelopment as the weak pre-sale condominium market reduced a key funding source for high-density projects. Instead, asset managers directed capital toward retail intensification strategies, including pad-site development and tactical re-tenanting, which required lower capital outlay, reduced planning complexity and accelerated cash-flow realization.
From a regional perspective, significant disparities in investment velocity were driven by localized supply dynamics and asset availability. The Ottawa retail market recorded the highest year-over-year growth rate in the country at 51%, though this surge was amplified by a small baseline, with nearly $211 million in total dollar volume transacted during the first half. Following this leading pace, year-over-year investment activity in Montreal and Vancouver remained comparatively stable.
Montreal recorded a 10% year-over-year increase in volume, supported by the notable $44.5 million acquisition of Faubourg Bois-Franc, a pharmacy-anchored neighbourhood retail strip, along with several automotive property and dealership acquisitions. Vancouver posted a modest 1% year-over-year increase in retail investment activity but still ranked second nationally in total volume after the GTA, with $866 million transacted. This total was supported by the $108.5 million sale of Great Canadian Casino Vancouver, formerly the Hard Rock Hotel, as well as several hotel, automotive dealership and luxury downtown street-frontage transactions.
In contrast, retail investment in the GTA and GGH faced significant headwinds, with total volumes falling to $925 million and $430 million, representing year-over-year declines of 30% and 50%, respectively. The slowdown was driven mainly by limited availability of premium assets and elevated borrowing costs, which constrained both leasing momentum and new development. Within the surrounding GGH submarkets specifically, this contraction was exacerbated by an acute scarcity of institutional-grade, grocery-anchored stock entering the open market, as well as a slowdown in greenfield retail development tied to delayed suburban residential expansions. Near-term retail spending was also pressured by softer regional population growth, reduced household purchasing power and weaker consumer confidence, as households prioritized essential goods over discretionary purchases. Despite these challenges, the GTA retail market remains attractive over the long term, supported by its position as Canada’s leading commercial hub and a key entry point for major international brands expanding into Canada.
Office
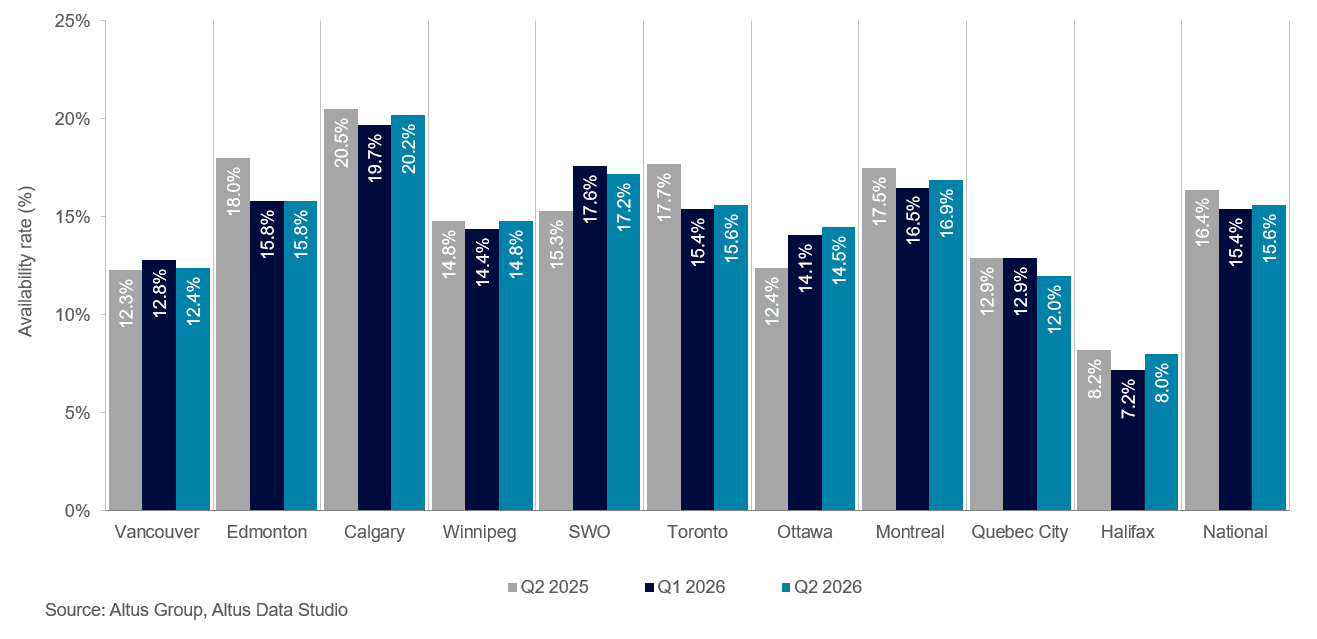
Canada’s office sector maintained its upward rebound through H1 2026, transitioning from tentative stabilization into a sustained recovery. According to our latest Canadian office market update, in the second quarter, the national office availability rate contracted 80 basis points (bps) year-over-year to settle at 15.6% (Figure 3). This tightening was driven primarily by stricter return-to-office policies across corporate and public-sector employers. These updated attendance mandates restored predictable physical attendance to major downtown cores, establishing a clearer baseline for long-term organizational space planning. Concurrently, occupiers accelerated efforts to optimize layout efficiency, driving positive net absorption and reducing sublease inventory across major metropolitan centres toward historical averages.
Figure 3: Office availability rate (Q2 2025 vs Q1 2026 vs Q2 2026)
Supply-side constraints further reinforced this market tightening. National office construction fell to a historic low, while limited new deliveries and the removal of select Class B and C inventory through conversions or demolition kept supply growth minimal. With prime trophy assets rapidly tightening, occupiers and institutional buyers expanded their focus toward legacy Class A properties, catalyzing targeted asset repositioning and adaptive reuse strategies to capture spillover demand.
Within the capital markets, investment volume surged 61% year-over-year to approximately $2.7 billion. Capital deployment was concentrated in the Class AAA and prime Class A segments, reflecting continued flight-to-quality as institutional buyers prioritized amenitized, sustainable assets. Transaction metrics from the first half of 2026 clearly reflected this asset class bifurcation:
Class A transactions accounted for the majority of market activity, with 262 deals encompassing 7.2 million square feet
Conversely, Class B office space saw significantly lower demand, comprising only 55 transactions totalling 1 million square feet, highlighting the growing obsolescence of aging, suburban non-amenitized inventory
Regional dynamics across Canada’s primary office markets reflected a clear divergence in capital deployment through H1 2026, as investors concentrated liquidity in centres exhibiting strict return-to-office enforcement and tight prime availability. Ottawa, Montreal and the GTA served as the primary growth engines. Ottawa led the nation in office investment growth, surging 582% year-over-year to $359 million, propelled by expanding federal and public-sector attendance mandates that stabilized foot traffic and restored investor confidence across core downtown assets. Montreal followed as the second-largest driver in both relative growth and absolute volume, with investment expanding 149% year-over-year to $720 million. This momentum was backed by three consecutive quarters of strong net absorption and major institutional acquisitions. Meanwhile, the GTA cemented its position as Canada’s premier office market, posting a 125% year-over-year increase in transaction volume to $1.15 billion. GTA activity was anchored by an acute scarcity of trophy Class AAA space, where downtown financial core availability dropped to 9.6%.
Conversely, secondary submarkets and select Western centres experienced temporary pauses in deal execution. Vancouver’s office investment volume saw a pronounced retreat, dropping 46% year-over-year to $394 million. This pullback reflected capital market friction rather than weakening tenant demand, as valuation gaps persisted between cautious institutional buyers and vendors unwilling to trade stabilized, income-generating properties at lower prices. In a similar trend, the GGH recorded a 13% year-over-year decline to $94 million as institutional capital favoured primary urban cores, leaving secondary suburban assets to private investors and user-owners.
Industrial
The Canadian industrial sector entered a period of stabilization through H1 2026 as the market continued to absorb the speculative supply wave created by prior-year development completions. Investor sentiment shifted further toward higher-quality assets. Total transaction volume reached nearly $6.2 billion nationally, up 24% year-over-year, reflecting a highly selective acquisition strategy among institutional investors that favoured core, functional assets with long-term income stability over speculative, high-growth opportunities.
The GTA served as a primary anchor for national investment activity, recording nearly $3.6 billion in total transaction volume, a 38% year-over-year increase driven by several high-value acquisitions. Bucking broader macro headwinds, Ottawa and Montreal recorded impressive year-over-year growth of 177% and 49%, respectively. Ottawa’s volume reached $229 million, driven largely by Regional Group’s $143 million acquisition of the EDC Building alongside the Government of Canada’s $59 million purchase of 1600 & 1630 Star Top Road.
Montreal’s market displayed clear signs of recovery as investment reached $950 million, following a volatile operational stretch where investors adjusted to softer domestic conditions. Within Montreal, geography and building age were critical performance differentiators. Institutional deployment into the Island of Montreal core assets remained constrained by aging infrastructure, limited clear heights and elevated municipal tax burdens. Conversely, the South Shore expanded its footprint as a hub for next-generation logistics, attracting substantial institutional capital targeting larger land sites and modern building specifications.
Conversely, investment activity across both Vancouver and the GGH softened, with volumes declining by 19% and 11% year-over-year, respectively. Despite this localized deceleration, the GGH remained a foundational cornerstone for last-mile logistics, capturing nearly $797 million in deal volume. This pullback across both regions reflected defensive acquisition strategies, compounded by an exceptionally strong Q1 2025 baseline, which created a high threshold for year-over-year comparisons. In Vancouver, tenant and investor demand remained deeply bifurcated. Tight urban infill submarkets compelled occupiers to right-size operational footprints to manage costs, while non-prime suburban assets held steady to preserve baseline regional occupancy.
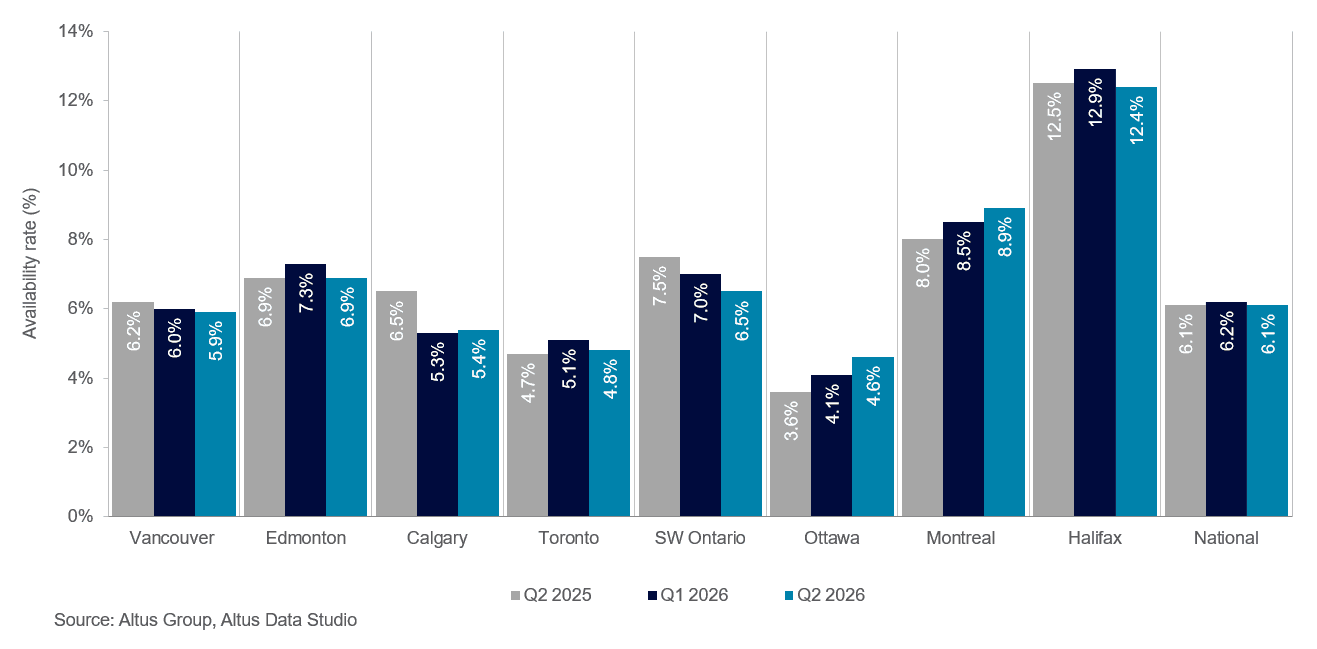
Underpinning these transaction dynamics, operational performance through the first half of 2026 reflected disciplined development alongside cautious tenant expansion. According to our Canadian industrial market update, in the second quarter, the industrial availability rate plateaued year-over-year at 6.1% (Figure 4). National completions added 3.5 million square feet across 28 projects during the quarter, while the active construction pipeline moderated to 117 projects totalling nearly 24 million square feet. As occupier focus shifted toward capital preservation and strategic footprint optimization, average national net asking rents stabilized between $15 and $16 per square foot. Downward rent pressure was concentrated in legacy assets with lower clear heights, whereas modern, high-specification logistics facilities maintained pricing resilience.
Figure 4: Industrial availability rate (Q2 2025 vs Q1 2026 vs Q2 2026)
Multi-family
Canada’s multi-family sector demonstrated strong investment momentum through H1 2026, with total transaction volume surging 67% year-over-year to $6.9 billion. This expansion signalled a clear rebound in investor sentiment following a constrained 2025, driven by narrowing bid-ask price spreads, improved debt market visibility and a slowing construction delivery pipeline that reduced long-term supply risk. Institutional and private capital actively targeted stabilized residential assets as a reliable recession-resistant cash flow hedge against broader macroeconomic uncertainty.
Eastern Canada urban centres served as the primary drivers of capital growth. Montreal remained the national catalyst, with investment volume expanding 30% year-over-year to nearly $2.9 billion. Elevated mortgage qualification thresholds continued to price prospective first-time home buyers out of ownership units, sustaining a deep, stable tenant pool across the rental market. Regional growth extended across major Eastern hubs, as the GTA, GGH and Ottawa posted dramatic year-over-year transaction volume increases of 244%, 182% and 55%, respectively, supported by strong institutional demand for well-located multi-residential portfolios.
In contrast, Vancouver’s multi-family sector experienced a sharp contraction, with total investment volume dropping 41% year-over-year to $372 million. This decline reflected operational headwinds stemming from a temporary supply imbalance on the West Coast. A wave of newly completed purpose-built rentals and investor-owned condominium units entered the market at the same time, temporarily increasing tenant leverage, slowing rent growth and pushing West Coast investors toward a more risk-averse stance. Despite this localized supply absorption phase in B.C., broader national multi-family fundamentals remained firm, underpinned by persistent long-term housing supply deficits across major Canadian urban markets.
Market Outlook
Looking to the second half of 2026, Canada’s CRE landscape is expected to shift from defensive posturing toward disciplined, opportunistic capital deployment. As monetary policy stabilizes and debt markets provide a clearer cost-of-capital baseline, buyer-seller valuation gaps should continue to narrow. Institutional liquidity is expected to target core, cash-flowing assets with resilient income streams, while agile private investors capitalize on localized pricing dislocations.
Investor sentiment is expected to remain bifurcated across property types and asset tiers. Liquidity should concentrate in prime Class AAA downtown office space with limited availability, modern logistics facilities and multi-family assets supported by long-term housing supply constraints. By contrast, Class B and C office and secondary industrial inventory may continue to face pricing pressure, landlord concessions, asset conversions and strategic repositioning.
Overall, the outlook favours investors focused on asset quality, durable income and disciplined portfolio optimization.

Leverage our real estate data and predictive analytics
The performance attribution, predictive analytics and market intelligence you need to explain performance and improve decision making.
Want to be notified of our new and relevant CRE content, articles and events?
Disclaimer
This publication has been prepared for general guidance on matters of interest only and does not constitute professional advice or services of Altus Group, its affiliates and its related entities (collectively “Altus Group”). You should not act upon the information contained in this publication without obtaining specific professional advice.
A number of factors may influence the performance of the commercial real estate market, including regulatory conditions and economic factors such as interest rate fluctuations, inflation, changing investor sentiment, and shifts in tenant demand or occupancy trends. We strongly recommend that you consult with a qualified professional to assess how these and other market dynamics may impact your investment strategy, underwriting assumptions, asset valuations, and overall portfolio performance.
No representation or warranty (express or implied) is given as to the accuracy, completeness or reliability of the information contained in this publication, or the suitability of the information for a particular purpose. To the extent permitted by law, Altus Group does not accept or assume any liability, responsibility or duty of care for any consequences of you or anyone else acting, or refraining to act, in reliance on the information contained in this publication or for any decision based on it. The distribution of this publication to you does not create, extend or revive a client relationship between Altus Group and you or any other person or entity. This publication, or any part thereof, may not be reproduced or distributed in any form for any purpose without the express written consent of Altus Group.
Author
Jennifer Nhieu
Senior Research Analyst
Resources
Latest insights





Sep 10, 2026
Labor data diverges, data centers dominate Beige Book, CRE implications from bond rout