Canadian office market update – Q2 2026
Canada's office market hit 15.6% availability in Q2 2026 as return-to-office mandates and record-low construction pipelines tightened conditions nationally.
Canadian office market update – Q2 2026
Canada's office market hit 15.6% availability in Q2 2026 as return-to-office mandates and record-low construction pipelines tightened conditions nationally.
Author

Jennifer Nhieu
Senior Research Analyst
Key highlights:
Source: Altus Data Studio market data and analysis
The national office availability rate declined by 70 basis points (bps) year-over-year to 15.6%, driven by increased demand for Class AAA office space and a significant reduction in new office construction
Edmonton’s office availability rate decreased by 220 bps year-over-year to 16.1%, representing the largest decrease among Canada’s office markets
The national office construction pipeline is at a multi-year low, with total square footage under construction at nearly three million, with only 37% of the space available for lease
Investor strategies have split sharply along asset quality lines, with institutional capital chasing premium buildings for stable tenant income while private equity targets underperforming Class B and C properties for conversion plays
In the second quarter of 2026, the national office availability rate contracted, settling at 15.6%
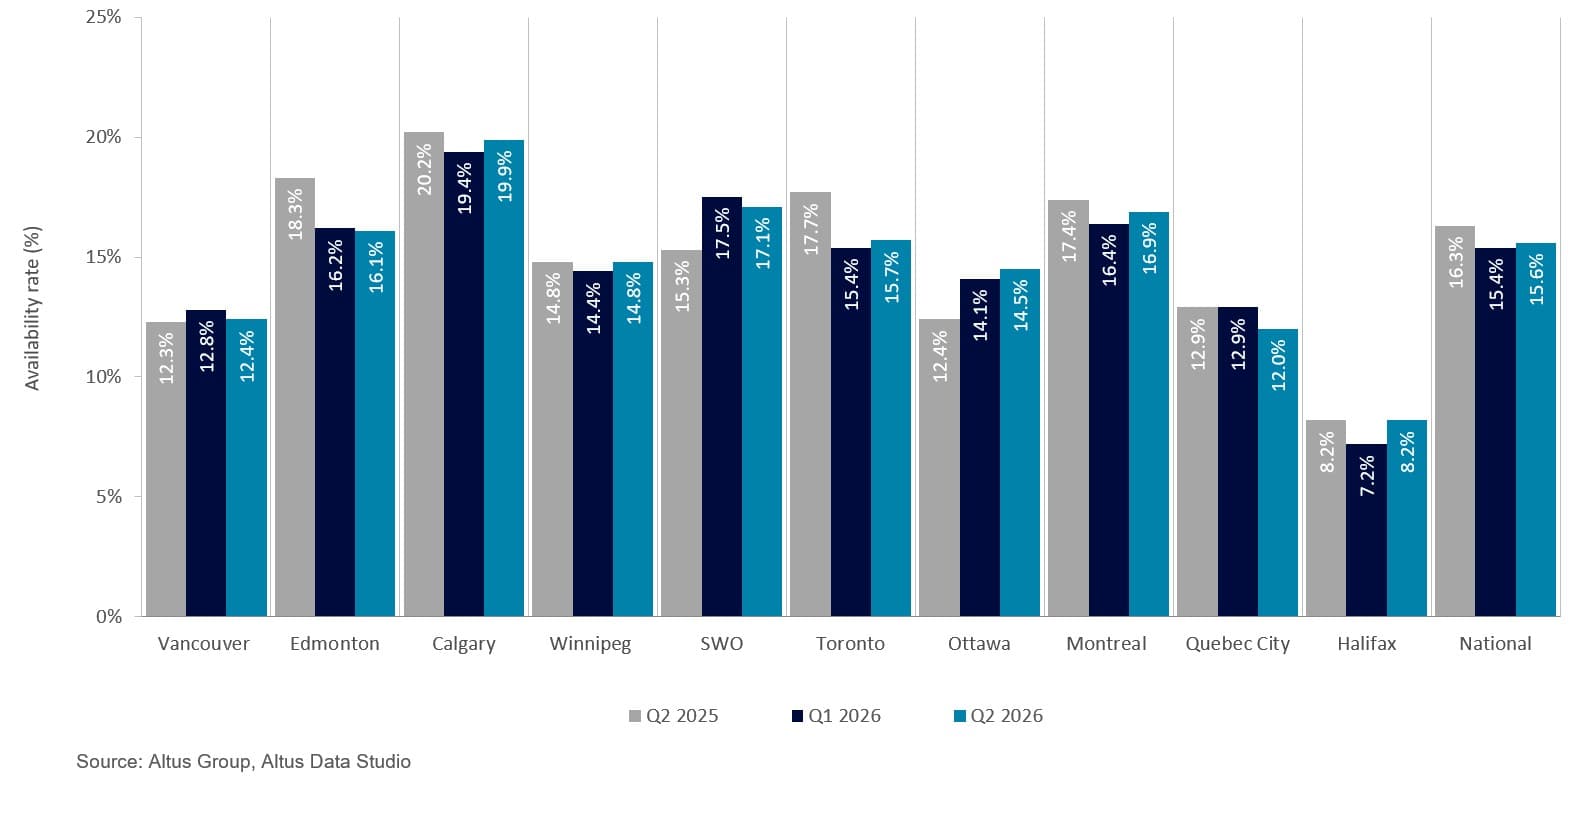
By the second quarter of 2026, the Canadian office market transitioned from a phase of tentative stabilization into a period of sustained, structural recovery. According to an analysis of data from Altus Data Studio, Canada's national office availability rate contracted 70 basis points year-over-year to 15.6%, building on positive leasing momentum established throughout the previous year (Figure 1). This contraction was driven primarily by the formal solidification of return-to-office mandates across both private and public sectors. Updated mandates requiring a more consistent in-office presence successfully restored stable, predictable foot traffic to major metropolitan downtown cores, establishing a baseline for long-term corporate space planning.
This recovery was heavily characterized by a distinct shift toward premium office real estate, as businesses prioritized modern, well-amenitized spaces to support their hybrid workforces. Demand focused heavily on top-tier buildings, driving a significant reduction in vacancy rates for prime properties and reducing sublease inventory toward historical averages. Conversely, older Class B and C properties continued to face utilization challenges, though their overall impact on market metrics was actively mitigated by structural supply reductions. New office construction across Canada fell to a multi-year low, while a select amount of underutilized inventory was systematically removed from the market for residential conversion projects. Consequently, this combination of limited new development and steady demand for quality space created a highly competitive environment in primary urban hubs.
Figure 1: Office availability rate (Q2 2025 vs. Q1 2026 vs. Q2 2026)
National and major market performance
The second quarter of 2026 revealed notable divergences across major Canadian office markets. This variation was largely defined by the tension between robust absorption in primary financial hubs and structural vacancies in markets undergoing inventory transitions. Despite these localized differences, a collective shift toward stabilization emerged as high-conviction leasing in the Class A segment began to outpace new supply and shadow inventory across most major centres.
Halifax maintained the nation’s lowest availability, with a flat year-over-year rate of 8.2%. To address housing shortages, the municipality actively leveraged the federal Housing Accelerator Fund to convert obsolete office buildings into residential units. Additionally, anticipated increases in federal defence spending were expected to further tighten the market by stimulating local recruitment and supporting military infrastructure.
In contrast, Calgary recorded the highest national availability rate at 19.9%, a 30 bps decline year-over-year, although this figure necessitated a more nuanced interpretation grounded in the city’s urban renewal strategy. The city’s Downtown Office Conversion Program, formerly known as the Downtown Development Incentive Program (DDIP), incentivized the conversion of underutilized office space into residential and productive developments. The program effectively facilitated market rebalancing. As of the second quarter of 2026, the city has a total of 21 office conversion projects converting approximately 2.68 million square feet in its pipeline. The program will create 2,667 residential units for Calgarians and 226 hotel rooms for visitors, and applications have reopened from June 15 to July 27, 2026.
Vancouver reported an availability rate of 12.4%, which represented a modest 10 bps increase year-over-year. While the city experienced a steady introduction of new office supply, the availability rate remained remarkably stable, holding within a narrow range of 12 to 13% for nearly three years. This equilibrium was supported by strong pre-leasing activity in recently completed projects, which prevented a significant spike in vacant stock. With a limited pipeline of new construction slated for the remainder of 2026, the market was positioned for a period of supply-side tightening as existing premium vacancies are gradually absorbed.
Ottawa’s availability rate increased by 210 bps to 14.5% year-over-year, surpassing the typical 12% to 14% range maintained for over three years. This trend was predominantly driven by shadow vacancies entering the market. These spaces represented leased office space that a tenant was not officially “occupying”, thereby masking the true amount of unused space in the market. Moreover, the market recorded its fifth consecutive quarter of negative absorption due to the return of several spaces in the suburban east and west submarkets.
Toronto’s availability rate reached 15.7%, marking a notable contraction of 200 bps year-over-year. This improvement stemmed from persistent tenant demand for premium downtown real estate, which subsequently drove downtown Class A availability in the Financial District down to 9.6%. Real estate stakeholders attributed this contraction to major banking institutions and the provincial government enforcing aggressive, multi-day return-to-office mandates. The recovery was further supported by a diminishing number of new completions, which limited the pool of high-quality Class AAA contiguous blocks for large occupiers and intensified competitive bidding for existing high-tier space. Moving forward, the scarcity of upcoming supply is expected to exert upward pressure on rental rates in premium assets.
Montreal’s availability rate contracted 50 bps to finish at 16.9%, indicating that the local market consolidated within a steady performance band. The region observed a meaningful reduction in active subleases. To address broader urban housing shortages, the municipal market accelerated office-to-residential conversions. This included major structural retrofits like the conversion of the Du Canal building, alongside massive urban mixed-use masterplans at the historic Molson Brewery plant and the former Radio-Canada/CBC headquarters. As regional leasing activity steadily gathered momentum, the overall market began moving toward a more balanced state, supported by the continuous absorption of existing vacancy and a disciplined development pipeline.
Quebec City recorded an annual contraction of 90 bps year-over-year to 12.0%. Interestingly, the prominent “flight-to-quality” trend observed across other major Canadian cities was less pronounced in this market. Local occupiers expressed a stronger preference for secondary, cost-effective Class B properties, pushing availability within that tier down to 9.6%, compared to the higher 14.9% seen in Class A. This distinct performance was driven by a regional tenant base that prioritized economical rent structures and non-central, suburban locations equipped with ample parking. This distinct localized behaviour highlighted how unique regional dynamics and specific tenant demographics can cause certain markets to deviate significantly from broader national office trends.
Employment and the office market
In June 2026, the Canadian labour market exhibited a notable improvement, with the national unemployment rate dropping 0.1 percentage point to 6.5%, as the economy added 18,000 positions. On a year-over-year basis, employment was up 99,000, driven by a net increase in full-time employment. The hiring momentum provided critical tailwinds for Canada’s commercial office sector, which entered a distinct phase of stabilization and tightening. While the 6.5% unemployment rate remained above the pre-pandemic average of 6.0% observed from 2017 to 2019, the fact that job growth was fuelled entirely by full-time positions gave corporate occupiers the confidence needed to execute long-term commercial leases.
Sectoral performance remained mixed throughout the quarter, as the third consecutive monthly increase in accommodation and food services stood in contrast to decreases in the manufacturing, agriculture, and utilities sectors. Concurrently, employment gains were observed in office-utilizing sectors, which boosted demand for premium office space in major employment hubs across Canada.
Crucially, Statistics Canada noted that the proportion of Canadians working exclusively from home continued its downward trajectory, as the share of employees working entirely outside of their home rose to 78.8% in May. Conversely, the share of those working entirely from home dropped 1.0 percentage point year-over-year, down a notable 7.3 percentage points from May 2022. This widespread transition back to the workplace, accelerated by strict return-to-office mandates for public servants and major financial institutions, put a fundamental floor under office demand. As remote-only work dropped and hybrid work schedules increased, the May 2026 labour data demonstrated that the physical office re-established its structural baseline, transitioning the office sector from its pandemic survival mode into stable, long-term space planning.
National office completions and new supply dynamics
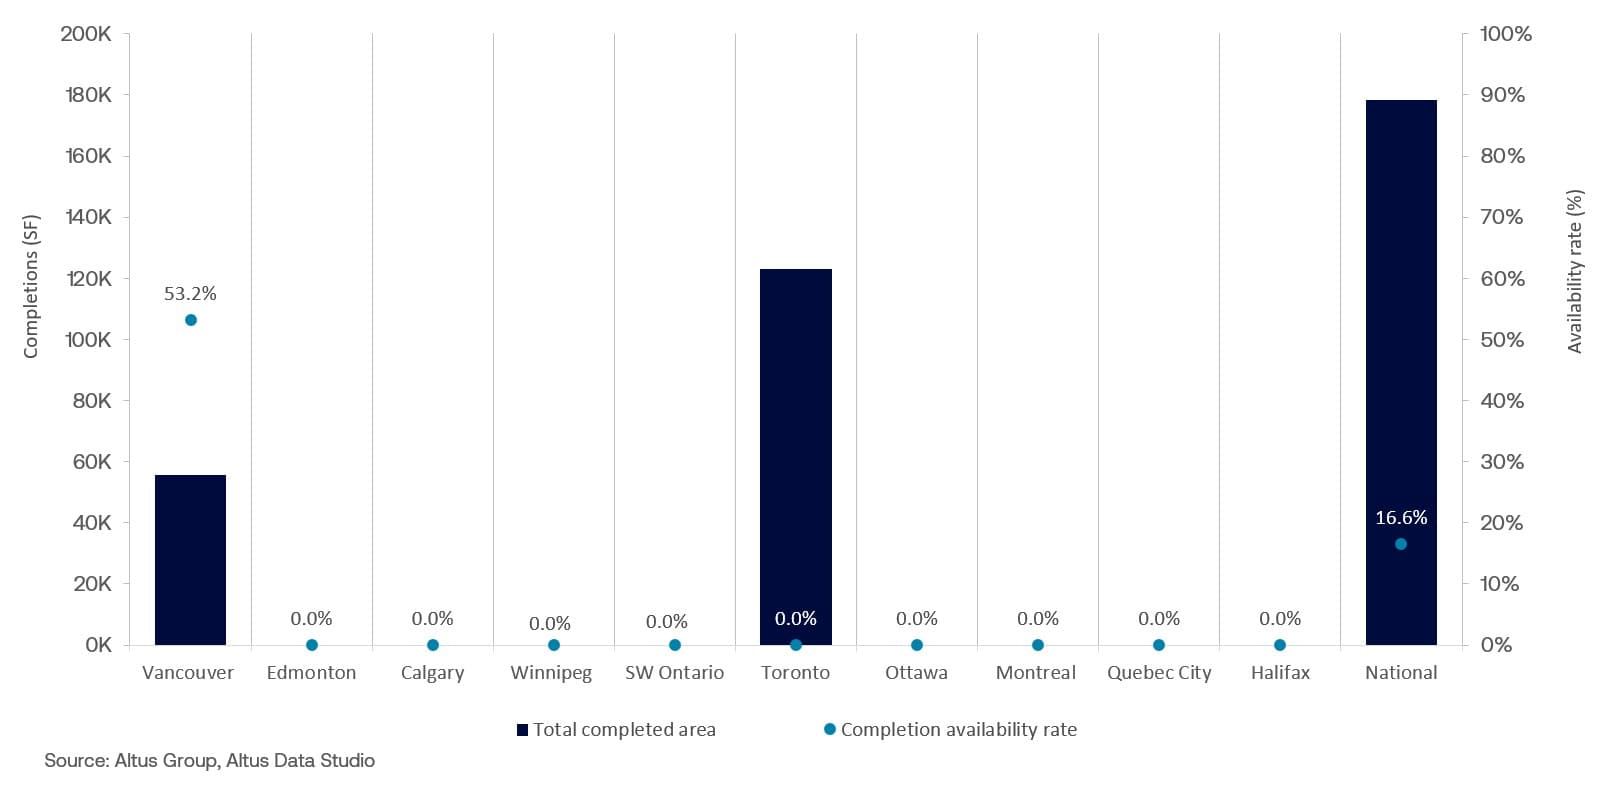
During the second quarter, four office buildings were completed in Canada, adding a combined 178,512 square feet to the market (Figure 2). Two were Class A buildings, totalling approximately 118,997 square feet: 837 Beatty, a 29,000-square-foot uncommitted building in Vancouver, British Columbia, and The Office at Y&S, an 89,397-square-foot fully leased building in Toronto, Ontario.
The remaining two buildings were fully leased Class B spaces, adding 59,500 square feet in total. They included The Valeo, a 26,000-square-foot mixed-use development in Burnaby, British Columbia, and Dunerin Executive Centre – Building 2 in Mississauga, Ontario, which added 33,515 square feet. The slowdown in new supply helped support the gradual absorption of existing inventory and reinforced the broader decline in national availability rates.
Figure 2: Office completions and availability (Q2 2026)
National office construction pipeline
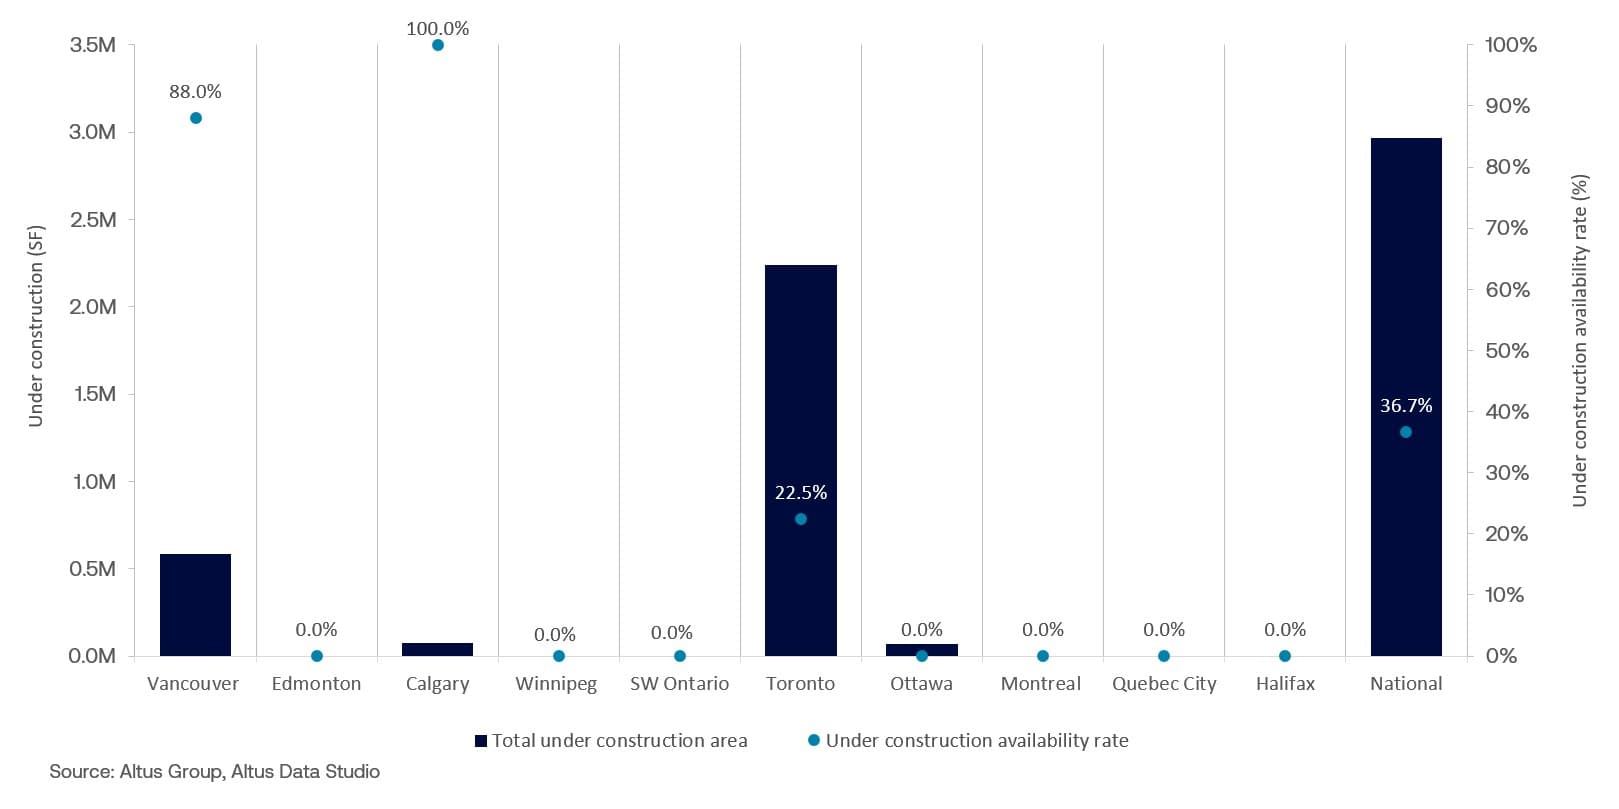
The national office construction pipeline contracted to a multi-year low, with 18 buildings under development representing nearly three million square feet (Figure 3). This substantial reduction in future supply aligned with selective yet resilient tenant demand, as 63% of the under-construction inventory secured pre-leased before completion. Vancouver and Toronto continued to anchor the country’s development activity. Vancouver's eight active projects totalled over 582,000 square feet with an 88% availability rate, whereas Toronto’s eight projects comprised approximately 2.2 million square feet with a significantly tighter availability rate of over 22%.
This ongoing contraction in the broader development pipeline limited choices for occupiers looking for contiguous blocks of premium space. As options remained scarce, demand for Class AAA assets spilled over into well-positioned Class A and, within secondary markets, Class B options. This shift drove up occupancy levels and compressed vacancies across existing buildings as tenants adapted to restricted development pipelines. As a result, the office sector increasingly shifted away from ground-up construction toward asset optimization, with retrofitting and upgrading aging buildings to align with modern corporate workspace requirements.
Figure 3: Office under construction and availability (Q2 2026)
Looking ahead
Looking ahead, the Canadian office market is positioned to move past its stabilization phase and enter a highly disciplined, supply-constrained cycle of performance. With national construction pipelines having plummeted to record lows and virtually no major deliveries scheduled for the near-term, the availability of Class A space will continue to constrict. This structural scarcity is expected to accelerate competition among occupiers, shifting the balance of power towards property owners of premium properties and exerting upward pressure on prime net asking rents. Consequently, occupiers must act with immediate strategic urgency to secure top-tier configurations before blocks of contiguous space disappear entirely from core metropolitan markets.
This strengthening operational foundation has fundamentally reshaped investor sentiment, driving a notable rebound in office leasing activity. Following an extended period of caution, capital allocation has shifted to active execution, with overall investment volumes projected to expand steadily. Institutional investors and well-capitalized private buyers are re-entering the market, drawn by compelling asset valuations and stabilized interest rates. However, investment strategies remained highly selective, mirroring the sharp structural bifurcation seen on the leasing front. Capital is flowing decisively into Class AAA and trophy assets that offer secure cash flows driven by credit tenants. Conversely, secondary Class B and C assets are being valued primarily for their opportunistic re-use potential, with private equity targeting underutilized structures for residential conversions. Ultimately, investor confidence is underpinned by a shared recognition that the sector has established a controlled supply environment favouring long-term value creation.
Want to be notified of our new and relevant CRE content, articles and events?
Disclaimer
This publication has been prepared for general guidance on matters of interest only and does not constitute professional advice or services of Altus Group, its affiliates and its related entities (collectively “Altus Group”). You should not act upon the information contained in this publication without obtaining specific professional advice.
A number of factors may influence the performance of the commercial real estate market, including regulatory conditions and economic factors such as interest rate fluctuations, inflation, changing investor sentiment, and shifts in tenant demand or occupancy trends. We strongly recommend that you consult with a qualified professional to assess how these and other market dynamics may impact your investment strategy, underwriting assumptions, asset valuations, and overall portfolio performance.
No representation or warranty (express or implied) is given as to the accuracy, completeness or reliability of the information contained in this publication, or the suitability of the information for a particular purpose. To the extent permitted by law, Altus Group does not accept or assume any liability, responsibility or duty of care for any consequences of you or anyone else acting, or refraining to act, in reliance on the information contained in this publication or for any decision based on it. The distribution of this publication to you does not create, extend or revive a client relationship between Altus Group and you or any other person or entity. This publication, or any part thereof, may not be reproduced or distributed in any form for any purpose without the express written consent of Altus Group.
Author
Jennifer Nhieu
Senior Research Analyst
Resources
Latest insights