Canadian industrial market update - Q2 2026
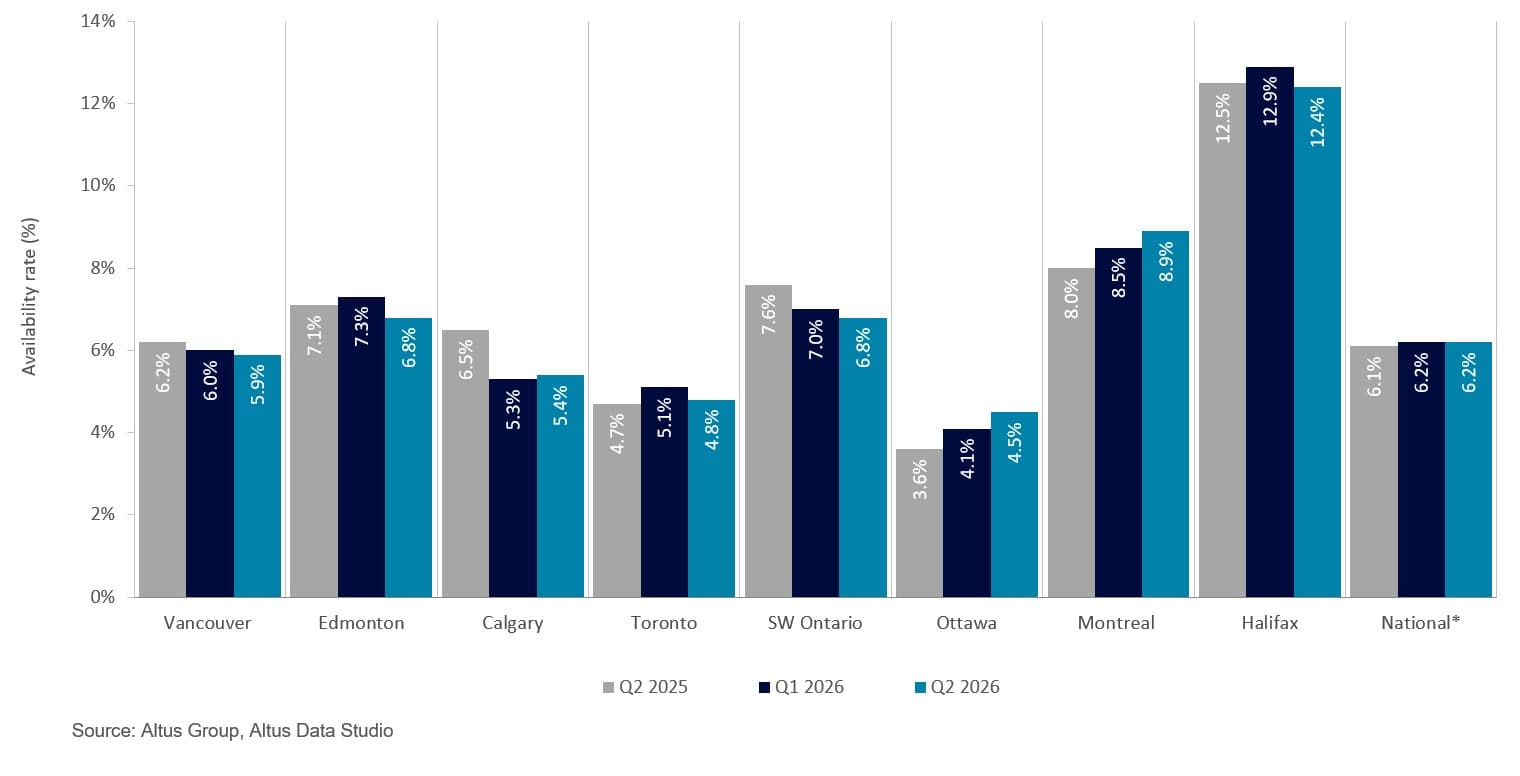
Canada's industrial availability rate hit 6.2% in Q2 2026, up 10 bps year-over-year, as cautious leasing and disciplined development defined the market.
Canadian industrial market update - Q2 2026
Canada's industrial availability rate hit 6.2% in Q2 2026, up 10 bps year-over-year, as cautious leasing and disciplined development defined the market.
Author

Jennifer Nhieu
Senior Research Analyst
Key highlights:
Source: Altus Data Studio market data and analysis
Canada’s national industrial availability rate increased by 10 basis points (bps) year-over-year to 6.2%
National construction completions saw an increase, with the delivery of 28 new industrial buildings adding approximately 3.5 million square feet to the national inventory, of which 46% remained uncommitted
National industrial construction pipeline comprised 117 active projects, representing an aggregate of 23.9 million square feet of future inventory, of which 56% remained available
Average national net asking rents stabilized in the $15.50 to $16.00 per square foot range, with older legacy inventory facing greater downward pressure than modern, high-specification facilities
The national industrial availability rate increased to 6.2% in the second quarter of 2026
Canada’s industrial real estate market was defined by disciplined development activity and a strategic divergence between institutional investors and corporate occupiers in the second quarter of 2026. While evolving global trade policies and the upcoming mandatory review of the Canada-United States-Mexico Agreement (CUSMA) remained key macroeconomic risks for the second half of the year, market participants had largely priced in this uncertainty. At the same time, end-user confidence continued to recover, supported by the need for supply-chain resilience and e-commerce optimization. As a result, the national industrial availability rate rose moderately year-over-year to 6.2% by quarter-end, according to market analysis conducted using data from Altus Data Studio.
Operational performance and rental dynamics
Operationally, the baseline metric rose by 10 basis points (bps) year-over-year, an incremental expansion that was primarily driven by a fundamental shift toward more deliberate and cautious leasing strategies. While the market continued to introduce new speculative builds that increased overall availability, the primary catalyst for the rising vacancy rate was the prolonged decision-making timelines and a risk-averse posture among occupiers. This widespread pivot away from rapid footprint expansion toward strategic consolidation and capital preservation created an environment where space remained on the market longer, outpacing near-term leasing velocity.
As a result of subdued occupier momentum, average national net asking rents trended downward before stabilizing in the $15.50 to $16.00 per square foot range. The downward pressure was heavily concentrated within older, legacy inventory featuring lower ceiling clear heights, where property owners were forced to lower asking rates significantly to compete for an increasingly selective pool of tenants. Conversely, modern, high-specification logistics facilities with superior clear heights experienced only marginal rental declines. This resilient pricing floor for top-tier assets was strongly supported by a persistent flight-to-quality trend, demonstrating that when cautious occupiers did commit to space, they prioritized operational efficiencies and premium infrastructure over nominal cost savings. Ultimately, this sustained demand for premium space allowed the market to form a stable pricing plateau and record its fourth consecutive quarter of positive net absorption.
Figure 1: Industrial availability (Q2 2025 vs. Q1 2026 vs. Q2 2026)
Regional performance and market disparities
Regional performance across Canada’s prominent industrial sectors revealed significant disparities during the second quarter of 2026, driven by an uneven concentration of persistent speculative deliveries, localized economic tailwinds, and shifting occupier consolidation strategies.
At the forefront of the major gateway corridors, Vancouver and Toronto experienced divergent trajectories, with availability rates settling at 5.9% and 4.8%, respectively. In Vancouver, heightened tenant retention and a moderation in new completions resulted in a 30 bps year-over-year decrease in availability. Conversely, Toronto observed a marginal 10 bps year-over-year increase. Rather than representing a volatile or unchecked disruption, these shifting figures indicated that both powerhouse markets had reached a structural stabilization plateau. This levelling-off reflected an environment where tenants elongated their procurement process to thoroughly vet operational efficiencies, while developers simultaneously throttled new project starts. This defensive posture effectively balanced the incoming delivery pipeline against deliberate, steadier leasing velocity, mitigating the steep vacancy escalations observed in prior periods.
Alberta’s major industrial hubs stood in stark contrast to the rest of the country, benefitting from a robust provincial economy, strong interprovincial population growth, and a surge in manufacturing and energy-related demand. In Calgary, the market demonstrated exceptional, nation-leading strength as its availability plummeted by 110 bps year-over-year to 5.4%. This significant decline was fueled by a scarcity of available options, particularly in the highly competitive small-to-mid bay segments, coupled with a highly disciplined local development pipeline that heavily favoured pre-leased or design-build projects over speculative risk. Meanwhile, the Edmonton industrial market tightened, with its availability rate decreasing by 30 basis points year-over-year to 6.8%. Edmonton’s performance was underpinned by a strong and steady baseline of leasing activity from logistics and industrial support services attracted to the region’s lower relative rental structures and less restrictive permitting processes, which effectively neutralized the cautious introduction of new speculative completions.
Moving into central Canada, performance dynamics shifted toward localized economic drivers and submarket variation. In Southwestern Ontario, the market observed an 80 bps year-over-year decline in availability, dropping to 6.8% despite being disproportionately exposed to ongoing cross-border trade uncertainties. This improvement was achieved through highly disciplined local supply management paired with a strategic shift in tenant positioning. The region’s structurally lower barrier to entry and deep manufacturing core allowed it to find an economic equilibrium much faster than Canada’s larger metropolitan areas. By maintaining a stable balance between incoming construction completions and reliable tenant demand, Southwestern Ontario insulated itself from the broader volatility seen across the national landscape.
Conversely, Montreal’s industrial availability rate climbed 90 bps year-over-year to 8.9%, a shift heavily driven by deliberate leasing behaviour and an ongoing influx of speculative supply. Geography and asset quality acted as the primary differentiators across the Montreal landscape. Inventory located on the Island of Montreal faced significant headwinds due to outdated infrastructure, insufficient clear heights, and high operational costs that failed to align with modern distribution and fulfillment criteria. In contrast, the South Shore and North Shore Laurentides established their position as preferred hubs for next-generation logistics regions, attracting tenants with larger land tracts and state-of-the-art technical specifications. Amid these structural realignments, net asking rents in Montreal remained flat, hovering within the $13.50 to $14.50 per square foot range for the thirteenth consecutive quarter.
Finally, Halifax maintained the highest availability rate among the industrial hubs at 12.4%, which represented a 10 bps year-over-year reduction and a notable decrease from its historic peak of 13.6%. Unlike regions where dynamics were dictated by rapid construction cycles, the vacancy pressures in Halifax stemmed from a subdued demand environment that struggled to digest existing inventory. As a smaller, thin market, Halifax remained highly sensitive to isolated tenant movements, where significant vacancies within specific submarkets, such as Bayers Lake, could skew regional data in a manner that would be statistically negligible in larger markets. This elevated vacancy environment was not a byproduct of speculative overbuilding or an active sublease market, but rather a structural delay in absorbing existing direct vacancies, marking a period of correction where physical goods consumption temporarily disconnected from the region’s strong population growth.
National supply dynamics and inventory trends
National supply dynamics recorded a minor acceleration in construction completions during the second quarter, as the delivery of 28 new industrial buildings injected approximately 3.5 million square feet into the national inventory (Figure 2). Reflecting a broader market trend environment defined by cautious, elongated corporate transaction cycles, 46% of this newly delivered space remained unleased and available at the close of the quarter. This friction between fresh speculative supply and selective footprint optimization continued to dictate submarket availability metrics across Canada’s economic centres.
Figure 2: Industrial completions and availability (Q2 2026)
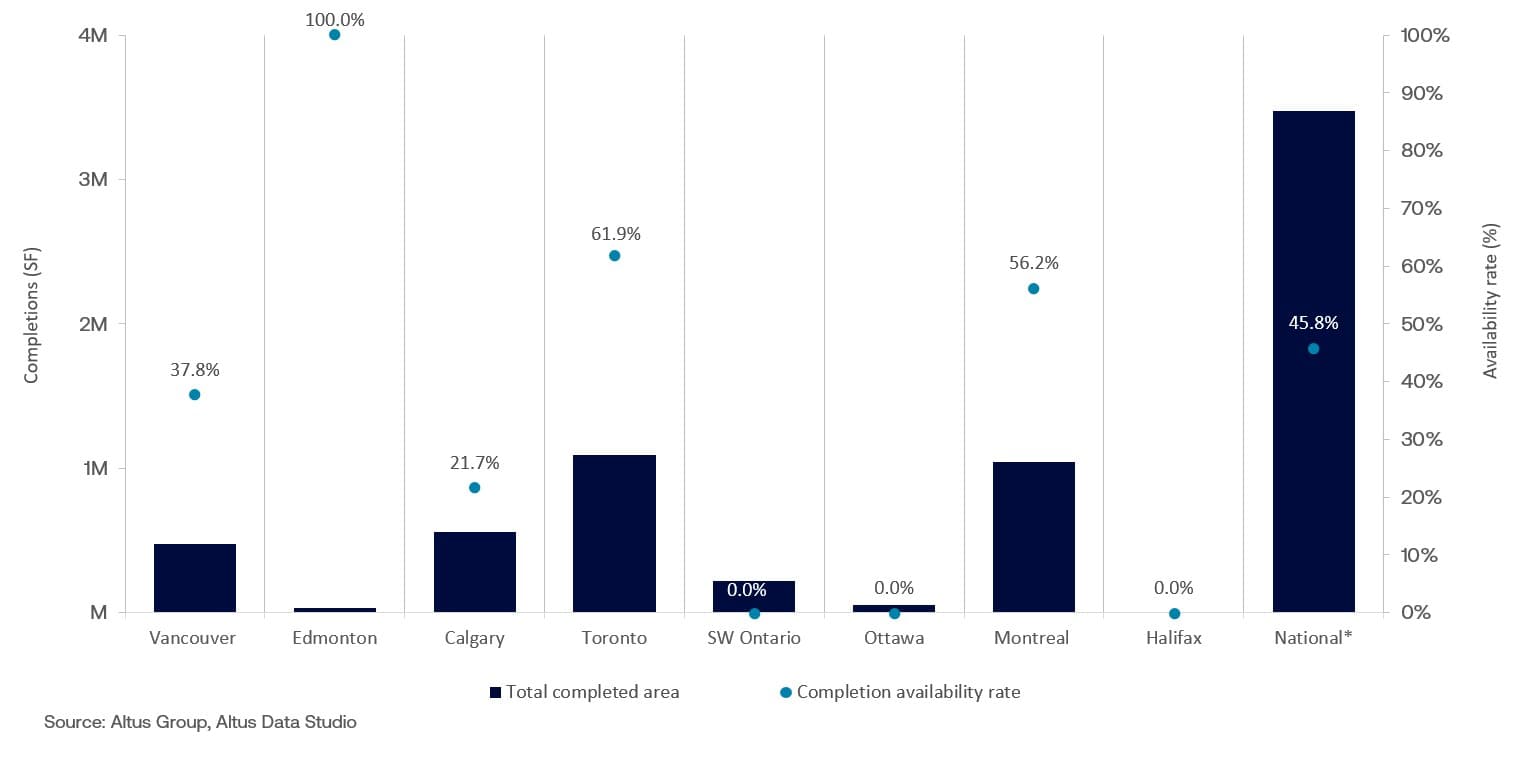
The Greater Toronto Area (GTA) reported a constrained pipeline with only seven industrial completions during the second quarter of 2026, totalling nearly 1.1 million square feet. Despite this diminished output relative to historic peaks, nearly 62% of this newly added space remained available for lease at quarter-end. This elevated vacancy concentration among new deliveries underscored the reality that the market continued to work through a substantial volume of uncommitted inventory, as occupiers prioritized internal consolidation over expansion.
In contrast, Southwestern Ontario maintained a highly disciplined supply strategy, delivering only two large-bay, built-to-suit buildings that totalled approximately 218,000 square feet. The region intentionally shifted away from the rapid pre-leasing frameworks common in the immediate post-pandemic period. Instead, institutional developers aligned a manageable delivery schedule with a highly selective tenant base, effectively insulating the local market from the supply-driven volatility observed in larger neighbouring metropolitan areas.
On the West Coast, Vancouver recorded eight completions totalling approximately 478,000 square feet, with 38% of the space still available for lease. Small- to mid-bay projects continued to shape the local market landscape, as geographic and land constraints severely limited the development of larger logistics footprints. A notable exception to this localized trend was 31270 Hamilton Place in Mission, a 216,000-square-foot building, featuring 36-foot clear heights and built-to-suit office space, reflecting the persistent occupier demand for high-specification infrastructure even in outlying submarkets.
Meanwhile, Montreal recorded seven completions totalling 1 million square feet, with 56% of this recently delivered space remaining unleased. Comprising primarily industrial condominium and large-bay, multi-tenant facilities, these high vacancy levels highlighted a structural mismatch on the Island of Montreal, where tenant requirements shifted rapidly toward next-generation distribution hubs while speculative pipeline projects struggled to secure immediate commitments.
Further west, Calgary’s industrial market continued to display robust fundamentals, recording three completions totalling 558,000 square feet. Underscoring strong provincial demand and swift absorption capacity relative to the rest of Canada, nearly 22% of this newly delivered space was available for lease at quarter-end. This relatively low vacancy exposure for new inventory reinforced Calgary’s position as a preferred destination for regional distribution networks.
National industrial construction pipeline
The national industrial construction pipeline comprised 117 active projects, representing nearly 23.9 million square feet of future inventory (Figure 3). Pre-leasing activity for these ongoing developments has moderated such that availability was approximately 56%, as tenants remain cautious in their leasing decisions.
Figure 3: Industrial under construction and availability (Q2 2026)
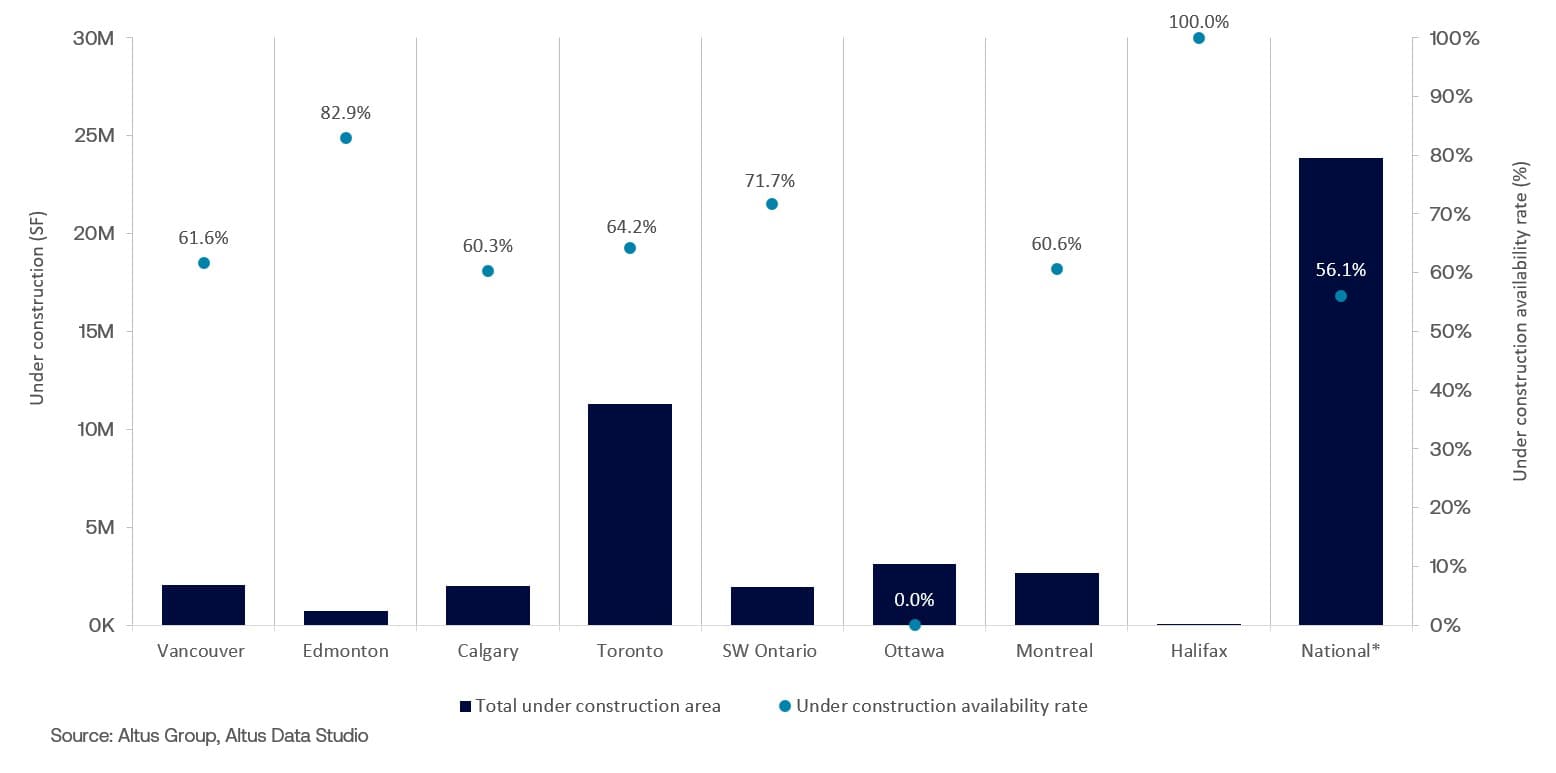
The GTA retained its status as the nation’s primary industrial hub, with 39 projects totalling 11.3 million square feet remaining under construction, of which nearly 64% was uncommitted. This elevated volume of unleased pipeline space highlighted a persistent reliance on speculative models, sustained by institutional optimism for mid-term demand recovery. Active construction remained concentrated in modern Class A logistics facilities, driven by the expectation that top-tier assets featuring superior technical specifications would be best positioned to capture corporate interest as macroeconomic conditions improved.
The Vancouver development pipeline comprised 25 industrial buildings, totalling nearly 2.1 million square feet, with 62% of this space remaining available. This volume represented a significant contraction in active project commitments, particularly within the large-bay segment, as developers hesitated to break ground without secured pre-leasing agreements.
Calgary’s development landscape mirrored this shift toward capital preservation and supply discipline as the active construction pipeline contracted to 13 projects totalling approximately 2 million square feet, with 60% of this space remaining available. This signalled a deliberate transition toward supply-side discipline following a multi-year period of rapid, speculative expansion. Conversely, Edmonton saw an increase in development activity with seven speculative projects totalling 701,000 square feet, of which 83% remained available for lease, providing relief to the supply-constrained market.
Further east, Ottawa’s industrial supply pipeline remained anchored by Amazon’s 3.1 million square foot fulfillment centre in Barrhaven. Once complete, it will be Amazon’s third fulfillment centre in Ottawa and the largest facility of its kind in Canada. This monumental delivery reinforced a long-term corporate commitment to regional distribution infrastructure, solidifying Ottawa’s critical role as a core logistics node situated between the Toronto and Montreal corridors.
Meanwhile, Montreal’s development pipeline demonstrated sustained resilience, with 13 buildings totalling nearly 2.7 million square feet under construction, concentrated primarily within the North Shore Laurentides and Laval regions. Although 61% of this pipeline remained unleased, institutional developers continued to exhibit long-term confidence in the region’s structural requirement for modern infrastructure. However, three years of primarily negative net absorption left a substantial volume of uncommitted speculative space, maintaining steady upward pressure on regional availability metrics.
Navigating future market dynamics
Looking ahead to the second half of 2026, Canada’s industrial market is expected to continue realigning from the aggressive pricing and rapid valuation growth of prior cycles toward a more yield-focused, fundamentals-driven environment. Although short-term pricing adjustments and elevated availability persist, investor confidence remains supported by the sector’s long-term strategic importance. Many major market participants view the current stabilization period not as a broad contraction, but as an opportunity to allocate capital selectively to resilient gateway markets and emerging distribution nodes.
Acquisition activity is likely to remain highly selective, with institutional investors prioritizing modern, high-specification assets that support stable income and reduce exposure to functional obsolescence. While lenders remain cautious, stabilizing net asking rents are helping narrow bid-ask spreads and could support a gradual recovery in transaction activity. Going forward, the balance between a measured development pipeline and deliberate occupier decision-making will be a key indicator of investment risk. Regions with disciplined supply growth and sustained demographic momentum, particularly in major Western and Central Canadian corridors, are expected to be best positioned to attract domestic and international institutional capital and support the market’s next growth cycle.

Want to be notified of our new and relevant CRE content, articles and events?
Disclaimer
This publication has been prepared for general guidance on matters of interest only and does not constitute professional advice or services of Altus Group, its affiliates and its related entities (collectively “Altus Group”). You should not act upon the information contained in this publication without obtaining specific professional advice.
A number of factors may influence the performance of the commercial real estate market, including regulatory conditions and economic factors such as interest rate fluctuations, inflation, changing investor sentiment, and shifts in tenant demand or occupancy trends. We strongly recommend that you consult with a qualified professional to assess how these and other market dynamics may impact your investment strategy, underwriting assumptions, asset valuations, and overall portfolio performance.
No representation or warranty (express or implied) is given as to the accuracy, completeness or reliability of the information contained in this publication, or the suitability of the information for a particular purpose. To the extent permitted by law, Altus Group does not accept or assume any liability, responsibility or duty of care for any consequences of you or anyone else acting, or refraining to act, in reliance on the information contained in this publication or for any decision based on it. The distribution of this publication to you does not create, extend or revive a client relationship between Altus Group and you or any other person or entity. This publication, or any part thereof, may not be reproduced or distributed in any form for any purpose without the express written consent of Altus Group.
Author
Jennifer Nhieu
Senior Research Analyst
Resources
Latest insights






Sep 10, 2026