Canadian office market update – Q3 2026
Canadian office market update – Q3 2026
Authors

Jennifer Nhieu
Senior Research Analyst
Key highlights:
The national office availability rate declined by 110 basis points (bps) year-over-year to 15.1%, driven by demand for premium office space and a significant reduction in new construction
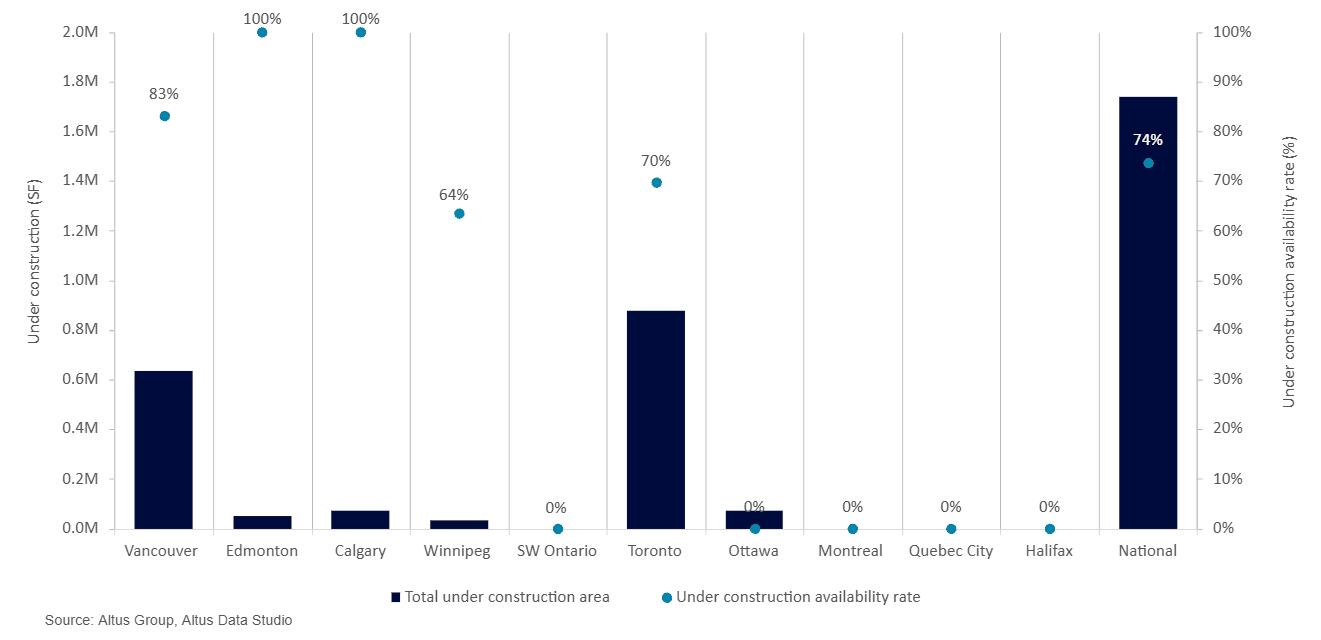
The national office construction pipeline was near a historic low, with 1.7 million square feet under construction and 74% of the space pre-leased
Limited new supply tightened the availability of large, contiguous blocks of premium office space, increasing competition for Class A assets and placed upward pressure on prime asking rents
National office availability declined to 15.1% in the third quarter
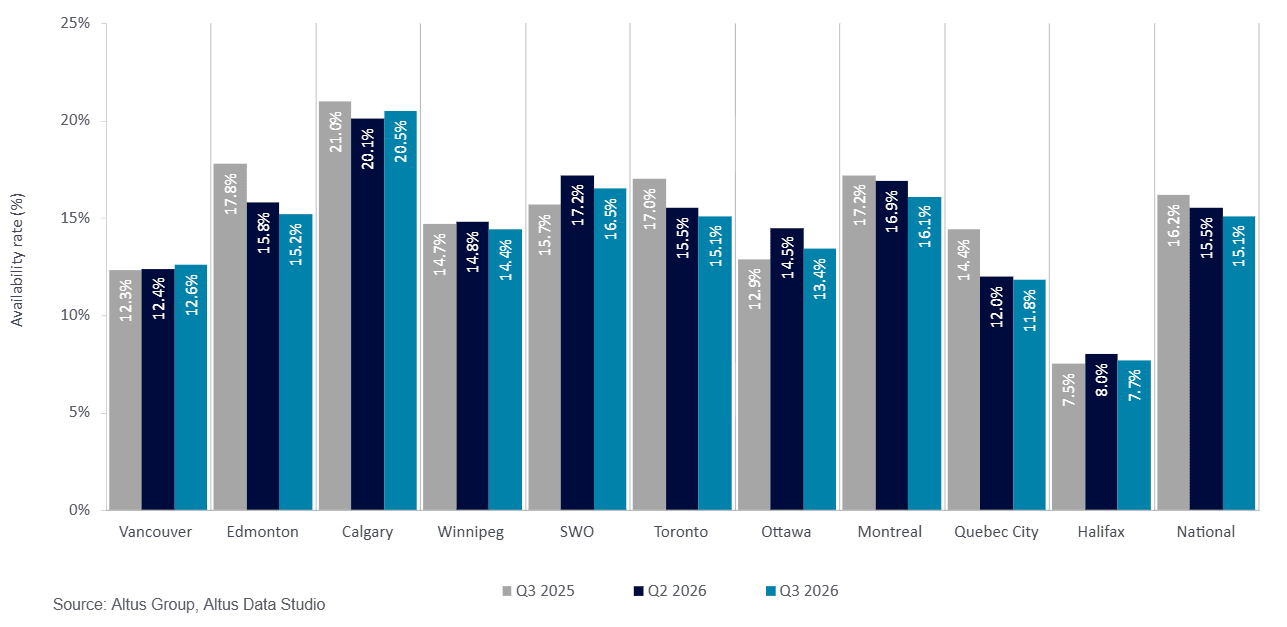
By the third quarter of 2026, the Canadian office market remained on a path of structural recovery. National availability fell by 110 basis points year-over-year to 15.1% as positive absorption persisted across primary markets (Figure 1). Broader return-to-office (RTO) mandates across corporate and government organizations also stabilized downtown activity and gave occupiers greater clarity for longer-term space planning.
Demand remained concentrated in top-tier office assets as occupiers prioritized high-quality space suited to hybrid work. This preference reduced availability in prime buildings and normalized sublease inventories. Older Class B and C assets continued to face utilization challenges, although limited new deliveries, along with conversions to alternative uses, reduced obsolete supply. Together, these supply constraints sustained competitive conditions across major metropolitan centres.
Figure 1: Office availability rate (Q3 2024 vs. Q3 2025 vs. Q3 2026)
Employment and the office market
In August 2026, Canada’s labour market showed little monthly improvement, with the national unemployment rate holding at 6.4%. Year-over-year employment rose by 217,000 (+1.0%), led by private-sector growth of 156,000 (+1.1%), while public-sector employment fell by 78,000 (-1.7%) amid workforce reductions across governments. Sector performance was mixed: employment increased in health care and social assistance, information, culture and recreation, and transportation and warehousing; wholesale and retail trade recorded the largest decline.
By the end of the third quarter, office usage had stabilized despite slower employment growth and changes in employment composition. RTO requirements, first led by major financial institutions and later reinforced by expanded federal directives in the spring and summer, established a more reliable base of office demand. As fully remote arrangements gave way to structured hybrid and near-full-time schedules, occupiers gained greater confidence to resume longer-term space planning. Interprovincial workforce migration toward lower-cost hubs also supported localized employment resilience and office utilization.
National and major market performance
Major Canadian office markets delivered mixed results in the third quarter of 2026. Core financial centres recorded positive net absorption, while markets with excess supply continued to report elevated availability in Class B and C buildings. National conditions nevertheless improved as Class A leasing demand outpaced new construction deliveries and the release of sublease space.
Halifax recorded Canada’s lowest office availability rate at 7.7%, supported by strong demographic and economic fundamentals. International immigration remained the main source of workforce growth, offsetting slower interprovincial migration, while relatively low unemployment and stricter RTO mandates sustained leasing demand and elevated midweek physical workplace utilization. At the end of the quarter, expansions in federal defence spending and regional procurement were expected to support recruitment, attract defence suppliers and increase space requirements in downtown and suburban submarkets.
Calgary recorded Canada’s highest office availability rate at 20.5%, reflecting both persistent excess supply despite the city’s long-term efforts to renew and rationalize its downtown inventory. Supported by sustained interprovincial migration from cost-burdened primary markets, the municipality leveraged its Downtown Office Conversion Program, formerly the Downtown Development Incentive Program, to convert underused offices into residential, hotel and mixed-use properties. By the third quarter of 2026, the municipality had approved 21 projects designed to remove approximately 2.68 million square feet of office space and create 2,667 residential units and 226 hotel rooms.
Vancouver’s office availability rate rose by 30 bps year-over-year to 12.6% but remained within the 12% to 13% range recorded over the previous three years. High housing costs and federal caps on temporary resident visas slowed top-line regional population growth, prompting tech and professional firms to pivot toward talent retention rather than rapid headcount growth. Strong pre-leasing in recently completed projects limited the accumulation of vacant space despite continued deliveries. At the end of the third quarter, few additional completions were anticipated during the remainder of 2026. In response, occupiers planned for tighter supply while accommodating peak-day hybrid attendance.
Ottawa’s availability rate rose by 50 bps year-over-year to 13.4%, largely because of federal government space rationalization and property surrenders. Stronger private-sector demand for Class A space, supported by expanded multi-day RTO directives, partly offset the reduction in public-sector occupancy. After five consecutive quarters of negative net absorption, the market recorded 234,000 square feet of positive net absorption, providing an early indication of improving demand.
Toronto’s availability rate fell by 190 bps year-over-year to 15.1%, supported by sustained demand for premium space in downtown and midtown. Class A availability declined to 11.2% downtown and 14.1% in midtown, down 390 and 730 bps year-over-year, respectively. Market participants attributed the momentum to strict, multi-day RTO mandates from financial institutions and government bodies. Fewer construction completions also supported the recovery by limiting new large, contiguous blocks of space. As of the third quarter, market participants expected little near-term supply. Meanwhile, the average direct gross asking rent for Class A space in Downtown Toronto had increased to $60.72 per square foot.
Montreal’s availability rate fell by 110 bps year-over-year to 16.1%, supported by 651,000 square feet of positive net absorption in the third quarter, primarily in Downtown Montreal. Office-to-residential conversions also reduced obsolete commercial inventory, including the Du Canal retrofit and major mixed-use redevelopments at the former Molson Brewery and Radio-Canada/CBC sites. Together, continued leasing and the removal of older space strengthened overall market fundamentals.
Quebec City’s availability rate fell by 260 bps year-over-year to 11.8%. Unlike the broader national market, the city showed a less pronounced flight-to-quality trend. Occupiers favoured affordable Class B space, reducing availability in that segment to 9.9%, compared with 14.3% for Class A space. This pattern reflected local demand for smaller, flexible spaces, lower occupancy costs and accessible suburban locations with ample parking, rather than downtown trophy assets.
National office completions and new supply dynamics
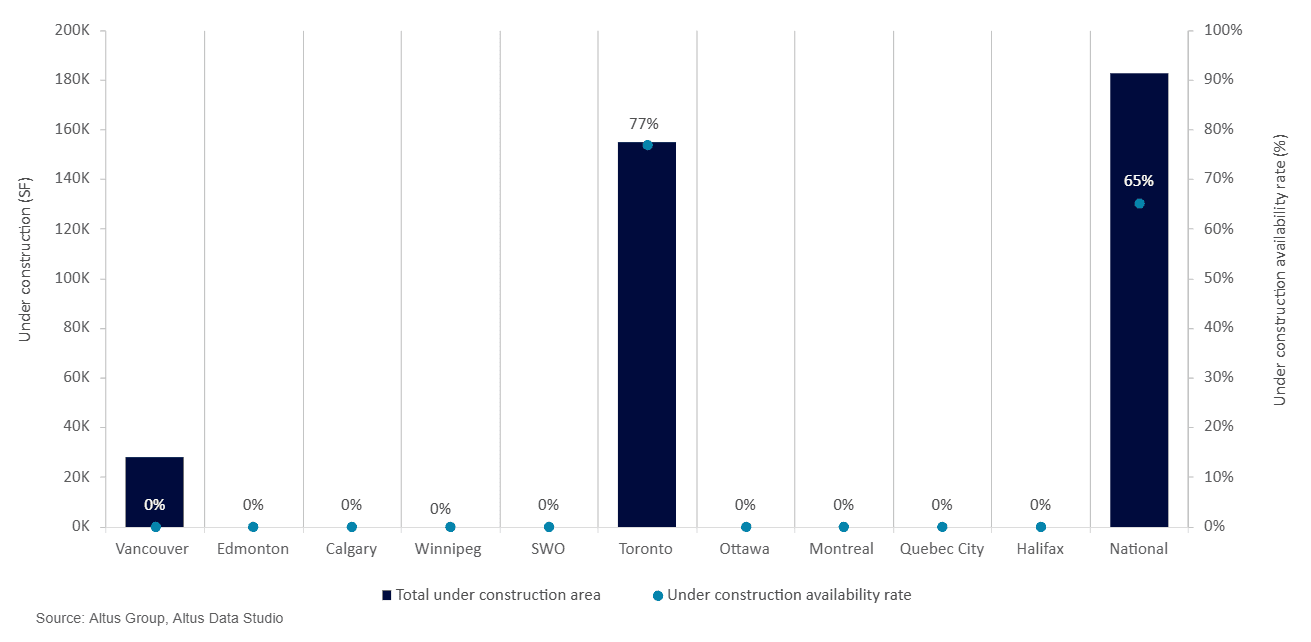
Canada recorded three office completions in the third quarter: the fully leased, 27,790-square-foot Claridge Square at Oakridge in Vancouver’s Oakridge neighbourhood; the fully leased, 35,682-square-foot Concord Canada House in Toronto’s Downtown South; and the fully vacant, nearly 119,000-square-foot office component at 5250 Yonge Street in Toronto’s North Yonge submarket (Figure 2).
The completion of 5250 Yonge Street resolved a court-ordered receivership following the developer’s default on more than $185 million in construction debt. Although the project was completed under court supervision to stabilize the asset, receivership-related operational disruptions left the property fully unleased at delivery, making it an exception to the otherwise fully leased completions recorded during the quarter.
Overall, limited new supply supported the ongoing absorption of existing inventory and contributed to the broader decline in national availability.
Figure 2: Office completions and availability (Q3 2026)
National office construction pipeline
The national office construction pipeline shrank to 20 buildings totalling 1.7 million square feet (Figure 3), of which 74% was available for lease. Vancouver and Toronto continued to anchor development activity. Vancouver’s nine projects totalled approximately 633,000 square feet, with 83% of the space available, while Toronto’s seven projects comprised nearly 877,000 square feet, with 70% available.
The shrinking development pipeline reduced options for occupiers seeking large, contiguous blocks of premium space. As Class AAA availability tightened, demand shifted to well-positioned Class A properties and, in secondary markets, to Class B space, increasing occupancy and reducing vacancy in existing buildings. Consequently, the sector continued to shift from ground-up development toward retrofits and upgrades that aligned older assets with modern workplace requirements.
Figure 3: Office under construction and availability (Q3 2026)
Looking ahead
By the end of the third quarter, the Canadian office market had entered a supply-constrained phase. With the national construction pipeline near historic lows and few near-term deliveries anticipated, available Class A inventory continued to contract despite a modest increase in project starts. Competition for premium space intensified, strengthening the position of owners and placing upward pressure on prime net asking rents. These conditions indicated that occupiers seeking large, contiguous blocks of high-quality space will need to begin space planning earlier.
Improving office fundamentals supported investor confidence and market liquidity. Investment volumes continued to rise as well-capitalized private and institutional buyers returned, attracted by stabilized interest rates and asset valuations. Capital deployment nevertheless remained selective and mirrored the split in leasing demand: investors prioritized Class AAA and other premium assets with durable cash flows, while evaluating secondary Class B and C properties primarily for redevelopment, conversion or demolition. At the end of the quarter, investors continued to view constrained supply as an important source of long-term value.
Authors
Jennifer Nhieu
Senior Research Analyst
Resources
Latest insights