
Leverage our real estate data and predictive analytics
The performance attribution, predictive analytics and market intelligence you need to explain performance and improve decision making.
The Altus Pan-European property dataset saw values come to a standstill in the third quarter of 2026, with overall appreciation at 0.0%. This brings a pause to the recovery in values that began in Q3 2024, following eight consecutive quarters of positive appreciation. The loss of momentum has been playing out during 2026, with quarterly appreciation slowing from 0.6% in Q1 to 0.3% in Q2 and 0.0% in Q3.
Figure 1: Quarterly appreciation – all property
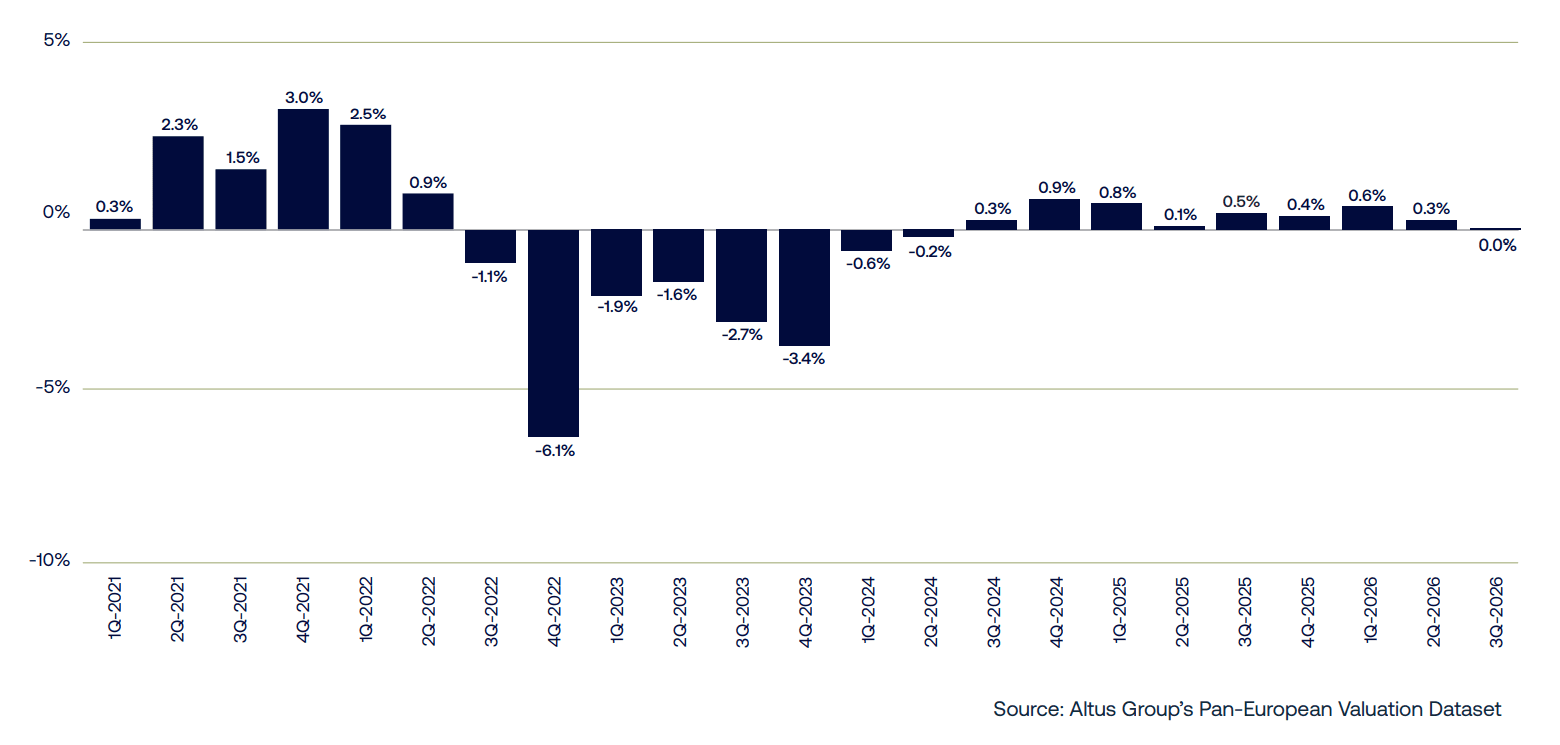
Figure 2: Quarterly appreciation attributes – all property
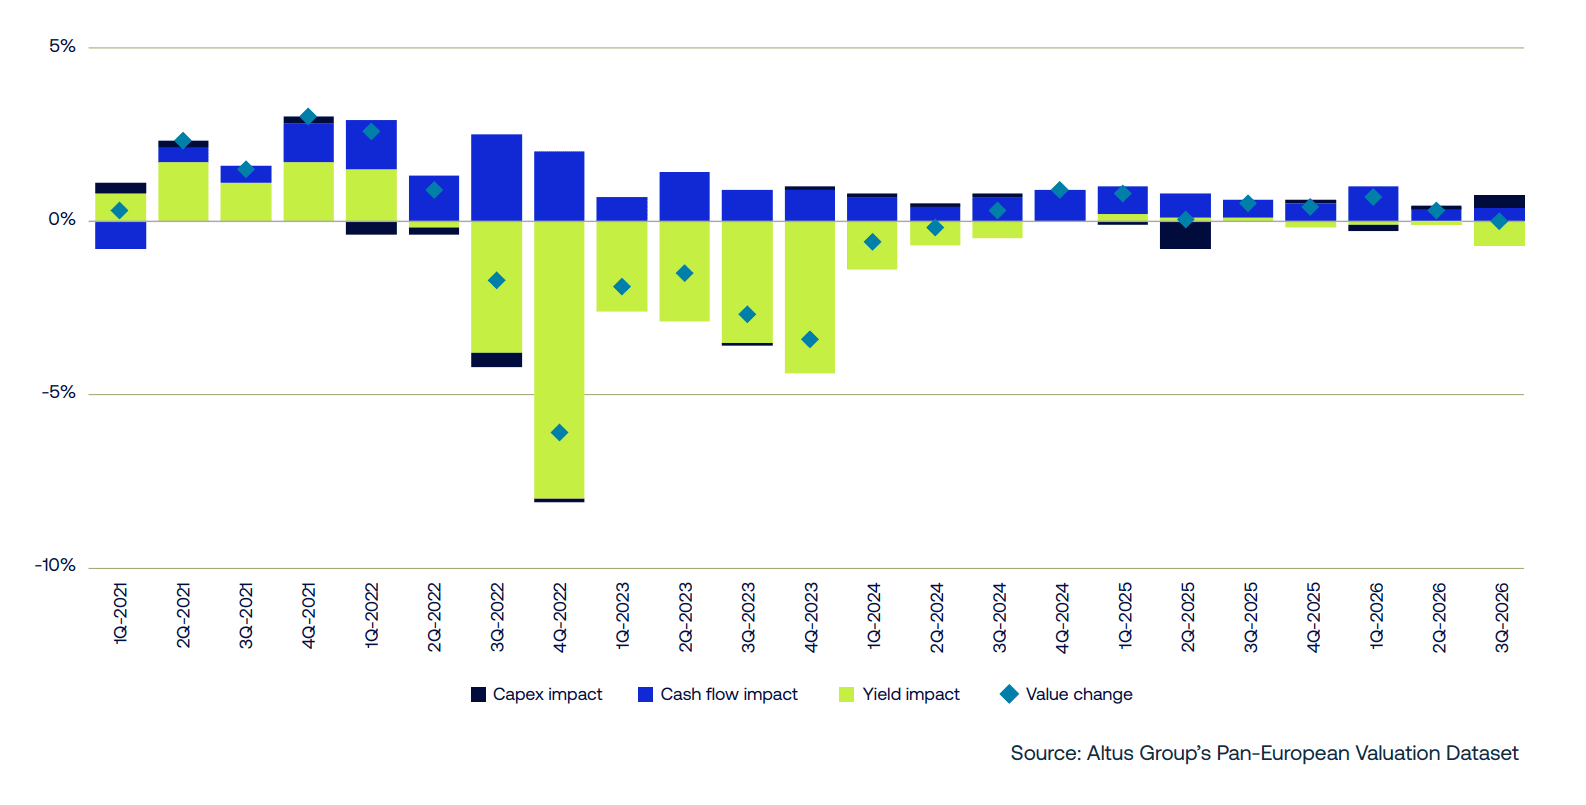
Against a backdrop of increased interest rates, yields have now become the dominant factor in the valuation narrative. The outward movement in valuation yields was the main constraint on values in Q3, with a -0.7% impact. This more than offset the +0.3% contribution from cashflow fundamentals, their influence having moderated considerably from earlier in the recovery period.
Changes in capital expenditure assumptions also had a positive +0.3% impact, leaving overall values unchanged for the quarter. From a returns standpoint, however, actual expenditure would have offset this benefit, resulting in a negative return on appreciation for the quarter.
Breakdown of value movements
Figure 3: Q3 2026 | Breakdown of sector quarterly value movements
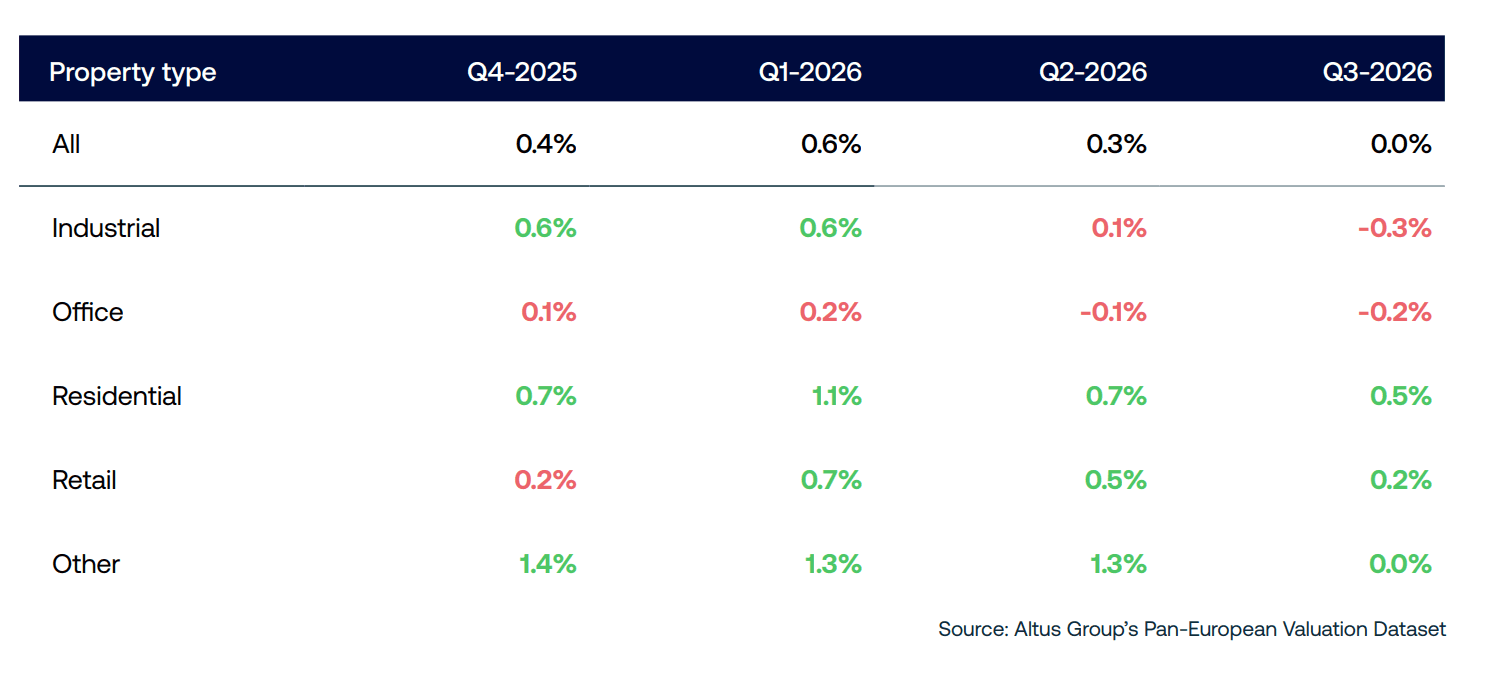
Figure 4: Q3 2026 | Breakdown of Q3 value movements
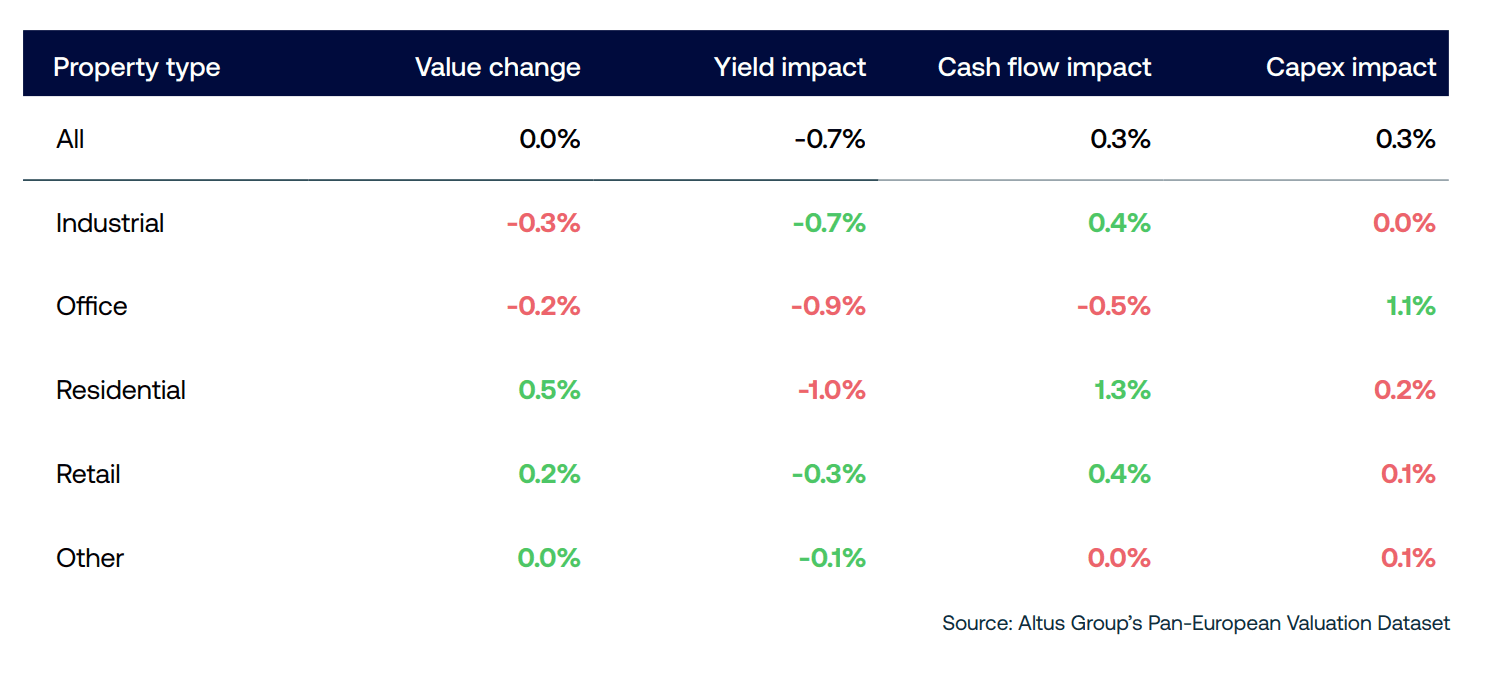
Figure 5: Q3 2026 versus Q3 2025 | Breakdown of 1 year value movements
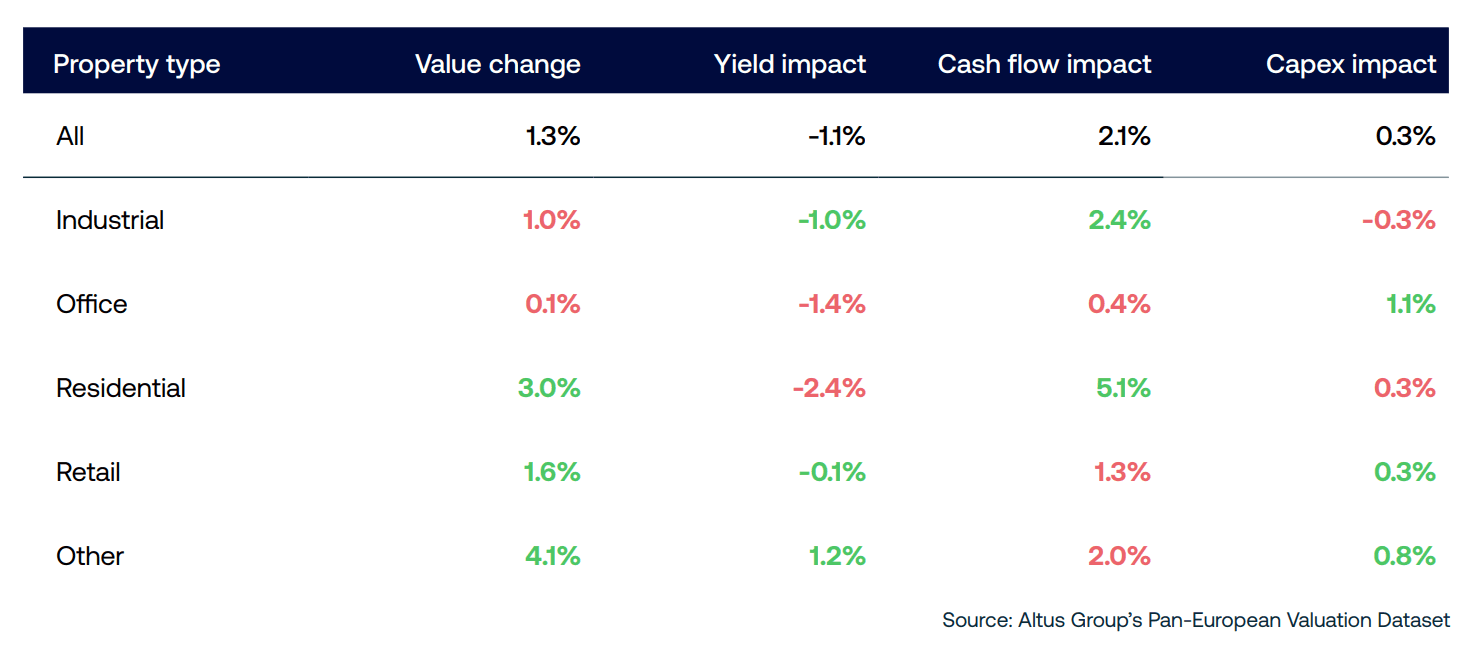
Figure 6: Q3 2026 versus Q3 2023 | Breakdown of 3-year value movements
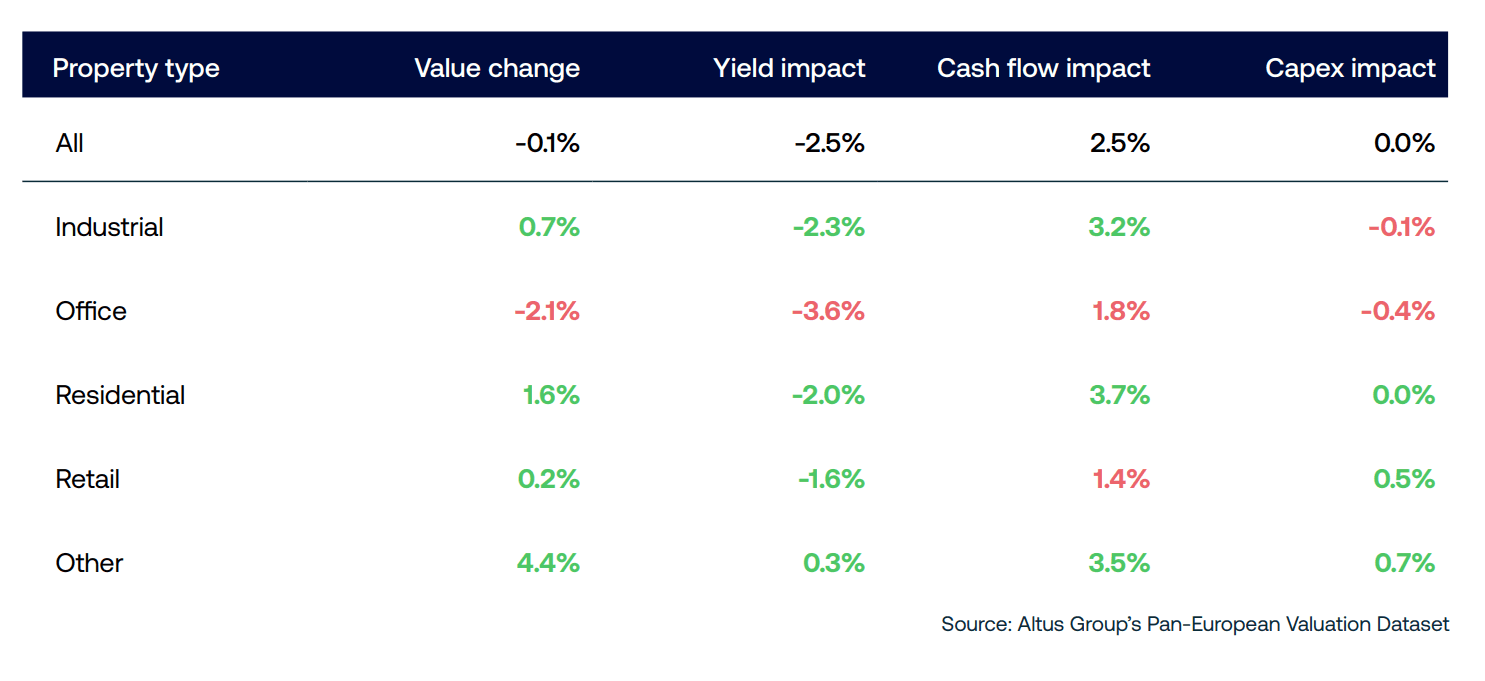
Sector trends
In a quarter where a negative impact from yield adjustments became more prominent across all sectors, overall performance weakened for each property type in Q3, although with a mixed set of outcomes. Residential remained a top performer, with values up 0.5%. Retail also remained in positive territory, with gains of 0.2%. In contrast, industrial values moved into decline, falling 0.3%, while office values declined by a further 0.2%. Within the other property grouping, student accommodation moved from the top to the bottom of the standings, with values declining 0.8%.
Industrial
Q3 marked a step change for industrial as values declined by 0.3%, having remained consistently positive through the prior two-year recovery period. Cashflows remained accretive, contributing 0.4% to values, but this was more than offset by a -0.7% yield impact for the quarter.
Underlying rental fundamentals remained positive but softened. Contract rents increased 1.2%, but market rent growth slowed to just 0.1%. Occupancy remained comparatively high at 94.3%, despite declining by 0.6% during the quarter.
An increased number of markets experienced some write-down in values in Q3, with the three largest regions - Germany, France, and the Netherlands - among the worst affected. These markets, along with the UK, were adversely impacted by outsized yield increases. Where values held up for the quarter, yields generally remained more stable. Spain led on the upside, with values rising by 0.8% supported by a 0.8% cashflow effect, with occupancy levels having risen over the quarter by more than 5%, and in-place rents having increased by over 4%.
Office
Office remained a sector in decline, with values falling a further 0.2%, having been written down by 0.1% in each of the prior quarters of 2026. Unlike the industrial sector, both yield (-0.9%) and cashflow (-0.5%) effects put downward pressure on values. This was in part mitigated by a reduction in future capital expenditures being modelled in valuations. Office occupancy remains materially below the other main sectors at 85.0%, despite improving slightly during Q3. Market rents were essentially unchanged at +0.02%; with increased operating expenses and reduced growth rate assumptions, the overall cashflow effect turned negative in Q3.
Despite the overall downturn, there is still a dispersion of results across the markets, with a large part of the value decline centered in Germany. France, which had previously proved more resilient, also turned negative in Q3. Germany remain furthest adrift from a cashflow standpoint, and is the one office market where both in-place and market rents are down over the year. On the upside, Spain continues to register improving values with yields remaining stable and cashflows strengthening, supported by an above-average 2.5% increase in contract rents.
Residential
Residential sustained its position as the strongest performer of the four main sectors, with values rising 0.5% in Q3. Appreciation has nevertheless slowed from 1.1% in Q1 and 0.7% in Q2. Cashflow remained the principal source of resilience, adding 1.3% to values and more than compensating for a -1.0% impact from outward yield movements. This was the leading sector from a cashflow standpoint, having registered above-average increases in both market rent (up 0.4%) and contract rent growth (up 1.0%) during Q3.
Notably, residential values continued to rise in all reported markets. Netherlands and Sweden maintained their standing at the top end of the order, with values increasing by 1.2% and 1.3%, respectively. The Netherlands recorded an exceptional 7.1% cashflow contribution, supported by leading increases in both market and contract rents alongside strong inflation-linked indexation. However, much of this benefit was offset by a -5.8% yield impact, as valuers applied a significant degree of caution to the improving cashflow fundamentals. The gains in Sweden are more a direct result of capital being spent on the assets during the quarter.
Retail
Retail values remained on an upwards trajectory in Q3, increasing 0.2%, although the pace of improvement continued to moderate from 0.7% in Q1 and 0.5% in Q2. Cashflow added 0.4% to values, which was sufficient to overcome a -0.3% yield impact.
Yield movements played a key role in opening up variances between retail subtypes. Retail warehouse yields moved inwards, helping this segment to re-establish itself as the best performing subtype, with values up 0.9%. This contrasts with high street retail, where outward yield movement effectively took 1.3% off values over the quarter.
In summary, Q3 represents a pause in momentum rather than, as yet, a renewed broad-based correction. The cashflow improvements that have driven the recovery remain positive at an aggregate level, but their contribution has moderated significantly, leaving values increasingly exposed to changes in valuation yields. Industrial has now joined office in negative territory, while residential and retail continue to provide positive appreciation.
The next phase of the cycle will consequently depend on whether further outward yield movements continue, and whether underlying rental and occupancy fundamentals remain sufficiently strong to support cashflow growth. For the moment, the Pan-European market appears to have moved from a broad but gradual recovery into a more fragmented phase, where sector and country-level fundamentals are becoming increasingly important to performance.
Sector and country appreciation spreads
Figure 7: Q3 2026 | Quarterly sector country appreciation spreads
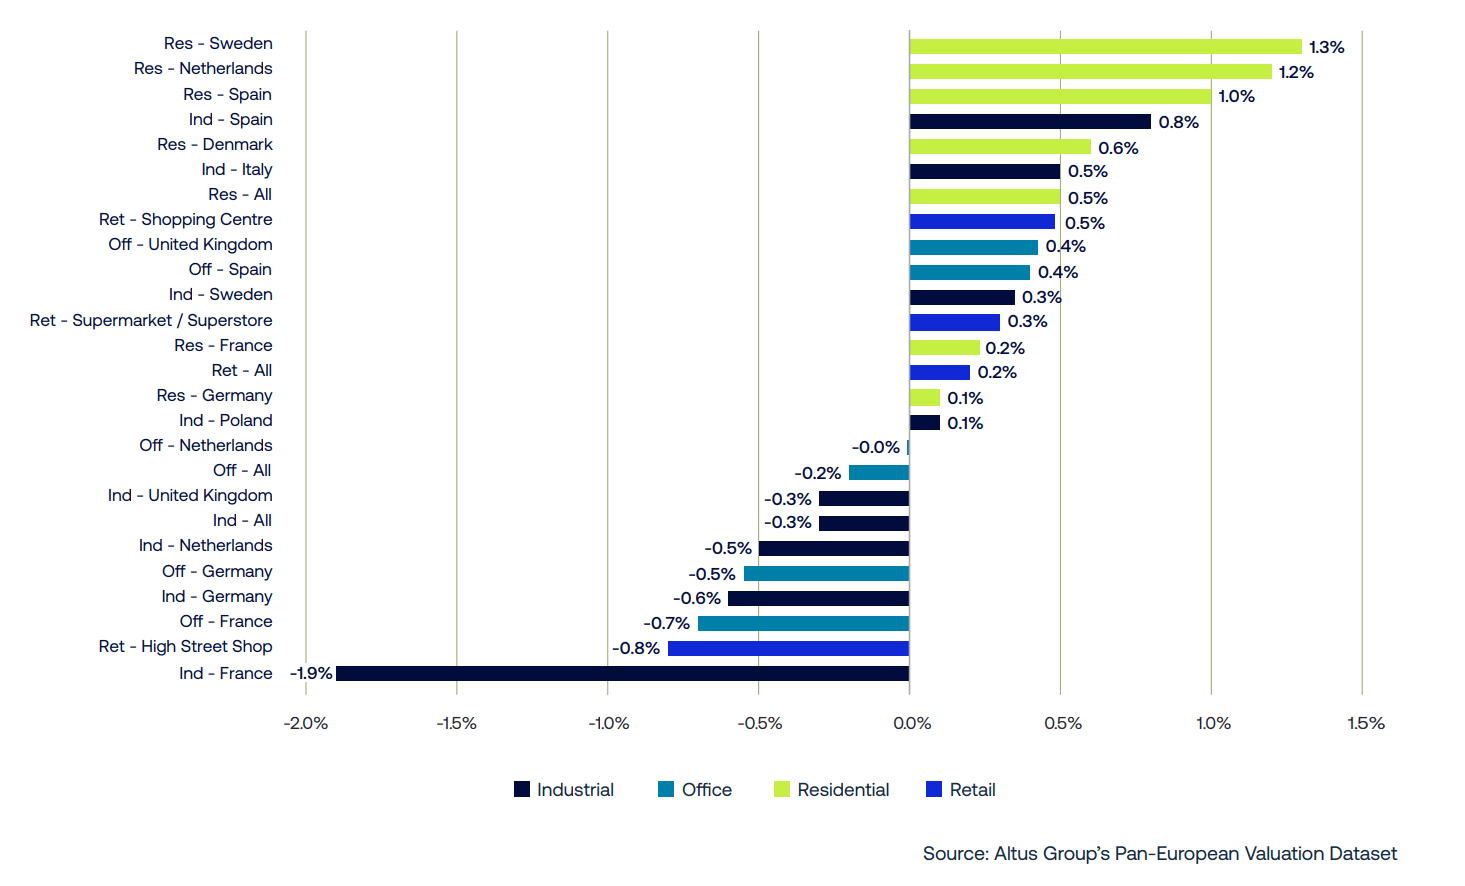
Figure 8: Q3 2026 | Impact metrics – by sector and country
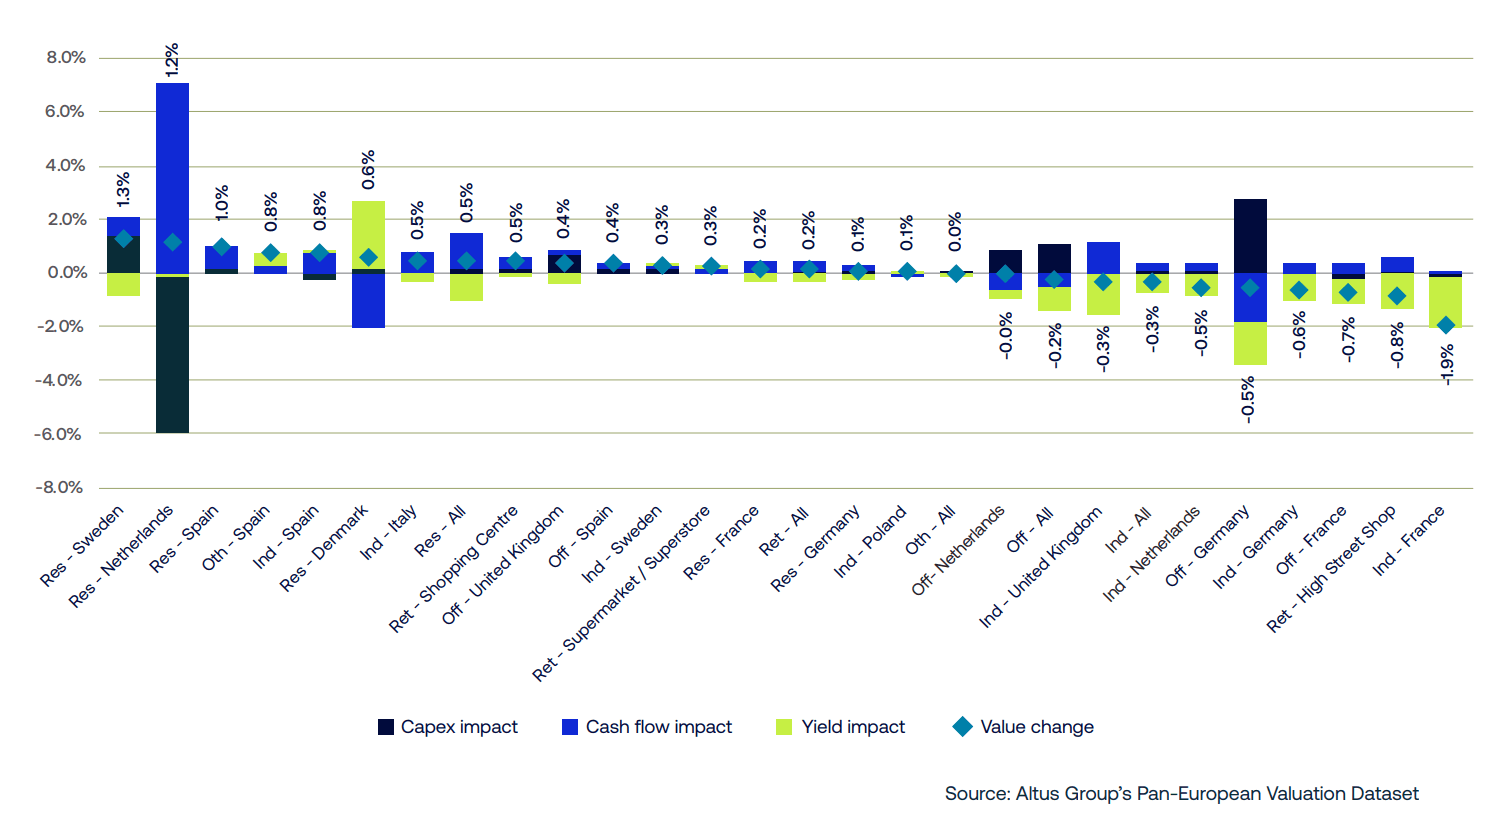
Figure 9: Q3 2026 versus Q3 2025 | Annual sector country appreciation spreads
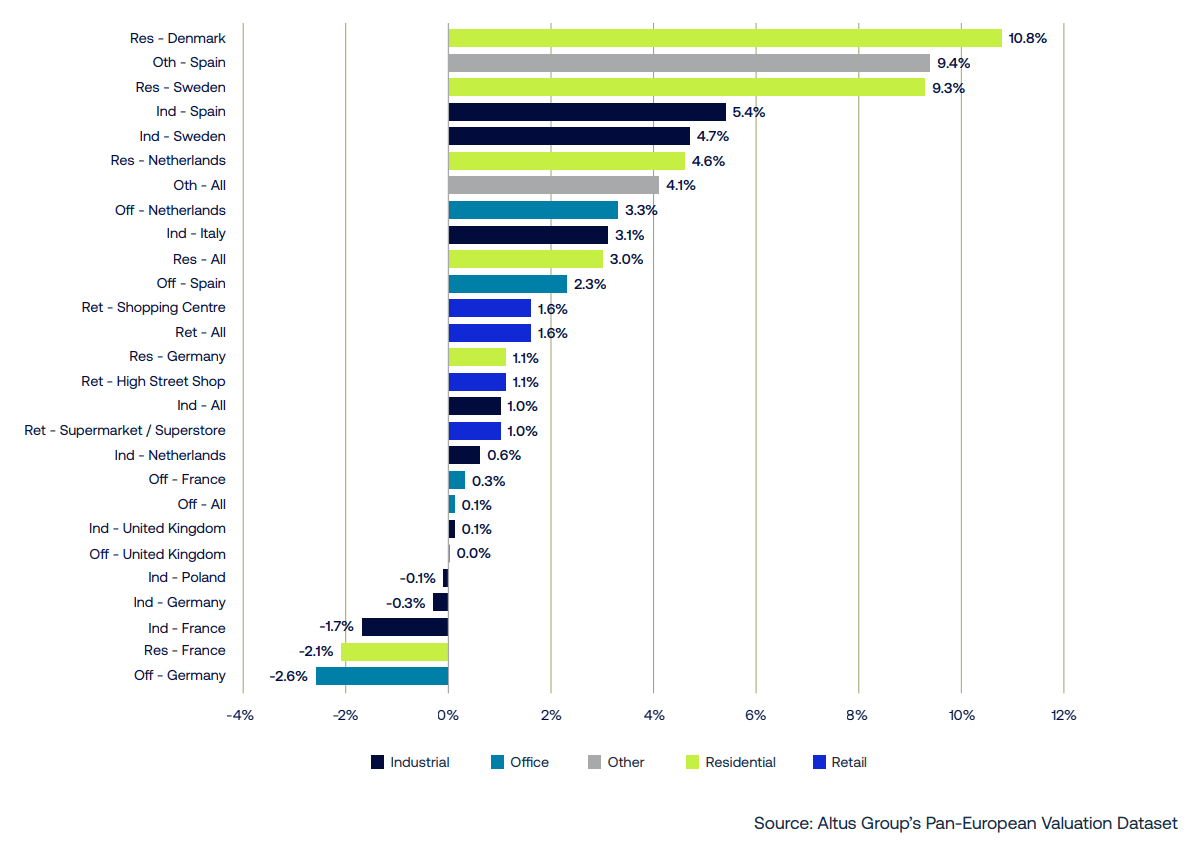
Figure 10: Q3 2026 versus Q3 2025 | Impact metrics – by sector and country
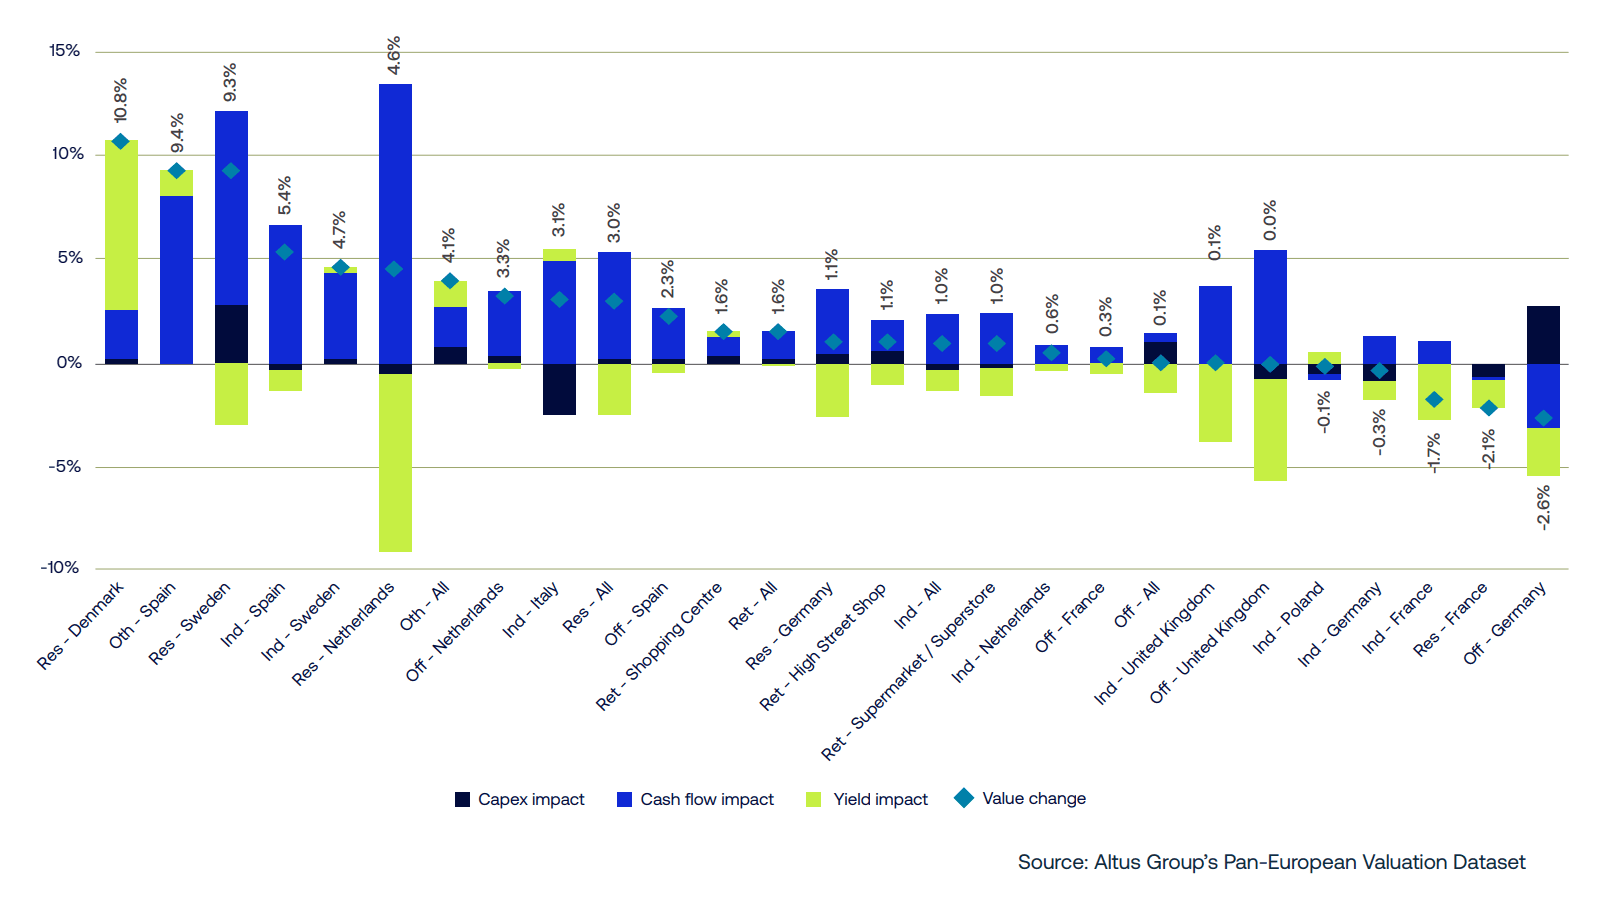
Figure 11: Q3 2026 versus Q3 2023 | 3-year sector country appreciation spreads
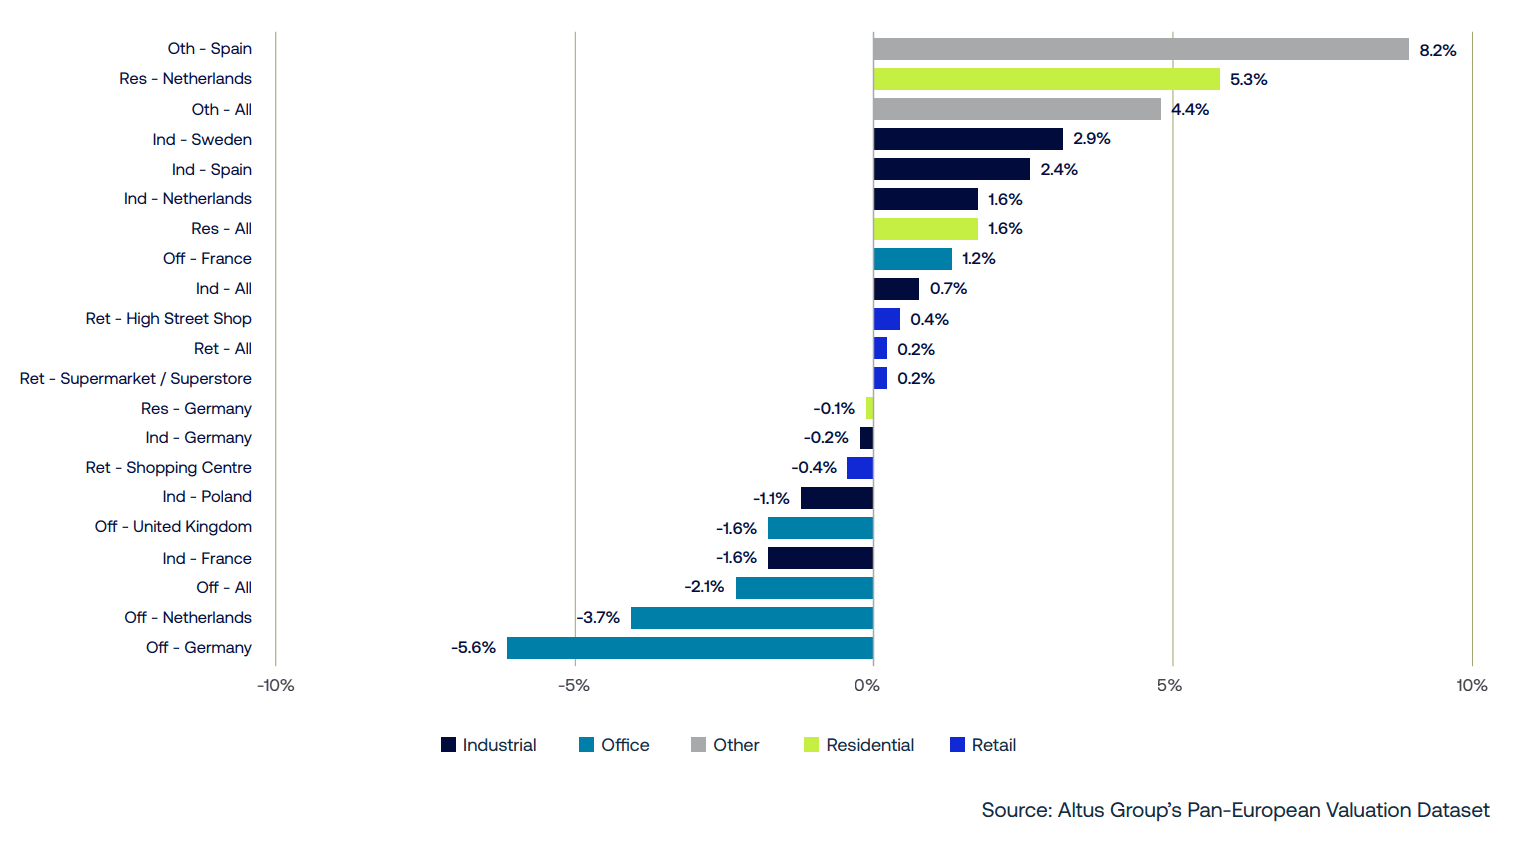
Figure 12: Q3 2026 versus Q3 2023 | Impact metrics – by sector and country
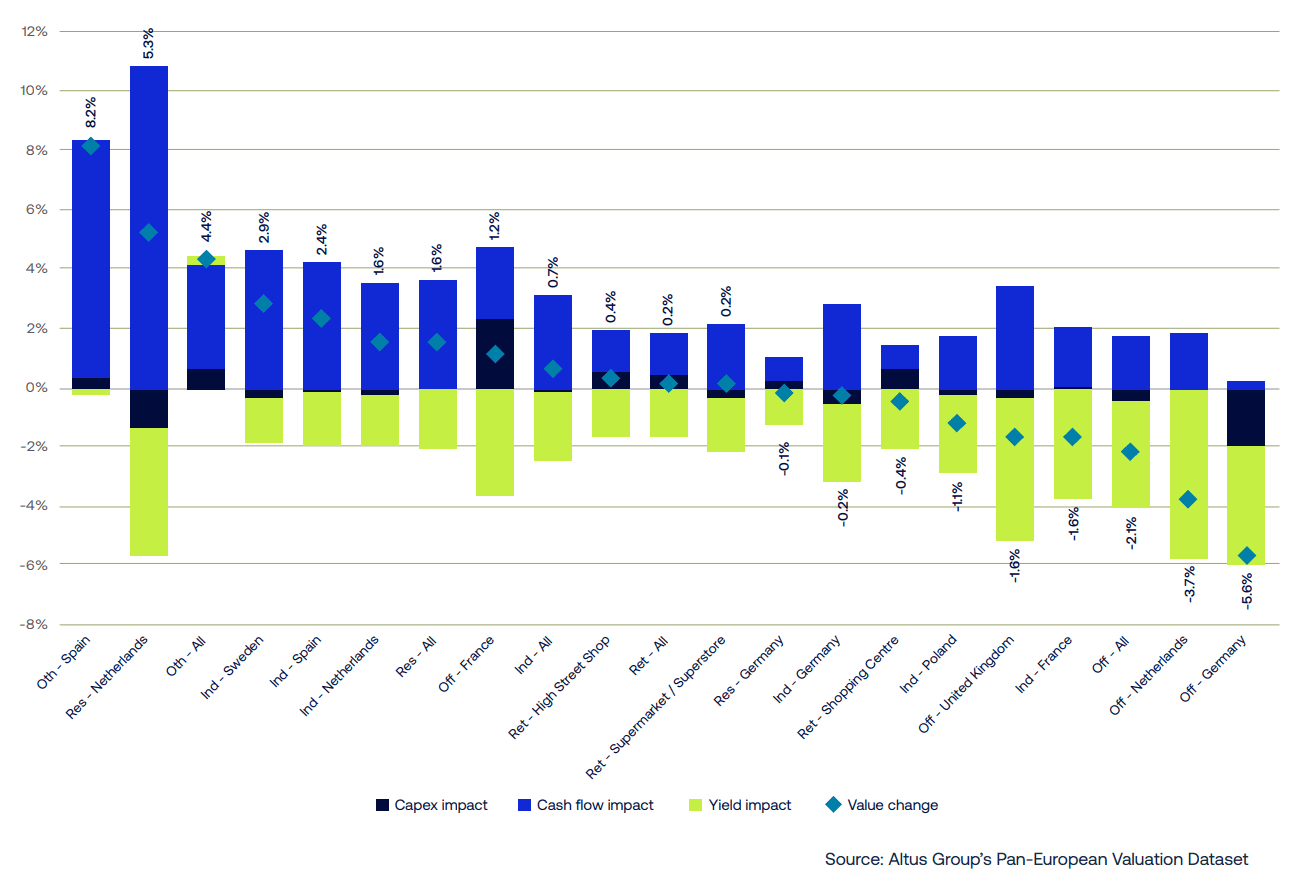
Want to be notified of our new and relevant CRE content, articles and events?
Disclaimer
This publication has been prepared for general guidance on matters of interest only and does not constitute professional advice or services of Altus Group, its affiliates and its related entities (collectively “Altus Group”). You should not act upon the information contained in this publication without obtaining specific professional advice.
A number of factors may influence the performance of the commercial real estate market, including regulatory conditions and economic factors such as interest rate fluctuations, inflation, changing investor sentiment, and shifts in tenant demand or occupancy trends. We strongly recommend that you consult with a qualified professional to assess how these and other market dynamics may impact your investment strategy, underwriting assumptions, asset valuations, and overall portfolio performance.
No representation or warranty (express or implied) is given as to the accuracy, completeness or reliability of the information contained in this publication, or the suitability of the information for a particular purpose. To the extent permitted by law, Altus Group does not accept or assume any liability, responsibility or duty of care for any consequences of you or anyone else acting, or refraining to act, in reliance on the information contained in this publication or for any decision based on it. The distribution of this publication to you does not create, extend or revive a client relationship between Altus Group and you or any other person or entity. This publication, or any part thereof, may not be reproduced or distributed in any form for any purpose without the express written consent of Altus Group.
Author

Phil Tily
Senior Vice President, Performance Analytics
Author
Phil Tily
Senior Vice President, Performance Analytics
Leverage our real estate data and predictive analytics
The performance attribution, predictive analytics and market intelligence you need to explain performance and improve decision making.
Resources
Latest insights