Canadian commercial real estate market update – Q1 2026
Total investment volume reached nearly $10.7 billion, a marginal 5% year-over-year increase driven by a 158% year-over-year surge in office investment activity.
Canadian commercial real estate market update – Q1 2026
Total investment volume reached nearly $10.7 billion, a marginal 5% year-over-year increase driven by a 158% year-over-year surge in office investment activity.
Author

Jennifer Nhieu
Senior Research Analyst
Key highlights:
Total national investment volume reached nearly $10.7 billion, structurally anchored by a massive 158% year-over-year surge in office sector activity that was heavily concentrated in premium Class AAA assets across Montreal, Ottawa, and Toronto
National retail investment volume plummeted 40% year-over-year to nearly $1.4 billion as an acute shortage of premium foot-anchored assets, coupled with elevated financing costs, severely restricted transaction velocity and new development despite robust long-term fundamentals
Supported by a stabilizing interest rate environment, investor sentiment transitioned away from an exclusive reliance on defensive capital preservation toward opportunistic deployment targeting core assets discounted by temporary market friction but backed by strong long-term fundamentals
Investment volume and core drivers of resilience
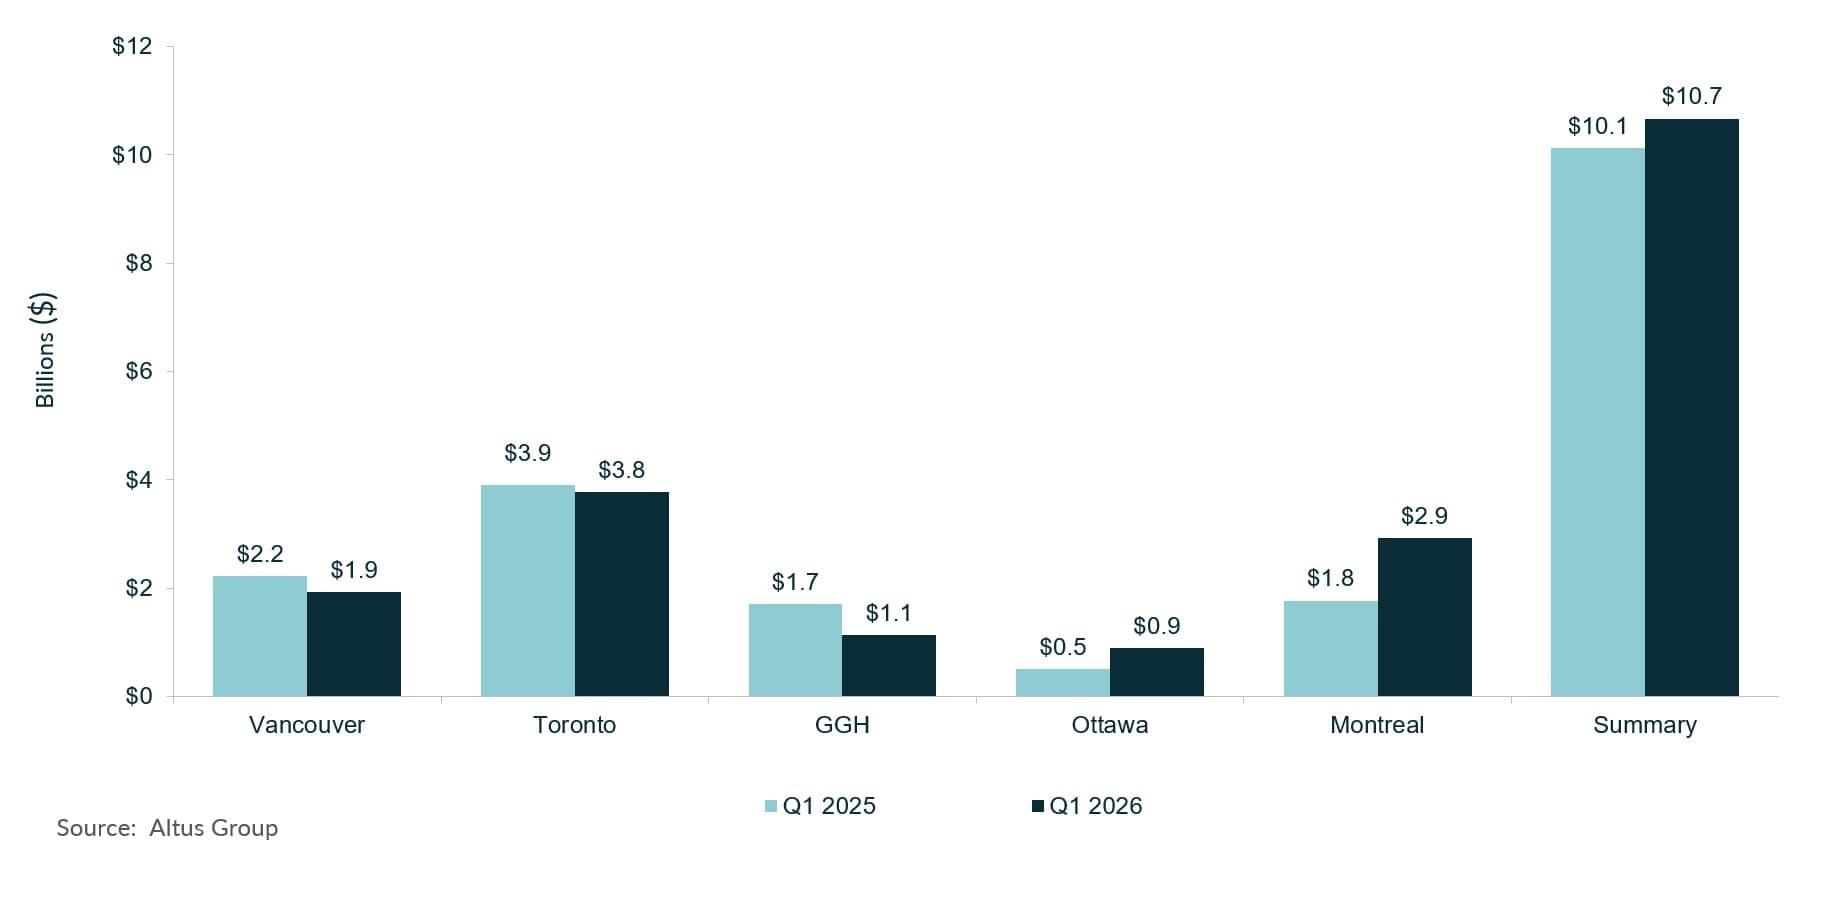
During the first quarter of 2026, the Canadian commercial real estate (CRE) market demonstrated structural resilience against a complex macroeconomic backdrop. Total investment volume reached nearly $10.7 billion, a marginal 5% year-over-year increase (Figure 1). This upward trajectory was primarily driven by a substantial 158% year-over-year surge in office investment activity, with major metropolitan markets leading the recovery, specifically Montreal, followed by Ottawa and the Greater Toronto Area (GTA). Internationally, the Canada-United States-Mexico Agreement (CUSMA) provided a critical legal safeguard against rising U.S. trade protectionism, sustaining cross-border capital flows into the Canadian real estate sector during a period of shifting global trade tensions.
Figure 1: Canada’s total investment activity YTD – All sectors by region (Q1 2025 vs. Q1 2026)
The domestic economic environment maintained a delicate equilibrium throughout the quarter. On March 18th, 2026, the Bank of Canada maintained its target for the overnight lending rate at 2.25% to counter global energy volatility exacerbated by conflicts in the Middle East. Concurrently, domestic growth softened, with national gross domestic product (GDP) growth in March recording an annualized contraction of 0.4%, driven by a slowdown in goods-producing industries. Despite this contraction, the consumer and labour markets held relatively steady with the unemployment rate hovering at 6.7%, remaining virtually unchanged on a year-over-year basis.
Anticipating a major monetary policy inflection point in the second half of 2026, institutional investors adopted a defensive and highly strategic approach to capital deployment. Capital was predominantly funneled toward defensive assets with proven, immediate cash flows, specifically Class AAA office spaces and food-anchored retail strips, both of which significantly outperformed all other property types within their respective asset classes. However, this concentrated demand, coupled with a lack of new development, triggered an acute inventory shortage of premium assets. Institutional owners increasingly elected to hold well-performing properties rather than divest, severely restricting the available product pipeline.
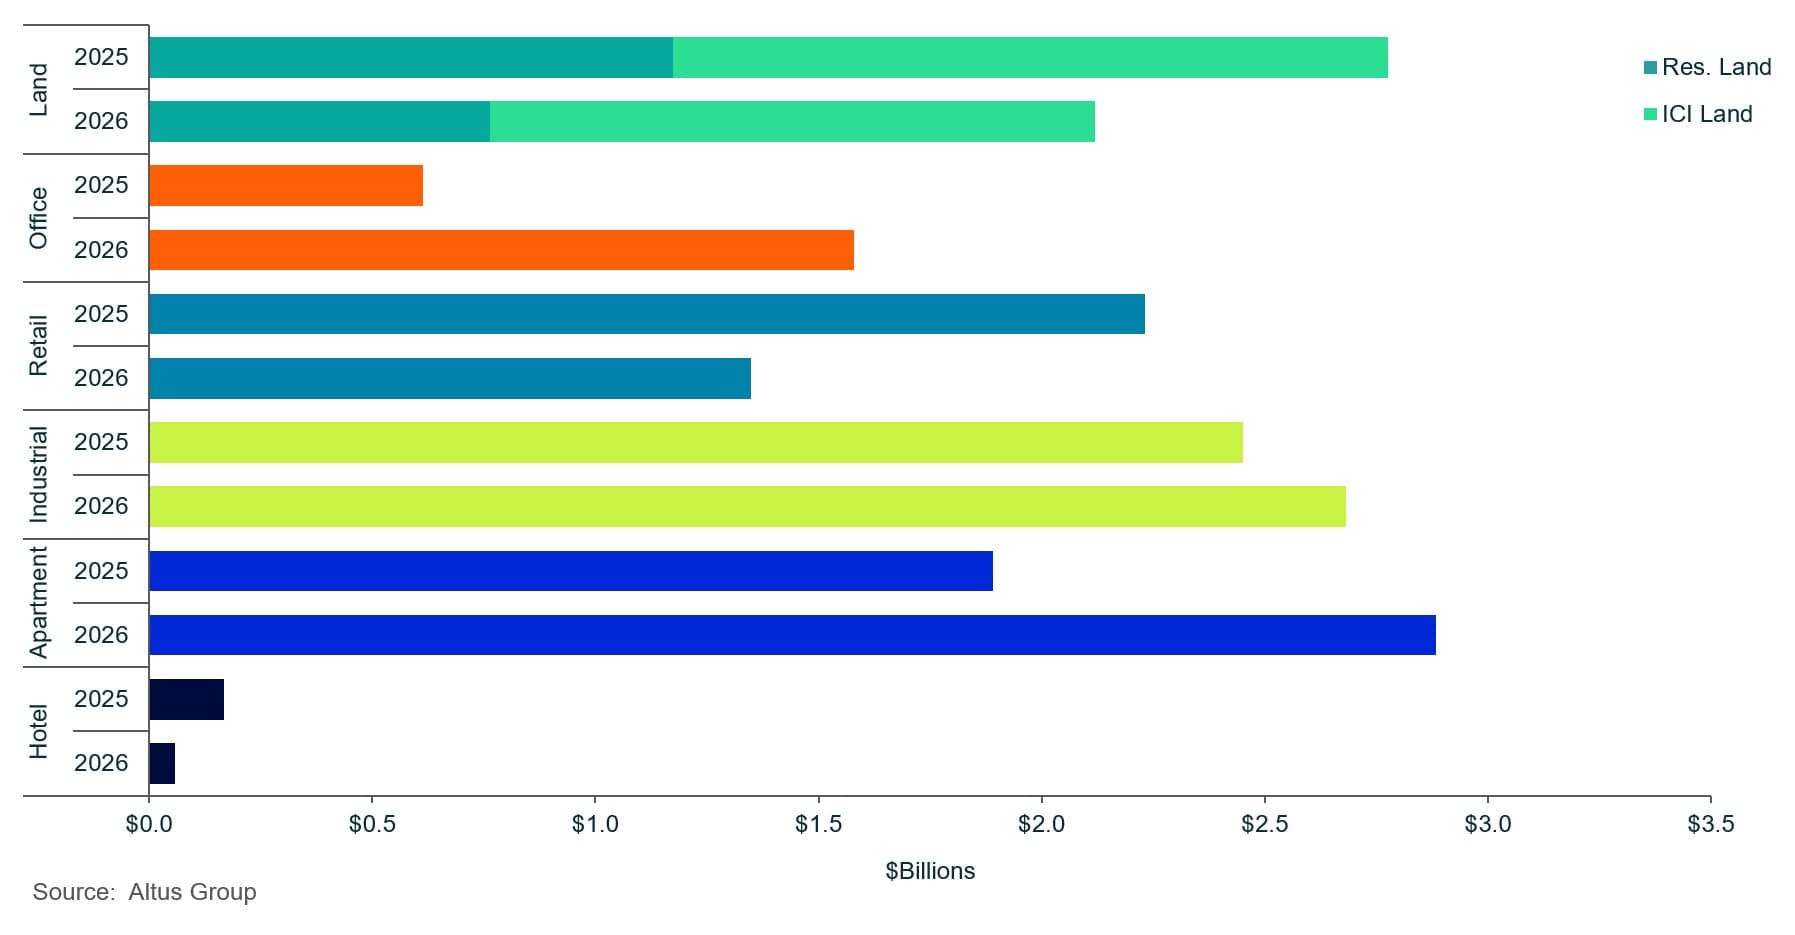
Figure 2: Canada’s property transactions by asset class (Q1 2025 vs. Q1 2026)
Regional investment performance
The Canadian CRE market experienced a broad stabilization across most major metropolitan areas during the first quarter of 2026. However, a significant geographical shift in transaction velocity emerged, as national growth metrics were heavily propelled by an exceptional surge in investment activity within Ottawa and Montreal. This localized acceleration across these two markets served as the primary engine for the country’s collective upward trajectory, effectively counterbalancing the ongoing transaction stagnation and marginal contractions recorded in traditional leading markets like Toronto and Vancouver.
Investment velocity in the Greater Golden Horseshoe (GGH) pulled back notably, registering a modest $1.1 billion in total transaction volume. This represented a sharp 34% year-over-year decline, reflecting a systemic deceleration across the retail, industrial, and land development sectors as investors adjusted to localized economic cooling. Concurrently, the GTA navigated a marginal deceleration of its own, with transaction volumes settling at nearly $3.8 billion, a 3% year-over-year contraction. This decelerated pace was largely attributed to a pronounced pullback in retail investment activity, which stemmed from an acute lack of premium inventory across high-demand retail corridors rather than a collapse in consumer fundamentals.
Montreal emerged as a primary engine for national growth during the first quarter of 2026, delivering an exceptional performance that defined broader macroeconomic headwinds. Total investment volume in the region reached $2.9 billion, representing a significant 65% year-over-year surge in transaction velocity. Capital deployment was heavily anchored by the multi-family sector, which solidified its position as a market cornerstone by attracting nearly $1.6 billion, accounting for 54% of Montreal’s total transactional volume and marking a substantial 55% increase year-over-year. This momentum was further bolstered by high-profile institutional acquisitions, such as Germany’s DekaBank purchasing the Tour Deloitte office tower and robust conviction in industrial assets. Ultimately, the sheer scale of these diversified capital inflows insulated Montreal from the transactional stagnation seen in other traditional Canadian hubs.
Vancouver’s CRE sector recorded a 14% year-over-year contraction, bringing total investment volume down to $1.9 billion. This downward adjustment reflected a broad deceleration across almost all core asset classes, with the notable exception of a steady office market, highlighting a defensive stance among investors navigating British Columbia’s elevated cost of capital. Conversely, Ottawa established a strong operational foothold, securing $900 million in total transaction volume, representing a robust 80% year-over-year increase, driven by diversified injections across the office, retail and industrial sectors.
Comprehensive first-quarter performance metrics for Calgary and Edmonton remained incomplete at the time of reporting due to compounding delays at the Alberta Land Titles Office. Despite these administrative backlogs, trailing leading indicators underscored promising momentum for both major metropolitan areas. Prior to these reporting delays, the markets demonstrated substantial velocity in 2025, transacting $5.4 billion in Calgary and $4.6 billion in Edmonton. This momentum was sustained by upward growth trajectories within Calgary’s office and industrial spaces, buoyed by energy sector resilience, alongside robust demand in Edmonton’s retail and hospitality sectors, which benefited directly from positive demographic inflows and superior regional affordability.
Retail sector
Food-anchored retail assets remained in exceptionally high demand across Canada in the first quarter of 2026, particularly within prime urban retail corridors. Investors heavily favoured these essential-service properties due to their highly defensive profile, supported by high occupancy, low tenant turnover, and structural resilience against e-commerce disruption and macroeconomic volatility. Furthermore, the sector’s role as an inflation hedge tightened a restricted supply environment. Existing owners increasingly held onto these high-performing, income-producing assets, while rigid lending environments and elevated capital costs curtailed new development. This combination of limited product availability and high financing costs severely constrained near-term investment activity across the country, resulting in a national retail investment volume of nearly $1.4 billion for the quarter, a sharp 40% decline year-over-year.
Faced with these constraints, market participants increasingly focused strategic efforts on intensifying existing commercial footprints. Well-capitalized owners extensively explored integrating residential components into suburban shopping centres to maximize underlying land values. However, softening multi-family sector fundamentals, including downgraded population forecasts, excess supply, localized excess supply, and decelerating rental growth, rendered large-scale mixed-use residential additions financially unviable for many asset managers. Consequently, developers and property owners rapidly pivoted their capital expenditures toward pure retail intensification, such as pad site developments and re-tenanting initiatives, which offered shorter construction downtime, lower capital requirements, and accelerated financial returns.
From a regional perspective, significant disparities in investment velocity were driven by localized supply dynamics and asset availability. The Ottawa retail market recorded the highest year-over-year growth rate in the country at an impressive 173%, though this surge was amplified by a small baseline, with nearly $130 million in total dollar volume transacted during the quarter. Following this leading pace, year-over-year investment activity in Montreal and Vancouver remained comparatively stable. Montreal recorded a 6% year-over-year increase in volume, significantly bolstered by the notable $44.5 million acquisition of the Faubourg Bois-Franc, a pharmacy-anchored neighbourhood retail strip, providing a major liquidity injection to the local market.
Conversely, Vancouver posted a 10% year-over-year decrease in retail investment activity, yet it commanded the highest absolute transactional volume in the nation at nearly $443 million. This substantial total was largely driven by high-profile, single-asset transactions, the commercial acquisition of the prominent Audi Richmond and Jaguar Land Rover dealership complexes located at 5600 and 5680 Parkwood Crescent. Despite macroeconomic friction, confidence in premier, high-traffic West Coast locations remained robust, and Vancouver continued to command a pricing premium for luxury downtown street frontages, highlighted by the high-profile sale of 1101, 1121 & 1133 Alberni Street.
In stark contrast, the GTA's retail market faced severe transactional headwinds, recording just $314 million in total volume, a steep 66% year-over-year decline. This pronounced deceleration was primarily due to an acute lack of available premium product and elevated borrowing costs, which constrained both leasing velocity and development activity. Furthermore, shifting macroeconomic fundamentals, including a temporary deceleration in regional population growth, compressed household purchasing power, and dampened consumer confidence, threatened near-term retail spending as local households increasingly prioritized non-discretionary essential goods over discretionary purchases. Despite these immediate headwinds, the GTA retail market maintained its long-term appeal, underpinned by its foundational role as Canada’s primary commercial hub and a critical point of entry for prominent international brands expanding their footprints into the Canadian market.
Office sector
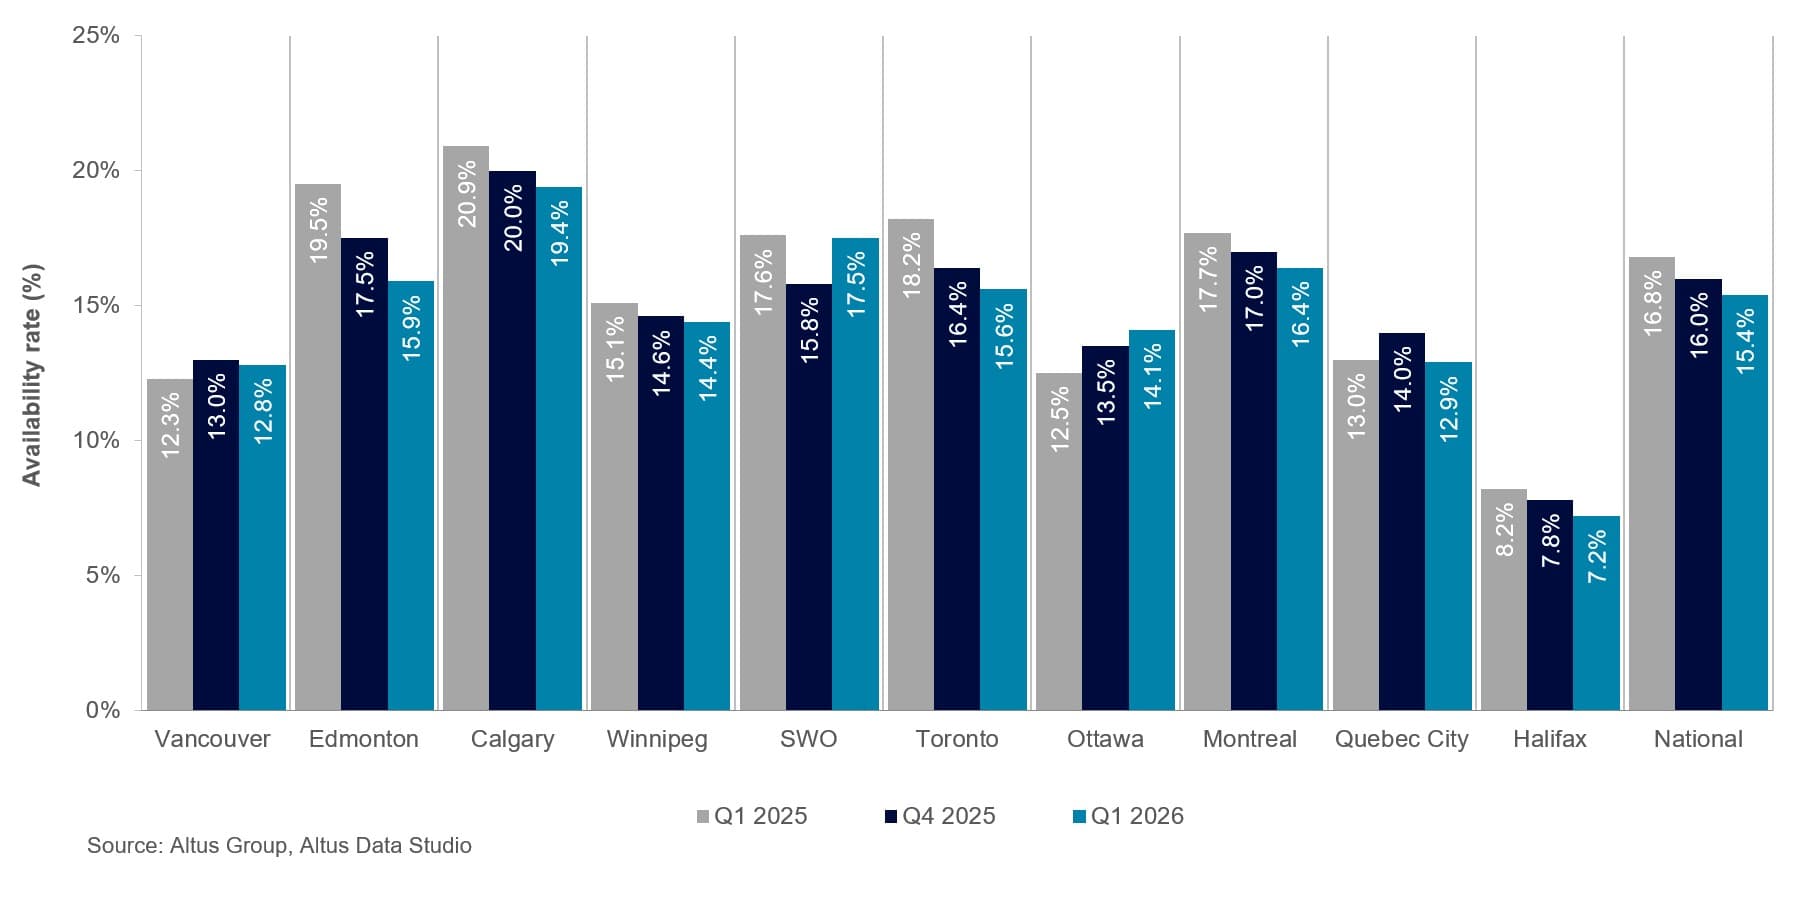
The Canadian office sector sustained its recovery trajectory during the first quarter of 2026, building upon the structural leasing momentum and market gains recorded throughout the previous year. Growth expectations among institutional investors remained positive as an increasing number of corporate employers reinforced mandatory return-to-office policies. Concurrently, occupiers accelerated their transition toward highly efficient space planning, which materially improved core urban market fundamentals and reduced overall availability in major metropolitan hubs. According to the latest Altus Group Canadian Office Market Update, the national office availability rate fell 140 basis points year over year to settle at 15.4% (Figure 3). The decline was driven mainly by stronger tenant utilization and fewer new construction completions. As the supply of modern top-tier space tightened, market participants increasingly turned their attention to older Class A assets, placing a strategic emphasis on repositioning and adaptive reuse of secondary properties to meet evolving tenant demands.
Figure 3: Office availability rates (Q1 2025 vs Q4 2025 vs Q1 2026)
Capital market activity within the office sector expanded dramatically, recording nearly $1.6 billion in total transaction volume, which represented a substantial 158% increase on a year-over-year basis. Investment deployment was heavily concentrated within the premium Class AAA segment, reflecting a pronounced flight to quality as capital explicitly prioritized highly amenitized assets. This trend was further evidenced by the national downtown direct Class A availability rate, which decreased by 70 bps to 10.6% year-over-year. Transaction data heavily corroborated this tier preference:
Class A transactions accounted for the majority of market activity with 168 deals encompassing 5.4 million square feet
Conversely, Class B office space saw significantly lower demand, comprising only 32 transactions totalling nearly 554,000 square feet, highlighting the growing obsolescence of aging, suburban non-amenitized inventory
Regional performance remained constructive, with Montreal, Ottawa and the GTA recording the strongest year-over-year gains in office investment volume. Montreal led the nation in growth, with transaction volume surging 864% year over year to reach $470 million, ranking first in relative growth and second in absolute transactional volume, trailing the GTA by a mere $15 million. Ottawa followed with a remarkable 490% year-over-year increase, reflecting a pronounced rebound in regional market activity and public-sector tenant stabilization. The GTA also posted a strong performance, with investment volume expanding 103% year over year, cementing its position among the top-performing major metropolitan office markets.
Vancouver demonstrated resilient capital conviction, securing $338 million in transacted dollar volume, which represented a 45% increase year-over-year. Conversely, the GGH recorded a minor, nominal increase in office investment volume, transacting just $52 million, a 3% increase year-over-year. This marginal uptick followed a historically depressed first quarter in 2025, indicating that the statistical improvement was largely a reflection of a low baseline effect rather than a fundamental surge in regional market velocity when viewed in the broader economic context.
Industrial sector
The Canadian industrial sector entered a distinct stabilization period during the first quarter of 2026, as the broader commercial market digested the supply wave generated by extensive speculative development completions from previous years. Investor sentiment noticeably pivoted toward a “flight-to-quality” framework, narrowing bid-ask spreads while national capitalization rates plateaued near the 6.0% threshold. Total transaction volume moderated across the country, recording nearly $2.7 billion, which represented a modest 9% increase year-over-year. This performance reflected a highly selective acquisition strategy among investors, who intentionally diverted capital away from speculative, high-growth plays and instead prioritized core, functional assets designed for long-term income stability. Crucially, the GTA served as a primary driver of this national transactional baseline, anchoring market activity by recording $1.5 billion in total industrial volume, which represented a solid 11% year-over-year increase, driven by several high-value strategic acquisitions. Despite overarching national uncertainties, Ottawa and Montreal successfully bucked the broader trend, recording year-over-year increases in industrial investment of 122% and 36%, respectively.
Montreal’s industrial sector demonstrated clear early signs of recovery, with investment volume expanding 36% year over year to exceed $466 million. This gain followed a volatile operational period during which local investors adjusted to a softer domestic economy. Geography and asset age remained the primary differentiators of capital allocation within the market. On the Island of Montreal, institutional deployment into core assets was frequently limited by aging infrastructure, restricted clear heights and elevated municipal operating costs. In stark contrast, the South Shore strengthened its role as a hub for next-generation distribution centres, attracting substantial inflows of logistical capital supported by larger available land parcels and state-of-the-art building specifications.
Conversely, investment activity across both the GGH and Vancouver softened, with volumes declining by 21% and 7% year-over-year, respectively. Even with this localized deceleration, the GGH remained a foundational cornerstone for last-mile logistics distribution, transacting nearly $215 million in total dollar volume. This pullback reflected a more defensive acquisition approach, compounded by an exceptionally strong first quarter in 2025 that created a challenging baseline for comparison. Within the Vancouver industrial market, tenant and investor demand remained deeply bifurcated. Core urban industrial markets continued to observe space constraints, compelling occupiers to right-size operational footprints as they reassessed immediate spatial requirements, while more cost-conscious, non-prime suburban markets held steady to maintain baseline regional occupancy.
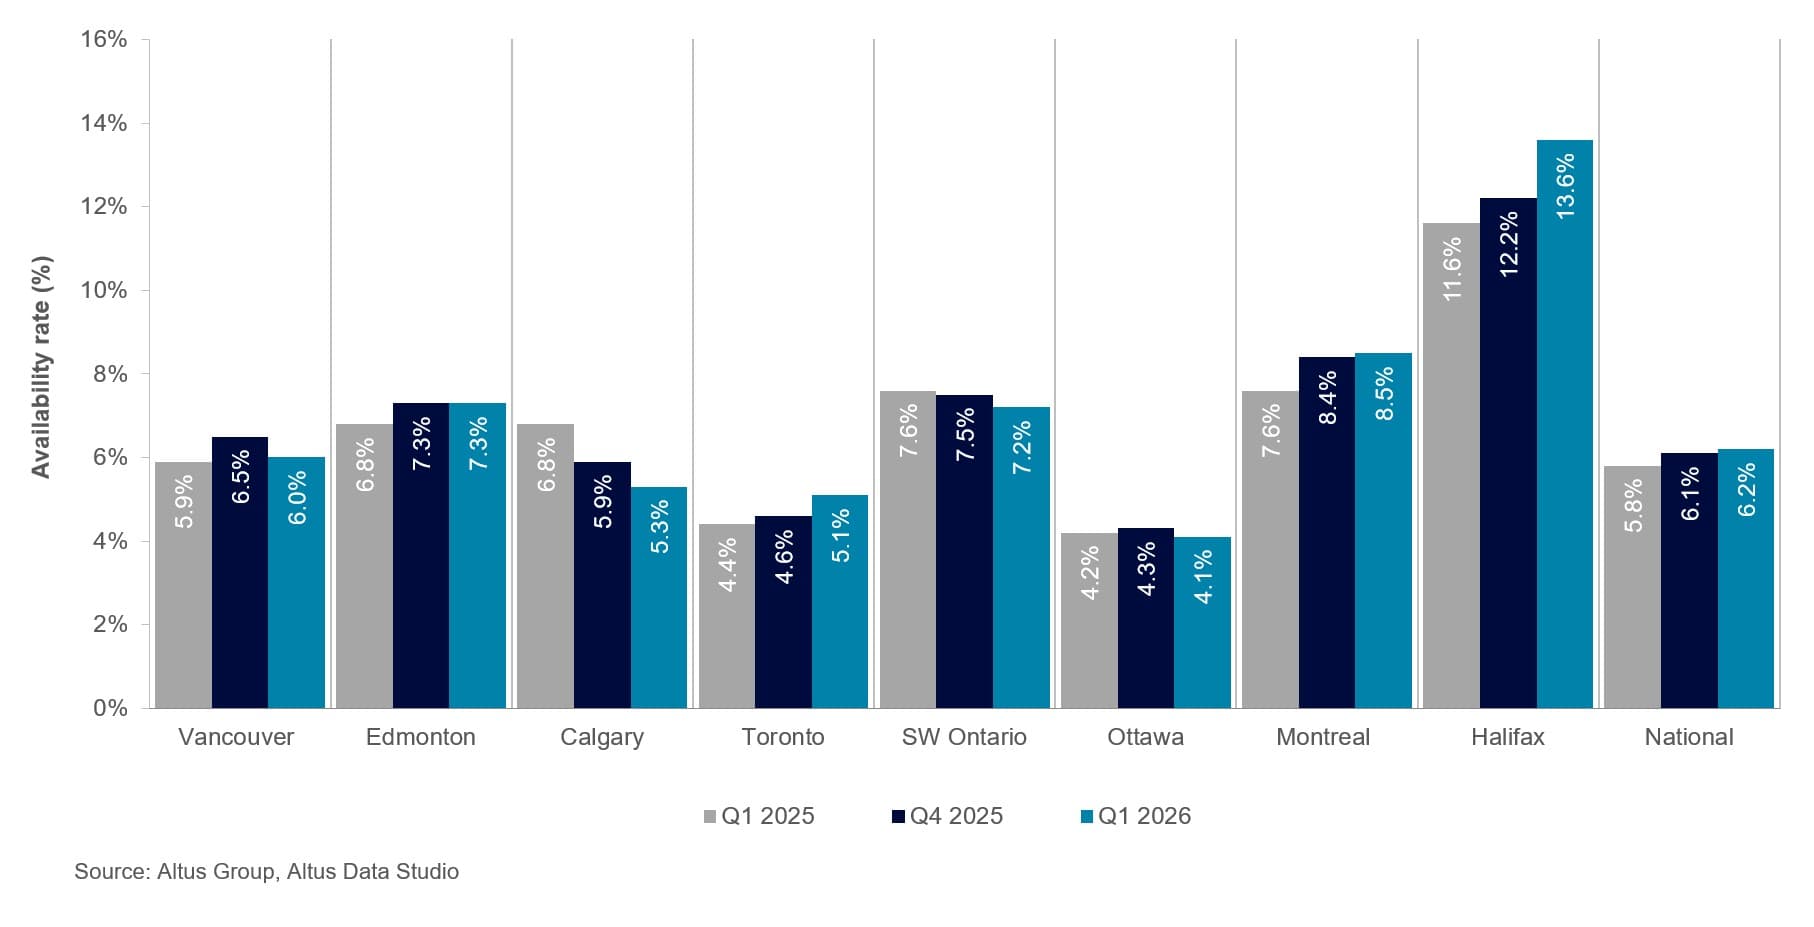
Simultaneously, the national industrial landscape navigated a nuanced rebalancing of supply and demand. According to the latest Altus Group Canadian Industrial Market Update, the industrial availability rate climbed to 6.2% (Figure 4), representing a 40 basis point (bps) year-over-year increase. This upward shift was driven primarily by the completion of several large speculative projects that temporarily outpaced leasing velocity. Despite this influx of new supply, average national net asking rents stabilized at approximately $16 per square foot. This pricing resilience suggested that the rising absorption of high-specification spaces was beginning to effectively offset the active development pipeline, establishing a sustainable floor for the asset class moving forward.
Figure 4: Industrial availability rates (Q1 2025 vs Q4 2025 vs Q1 2026)
Multi-family sector
The Canadian multi-family sector demonstrated a resurgence in investment activity at the start of 2026, recording nearly $2.9 billion in total transaction volume. This capital deployment represented a substantial 53% year-over-year increase, signalling a strong return of investor confidence after a highly constrained investment landscape in 2025. This transactional rebound materialized despite broader macroeconomic headwinds, including an active expansion in market supply and cooled near-term population growth forecasts. Institutional and private investors returned from the sidelines, drawn by the progressive narrowing of bid-ask spreads and an apparent slowdown in the new construction pipeline, which collectively reduced development risk and provided more predictable entry yields.
From a regional perspective, capital expansion was heavily concentrated within eastern urban nodes, which displayed distinct economic and demographic drivers. The GTA served as the primary catalyst for this sector-wide rebound, with total investment volume climbing to nearly $675 million, an extraordinary 232% increase year-over-year. This explosive growth was fundamentally anchored by a deepening housing affordability crisis, as elevated mortgage qualification hurdles effectively sidelined prospective first-time homebuyers and sustained an exceptionally stable floor for rental demand. Across the broader eastern provinces, complementary transactional momentum was observed, with Ottawa, Montreal and the GGH reporting robust year-over-year increases of 60%, 55% and 24%, respectively, benefitting from stable local renter bases and consistent demand for institutional-grade portfolios.
In contrast, Vancouver’s multi-family sector navigated a significant contraction, reporting a 48% year-over-year decrease to settle at $185 million in dollar volume transacted. This deceleration revealed a bifurcated rental landscape within British Columbia. While Vancouver’s high-density downtown core remained fundamentally resilient, buoyed by rigid structural demand and corporate return-to-office mandates, its surrounding suburban submarkets faced a much more challenging operating environment. In these secondary areas, a localized influx of newly completed condominium and purpose-built rental units exerted downward pressure on secondary resale values and monthly rental rates. This temporary supply imbalance granted tenants greater transactional leverage, which challenged short-term yields and forced a more defensive, risk-averse stance among West Coast investors.
Despite these supply-side adjustments and regional variations, the underlying fundamentals of the national multi-family asset class remained highly constructive, prioritizing predictable, recession-resistant cash flows within an otherwise affordability-constrained housing market.
Market outlook
Looking ahead to the remainder of 2026, the Canadian commercial real estate market is projected to enter a crucial transition phase, moving away from an exclusive reliance on defensive capital preservation toward a more balanced, multifaceted investment landscape. While defensive strategies remain core to portfolio management, an increasing number of institutional investors are expected to adopt opportunistic approaches to capital deployment. Strategists are selectively targeting assets discounted by temporary market friction but backed by strong long-term fundamentals. This shift in sentiment is supported by a stabilizing interest rate environment, which market participants increasingly view as a reliable baseline for underwriting rather than an ongoing risk factor, ultimately driving a progressive return of institutional liquidity.
Within individual property segments, forward-looking strategies are rapidly adapting to this blended investment philosophy. In the office sector, capital deployment continues to favour a flight-to-quality framework, where corporate return-to-office mandates sustain demand and preserve the long-term value of premier, highly amenitized downtown spaces. Concurrently, investor sentiment within the industrial market is shifting toward opportunistic acquisitions as net leasing activity stabilizes and the active construction pipeline tapers off, allowing existing modern inventory to be absorbed. Food-anchored retail strips maintain their status as an essential defensive property type, while the multi-family sectors is seeing heightened opportunistic interest from strategists viewing current cap rate plateaus as an ideal entry window to capture resilient, long-term cash flows driven by Canada’s structural housing deficit. While the mid-year initiation of the formal CUSMA renegotiations will likely introduce intermittent headline volatility, the overall market narrative remains constructively focused on strategic transactional acceleration.
Want to be notified of our new and relevant CRE content, articles and events?
Disclaimer
This publication has been prepared for general guidance on matters of interest only and does not constitute professional advice or services of Altus Group, its affiliates and its related entities (collectively “Altus Group”). You should not act upon the information contained in this publication without obtaining specific professional advice.
A number of factors may influence the performance of the commercial real estate market, including regulatory conditions and economic factors such as interest rate fluctuations, inflation, changing investor sentiment, and shifts in tenant demand or occupancy trends. We strongly recommend that you consult with a qualified professional to assess how these and other market dynamics may impact your investment strategy, underwriting assumptions, asset valuations, and overall portfolio performance.
No representation or warranty (express or implied) is given as to the accuracy, completeness or reliability of the information contained in this publication, or the suitability of the information for a particular purpose. To the extent permitted by law, Altus Group does not accept or assume any liability, responsibility or duty of care for any consequences of you or anyone else acting, or refraining to act, in reliance on the information contained in this publication or for any decision based on it. The distribution of this publication to you does not create, extend or revive a client relationship between Altus Group and you or any other person or entity. This publication, or any part thereof, may not be reproduced or distributed in any form for any purpose without the express written consent of Altus Group.
Author
Jennifer Nhieu
Senior Research Analyst
Resources
Latest insights