Canadian office market update – Q1 2026
Regional performance across major Canadian office markets diverged notably in Q1 2026, though most regions followed a broader downward trend in availability.

Key highlights:
Source: Altus Data Studio market data and analysis
The national office availability rate declined by 140 basis points year-over-year to 15.4%, driven by increased demand for Class AAA office space and a significant reduction in new office construction
Despite having the highest availability rate at 19.4%, Calgary saw year-over-year improvement, with a 160 basis point decrease, indicating strong recovery momentum for the market
Edmonton’s office availability rate decreased by 360 bps year-over-year to 15.9%, representing the largest decrease among Canada’s office markets
The national office construction pipeline is at a multi-year low, with total square footage under construction at 2.8 million, with 34.5% of the space available for lease
The lack of new supply is expected to force a strategic shift in the office sector, driving investment from new construction toward the repositioning of existing assets as property owners aim to capitalize on demand by modernizing older Class A and some Class B properties in smaller markets
In the first quarter of 2026, the national office availability rate contracted, settling at 15.4%
The Canadian office market maintained a trajectory of sustained recovery during the first quarter of 2026, successfully building upon the robust leasing momentum and market strengthening observed throughout 2025. At the outset of the year, the sector positioned itself for continued growth as corporate entities further solidified return-to-office mandates. The strategic shift toward more efficient space planning, which gained significant traction during the previous years, intensified in early 2026, leading to a marked improvement in core office real estate metrics and a systemic reduction in overall availability within primary urban hubs.
National availability and sublet contraction
According to analysis of data from Altus Data Studio, national office availability experienced a meaningful contraction, settling at 15.4% in the first quarter of 2026 (Figure 1). This performance represented a year-over-year decrease of 140 basis points (bps). This consistent downward trend served as a clear indicator of market stabilization, driven primarily by heightened tenant demand for high-quality environments and a concurrent reduction in the delivery of new office construction. The steady absorption of sublet space further reinforced the narrative of a tightening market as organizations deliberately moved away from temporary dispositions in favour of new tenancies and renewals.
Figure 1: Office availability rate (Q1 2025 vs. Q4 2025 vs. Q1 2026)
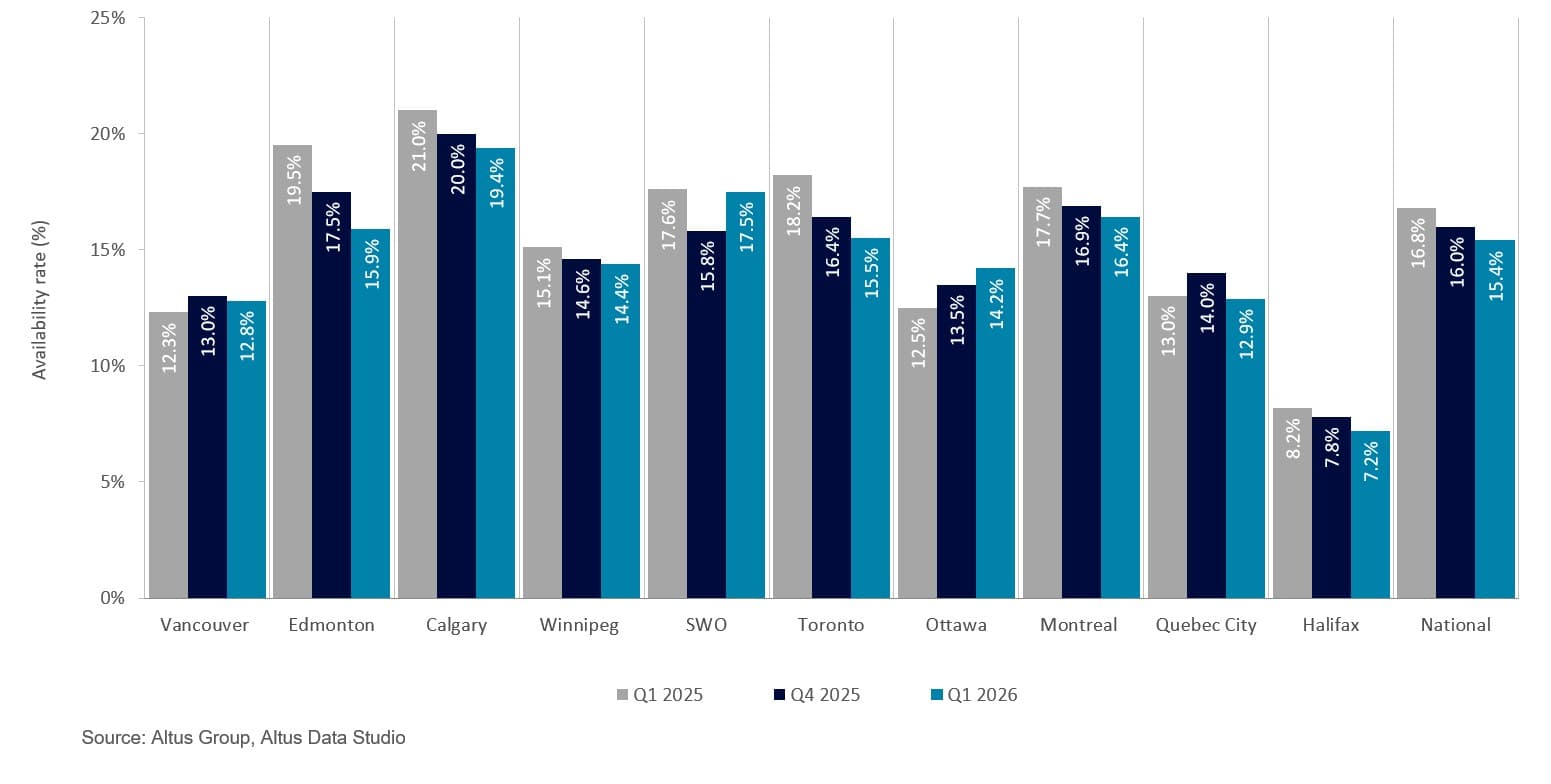
The “flight-to-quality” and market bifurcation
The “flight-to-quality" trend remained a defining characteristic of the office landscape, as tenants prioritized amenity-rich and well-located assets to enhance the employee experience. This shift exacerbated the performance gap between premium Class A properties and aging Class B inventory, while also inducing a notable bifurcation within the Class A segment. Consequently, the distinction between standard Class A and top-tier Class AAA (Trophy) buildings became increasingly pronounced.
These premier assets consistently commanded higher rental rates and maintained lower vacancy rates, reflecting a surge in corporate demand for superior mechanical infrastructure, wellness-focused amenities and sustainability retrofits, all of which served as essential tools for talent retention within a hybrid work environment.
National and major market performance
Regional performance across major Canadian office markets diverged notably in the first quarter of 2026, though most regions followed a broader downward trend in availability. This variation was largely defined by the tension between robust absorption in primary financial hubs and structural vacancies in markets undergoing inventory transitions. Despite these localized differences, a collective shift toward stabilization emerged as high-conviction leasing in the Class A segment began to outpace new supply and shadow inventory across most major centres.
Halifax maintained the nation’s lowest availability rate at 7.2%, representing a year-over-year decrease of 100 bps. This contraction was driven by robust Class A leasing velocity and the province’s specialized economic base. Specifically, anticipated increases in federal defence spending were expected to further tighten the market by stimulating recruitment and revitalizing infrastructure related to Nova Scotia’s military assets.
In contrast, Calgary recorded the highest national availability rate at 19.4%, though this figure necessitated a more nuanced interpretation grounded in the city’s urban renewal strategy. Despite the elevated rate, the market experienced a year-over-year reduction of 160 basis points, signalling the success of the city’s Downtown Development Incentive Program (DDIP). By incentivizing the conversion of underutilized office space into residential and productive developments, the program effectively facilitated market rebalancing. As of the first quarter of 2026, the city had announced nine additional conversion projects, bringing the total to 21. Supported by $153 million in municipal investment, these initiatives were estimated to have removed approximately 2.7 million square feet of office inventory from the market.
Vancouver reported an availability rate of 12.8%, a 50 bps increase year-over-year. While the city experienced a steady introduction of new office supply throughout 2025, the availability rate remained remarkably stable, holding within a narrow range of 12 to 13%. This equilibrium was supported by strong pre-leasing activity in recently completed projects, which prevented a significant spike in vacant stock. With a limited pipeline of new construction slated for the remainder of 2026, the market was positioned for a period of supply-side tightening as existing premium vacancies are gradually absorbed.
Ottawa’s availability rate increased by 170 bps to 14.2% year-over-year, holding stubbornly between the 12% to 14% range. This trend was predominantly driven by shadow vacancies entering the market. These spaces represented leased office space that a tenant was not officially “occupying”, thereby masking the true amount of unused space in the market. Furthermore, the Public Services and Procurement Canada's (PSPC) original plan to offload half of its surplus office space has been hindered by the government’s effort to increase in-office attendance. Consequently, the volume of planned disposals was revised downward, with approximately 33% of surplus space now designated for sale or lease.
Toronto’s availability rate reached 15.5%, decreasing by 270 bps year-over-year as the market demonstrated substantial resilience. This improvement was largely fuelled by the aggressive enforcement of return-to-office mandates by major financial institutions and the provincial government, which drove six consecutive quarters of positive net absorption in the downtown core. The absence of significant new completions during the quarter further aided in the recovery, as tenants competed for a diminishing pool of high-quality Class AAA contiguous blocks. Looking ahead, the scarcity of upcoming supply is expected to exert upward pressure on rental rates in premium assets.
Montreal posted a rate of 16.4%, down 130 bps year-over-year, reflecting a steady recovery in the city’s urban centre. The market benefited from a notable contraction in sublease availability, down 100 bps to 1.7%, as firms either reoccupied their footprints or allowed temporary dispositions to expire in favour of long-term renewals. This trend was particularly evident in the Class A segment, where availability rates declined 160 bps to 14.6% year-over-year. As tenant demand continued to intensify, the market shifted toward a more balanced state, supported by the ongoing absorption of existing vacancy and a disciplined development pipeline.
Quebec City’s office availability rate held steady, down just 10 bps year-over-year to 12.9%. The national “flight-to-quality” trend was less evident here, as tenants demonstrated a stronger preference for Class B properties, which maintained a lower availability rate of 11.0% compared to 14.8% for Class A assets. This preference stemmed from a specific tenant profile seeking cost-effective options and favouring less central locations with ample parking. This localized dynamic highlighted how regional economic factors and specific occupier profiles caused certain markets to diverge from broader national real estate patterns.
Employment and the office market
The Canadian labour market experienced a period of relative stagnation in the first quarter of 2026, with the national unemployment rate plateauing at 6.7%. According to Statistics Canada’s latest Labour Force Survey (LFS), this rate remained virtually unchanged on a year-over-year basis, reflecting a broader economic cooling characterized by decelerated hiring rather than increased layoffs. Sectoral performance remained mixed throughout the quarter, while finance, insurance, real estate, rental, and leasing sectors faced headwinds, the “other services” and natural resources industries continued to expand. Moreover, growth in professional, scientific, and technical services and public administration provided a counterbalance to weakness in other white-collar segments.
It was observed that these fundamentals served as a primary indicator for commercial space demand. While the momentum of 2025 established a foundation of optimism, the mixed performance in early 2026 suggested a nuanced outlook. Robust growth in professional, scientific and technical services helped sustain activity in urban centres, though this was structurally challenged by the enduring preference for hybrid work and space efficiency. These forces continued to limit the volume of square footage required per employee, further decoupling traditional job gains from physical occupancy rates.
Market dynamics were further influenced by a significant shift in workplace directives. Throughout the quarter, both public and private sectors intensified return-to-office mandates, emphasizing the office as a hub for collaboration and culture. Consequently, the driver of office demand transitioned from total headcount to asset quality, where premium Class A environments became essential tools for talent retention in a stabilizing yet competitive labour landscape.
National office completions and new supply dynamics
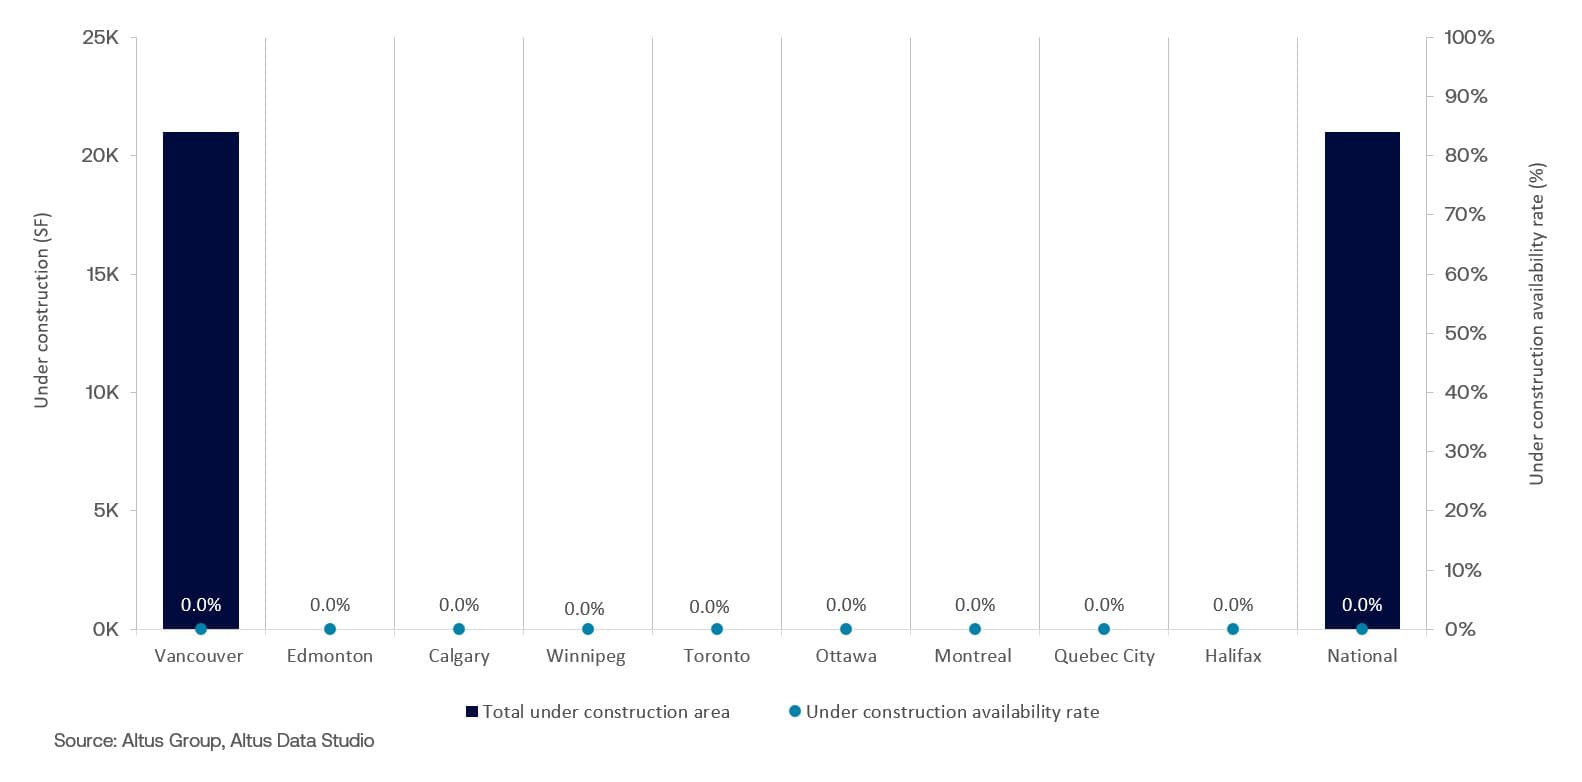
Canada saw the completion of one new fully leased office space, totalling 21,000 square feet, located in a mixed-use building in Vancouver, British Columbia (Figure 2). The absence of new supply in the development pipeline has facilitated gradual absorption and contributed positively to the general downward trend in the availability rates.
Figure 2: Office completions and availability (Q1 2026)
National office construction pipeline
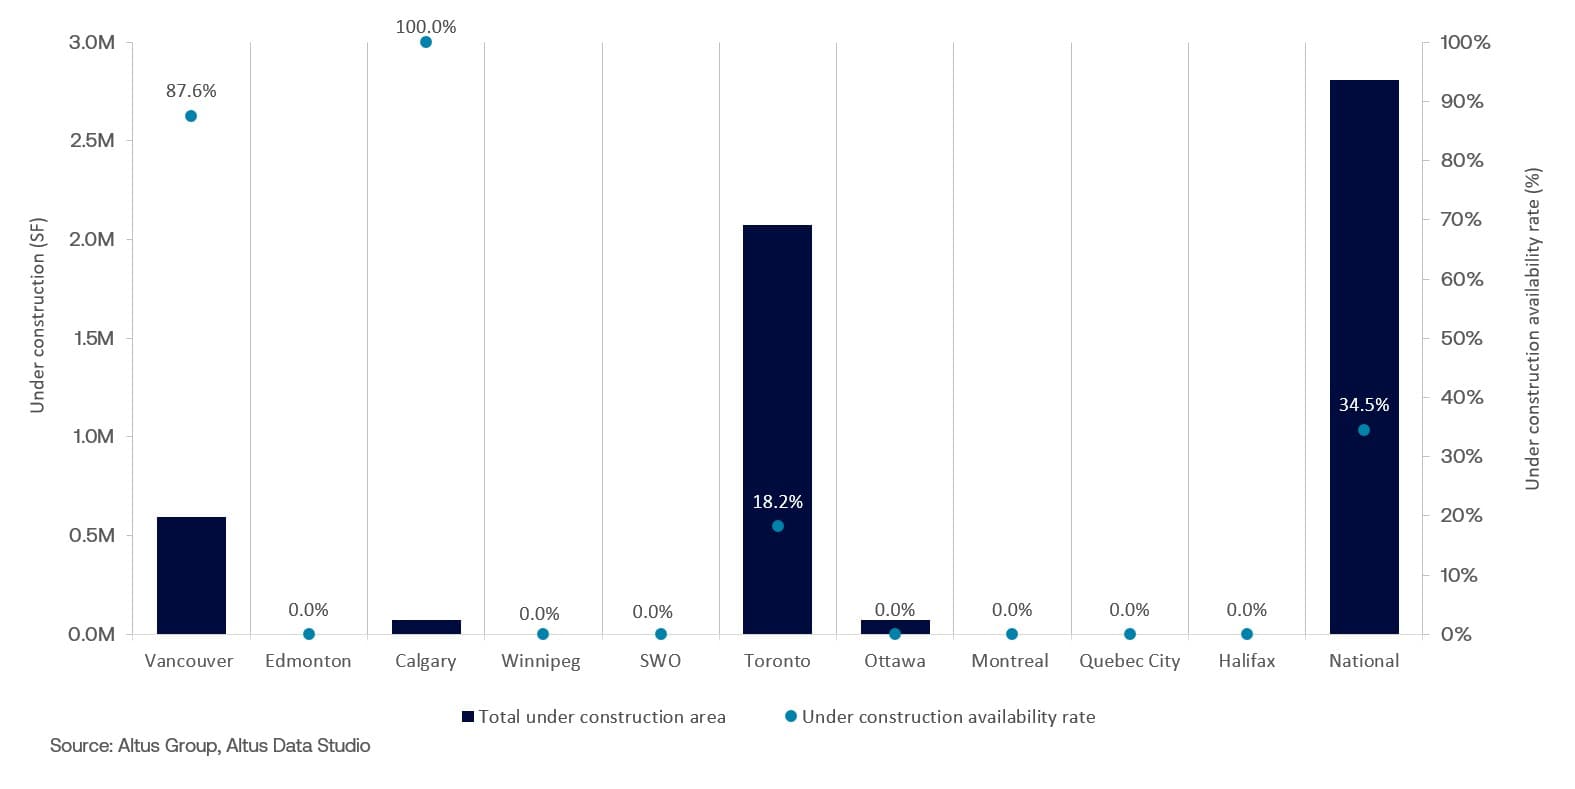
The national office construction pipeline reached a multi-year low, with 17 buildings totalling approximately 2.8 million square feet under development (Figure 3). This pronounced slowdown in new supply was met with selective but sustained demand, as 34.5% of the inventory was pre-leased before completion. Vancouver and Toronto remained the primary hubs of development activity. Vancouver’s eight projects totalled over 592,000 square feet with 87.6% availability, while Toronto’s seven projects comprised nearly 2.1 million square feet with a significantly lower availability rate of 18.2%.
Figure 3: Office under construction and availability (Q1 2026)
The continued contraction of the development pipeline created challenges for tenants seeking premium contiguous space, as the heightened demand for Class AAA assets increasingly spilled over into well-maintained and located Class A and, in smaller markets, Class B properties. This trend drove higher occupancy and lower vacancy rates across existing buildings as tenants were forced to look beyond the dwindling supply of new inventory. Consequently, the market signalled a strategic pivot from new construction toward repositioning of existing assets, where capital was increasingly directed at upgrading older properties to meet modern corporate requirements.
Looking ahead
The first quarter of 2026 concluded with a stabilized outlook for the Canadian office sector, as the robust leasing momentum established throughout 2025 translated into a more resilient investment landscape. Investor sentiment, which had previously been characterized by cautious capital deployment, shifted toward a more positive stance as clear evidence of market rebalancing emerged across primary urban cores. This renewed confidence was underpinned by sustained demand for Class AAA assets and strategic inventory withdrawals, such as Calgary’s conversion initiatives, which signalled a sophisticated long-term approach to supply management.
Looking ahead, the market was positioned for a period of supply-side tightening. As the pipeline of new completions remained disciplined, competition for contiguous blocks of premium space was anticipated to intensify, potentially exerting upward pressure on effective rents in top-tier submarkets. Furthermore, the continued integration of wellness-focused amenities and ESG-compliant infrastructure was projected to further bifurcate the market and reward owners who prioritized asset modernization. By the close of the quarter, the convergence of strong corporate mandates and a more predictable monetary policy suggested that the Canadian office market had entered a stabilized phase in its recovery cycle, establishing a firm foundation for the remainder of the year.
Want to be notified of our new and relevant CRE content, articles and events?
Disclaimer
This publication has been prepared for general guidance on matters of interest only and does not constitute professional advice or services of Altus Group, its affiliates and its related entities (collectively “Altus Group”). You should not act upon the information contained in this publication without obtaining specific professional advice.
A number of factors may influence the performance of the commercial real estate market, including regulatory conditions and economic factors such as interest rate fluctuations, inflation, changing investor sentiment, and shifts in tenant demand or occupancy trends. We strongly recommend that you consult with a qualified professional to assess how these and other market dynamics may impact your investment strategy, underwriting assumptions, asset valuations, and overall portfolio performance.
No representation or warranty (express or implied) is given as to the accuracy, completeness or reliability of the information contained in this publication, or the suitability of the information for a particular purpose. To the extent permitted by law, Altus Group does not accept or assume any liability, responsibility or duty of care for any consequences of you or anyone else acting, or refraining to act, in reliance on the information contained in this publication or for any decision based on it. The distribution of this publication to you does not create, extend or revive a client relationship between Altus Group and you or any other person or entity. This publication, or any part thereof, may not be reproduced or distributed in any form for any purpose without the express written consent of Altus Group.
Authors

Jennifer Nhieu
Senior Research Analyst
Authors
Jennifer Nhieu
Senior Research Analyst
Resources
Latest insights