How much does inflation distort the trend toward larger CRE deals?
Learn which US CRE sectors have genuinely shifted toward larger deals, and which are a product of pricing thresholds that haven't been adjusted for inflation.
How much does inflation distort the trend toward larger CRE deals?
Learn which US CRE sectors have genuinely shifted toward larger deals, and which are a product of pricing thresholds that haven't been adjusted for inflation.
Author

Cole Perry
Associate Director of Research, Altus Group
Key highlights:
2025 saw the return of "large deals" in US commercial real estate, defined as those exceeding $10 million, with the share of total transaction value attributed to such deals reaching a post-COVID high in Q3
Though transaction trends saw an uptick in large deals, the nominal figure for a deal to be in that pricing tier has not moved in 26 years; accounting for inflation, a $10 million deal in 2026 is equivalent to a $5.2 million deal in 2000
Adjusting for inflation, industrial's shift toward large deals holds up cleanly, multifamily's trend toward large deals holds over the long run despite a rate-cycle interruption, and office's apparent rise nearly disappears
For hospitality and retail, the adjustment tells a different but equally important story: hospitality's large-deal share concentration was always structural and genuine, while retail's mid-market dominance is confirmed as real rather than a measurement artifact
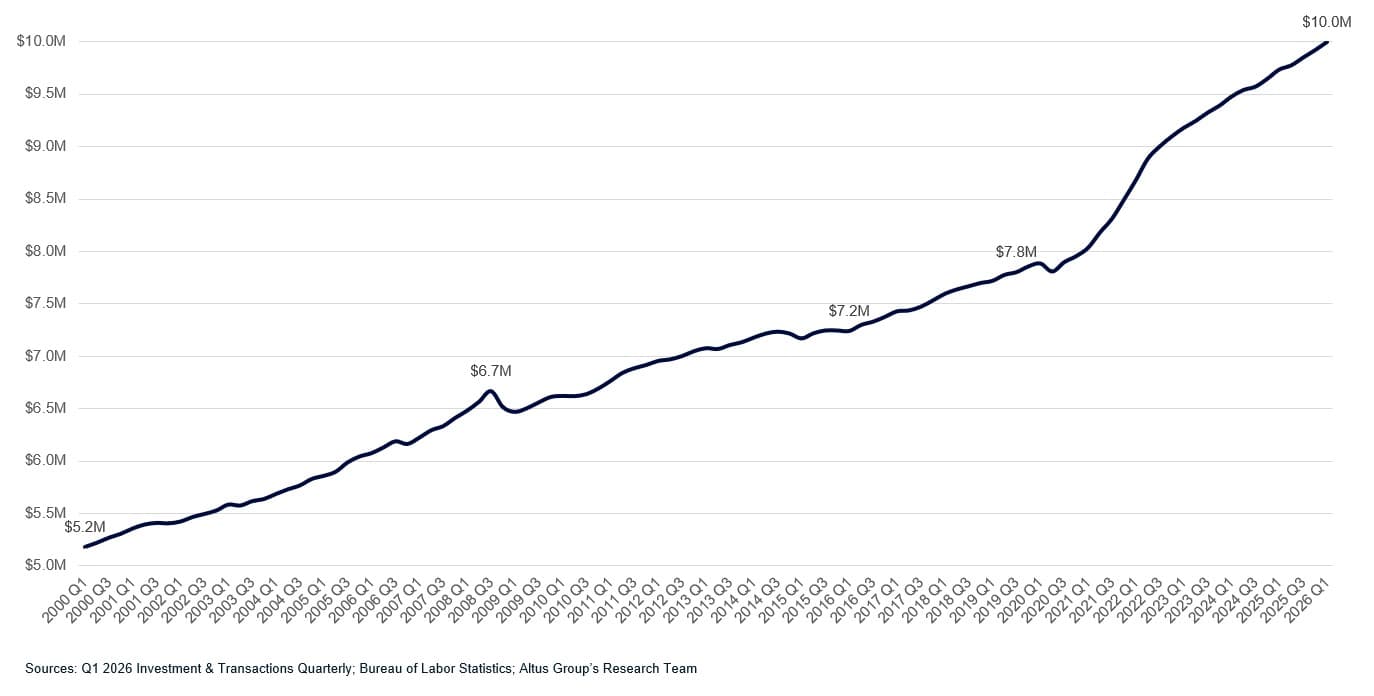
In Q3 2025, the share of aggregate single-property deal value coming from transactions above $10 million reached a post-COVID high, suggesting a recovery led by larger transactions. The measure carried a caveat, however: Though a $10 million deal is the conventional dividing line between a mid-market and a large commercial real estate (CRE) transaction, the threshold has not been updated for at least 26 years. The problem is that $10 million in 2026 buys considerably less real estate than it did in 2000; this has consequences for how we read the recent resurgence of large deals as a share of total transaction value.
Adjusting for inflation helps to properly reframe the threshold for what should be considered a small, medium, and large CRE deal. In Consumer Price Index (CPI) terms, a $10 million deal today is worth roughly what a $5.2 million deal was in 2000. This analysis revisits the measure and adjusts it for inflation, separating what is real from what is merely “bracket creep”, the tendency for the figure to edge up mechanically as rising prices leave a fixed dollar threshold behind. Restating each deal in constant dollars holds the line steady in real terms:
Where the large-deal share flattens after that adjustment, the apparent rise was inflation
Where it still climbs, the shift is real
Being able to identify the difference is important because “large-deal” share is widely read as a proxy for institutional confidence. If part of that share is growing mechanically instead of behaviorally, then acting on it without adjustment risks misreading where capital is actually going.
Note: The following is an analysis of the composition of deals clearing the market, so the trends below should read as a description of transaction activity rather than a direct measure of value changes.
Figure 1: Real value of $10M over time (Q1 2026 dollars)
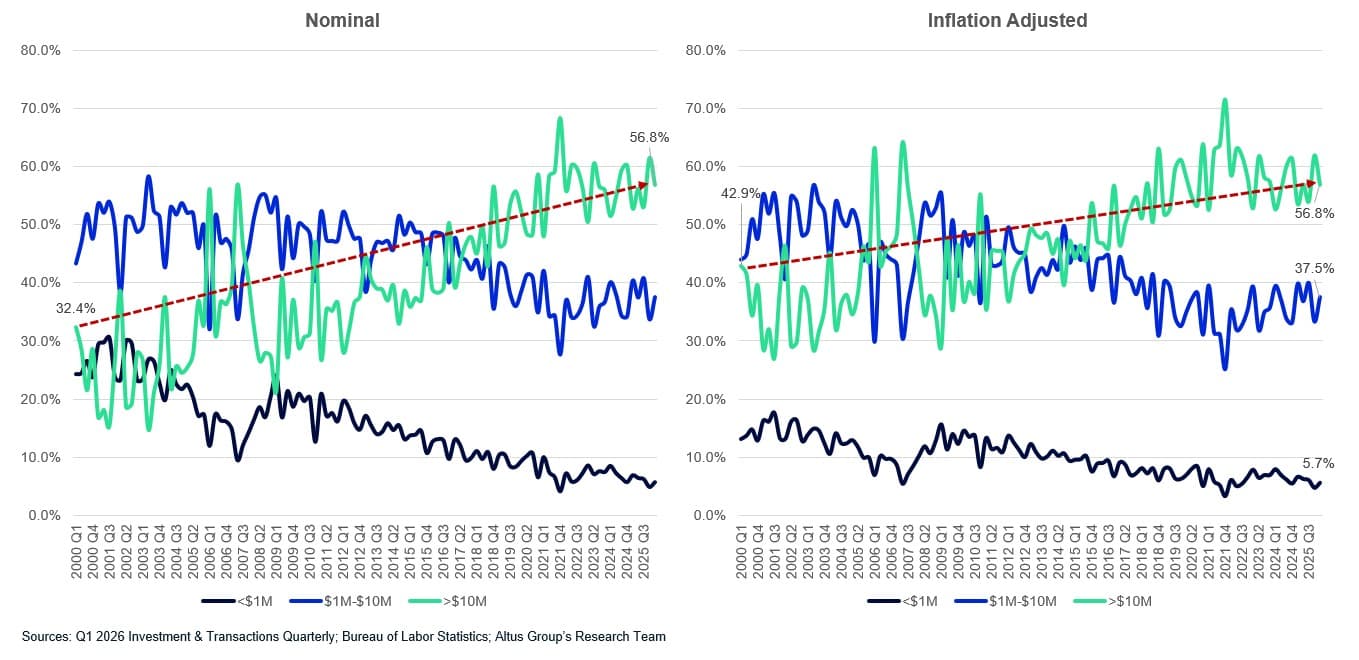
The charts below show the share of total single-property transaction value in three buckets:
Small deals: under $1 million
Mid-sized deals: $1 million to $10 million
Large deals: More than $10 million
Each sector is shown twice: nominal versus restated in constant dollars. The gap between them is bracket creep.
Industrial's move into large deals is real
Nominal shift vs. inflation-adjusted shift: Holds up fully
Industrial is the one sector where the inflation adjustment changes almost nothing. Its real above-$10M share is up 14.0 points since 2000 and 9.7 points over the last decade — the only sector gaining in real terms over both horizons. The rise in large-deal share is not a measurement artifact; it reflects genuine price appreciation, pulling more industrial deals across the threshold in real terms. The mid-market has also expanded since the pandemic, with the $1M-$10M bucket gaining real share, in line with the broader growth of the logistics market.
Figure 2: Industrial transaction value by deal size bucket (%)
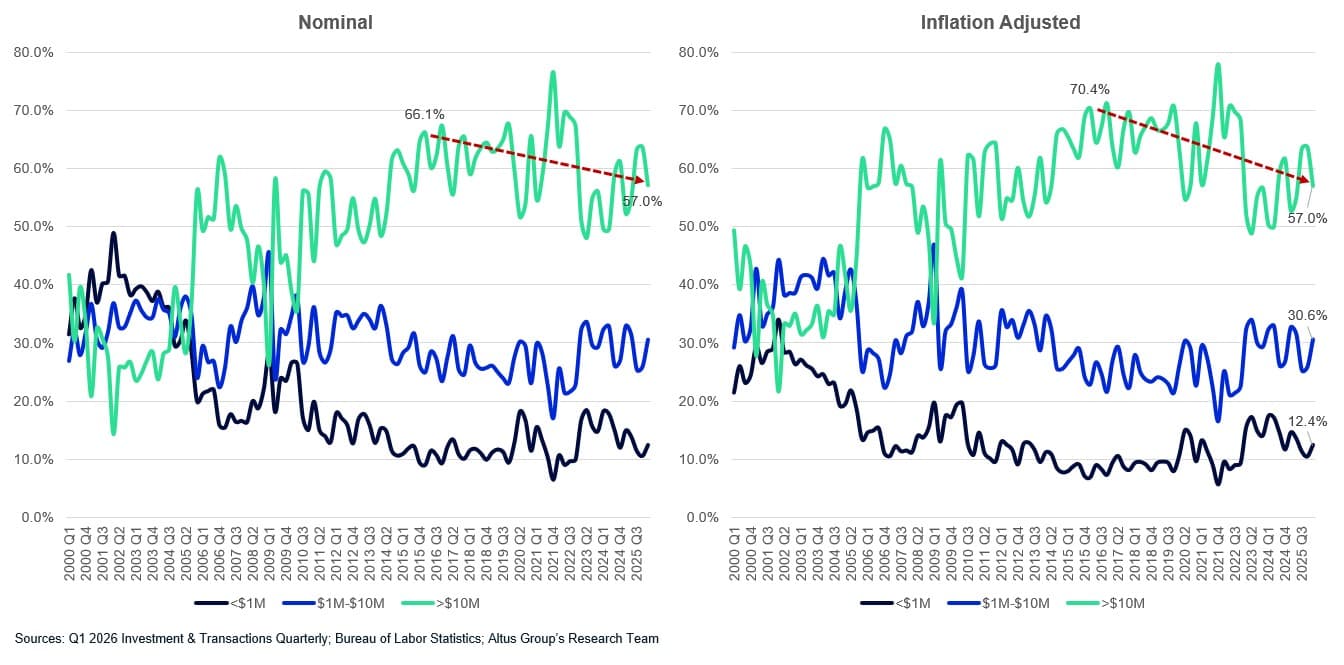
Multifamily matured, then repriced
Nominal shift vs. inflation-adjusted shift: Holds up over the long run, interrupted by the rate cycle
Multifamily saw a clear move toward larger deals through over the long run, but the rate cycle since 2022 introduced a visible interruption. In real terms its above-$10M share is up 7.6 points since 2000, which confirms the long run move is genuine. But when taking a closer look at the last decade, the picture inverts: the real share is down 13.3 points, coinciding with the higher-rate environment that began in 2022. The share has since recovered to 57.0%, leaving the longer-run move toward large deals intact while the recent cycle remains clearly visible.
Figure 3: Multifamily transaction value by deal size bucket (%)
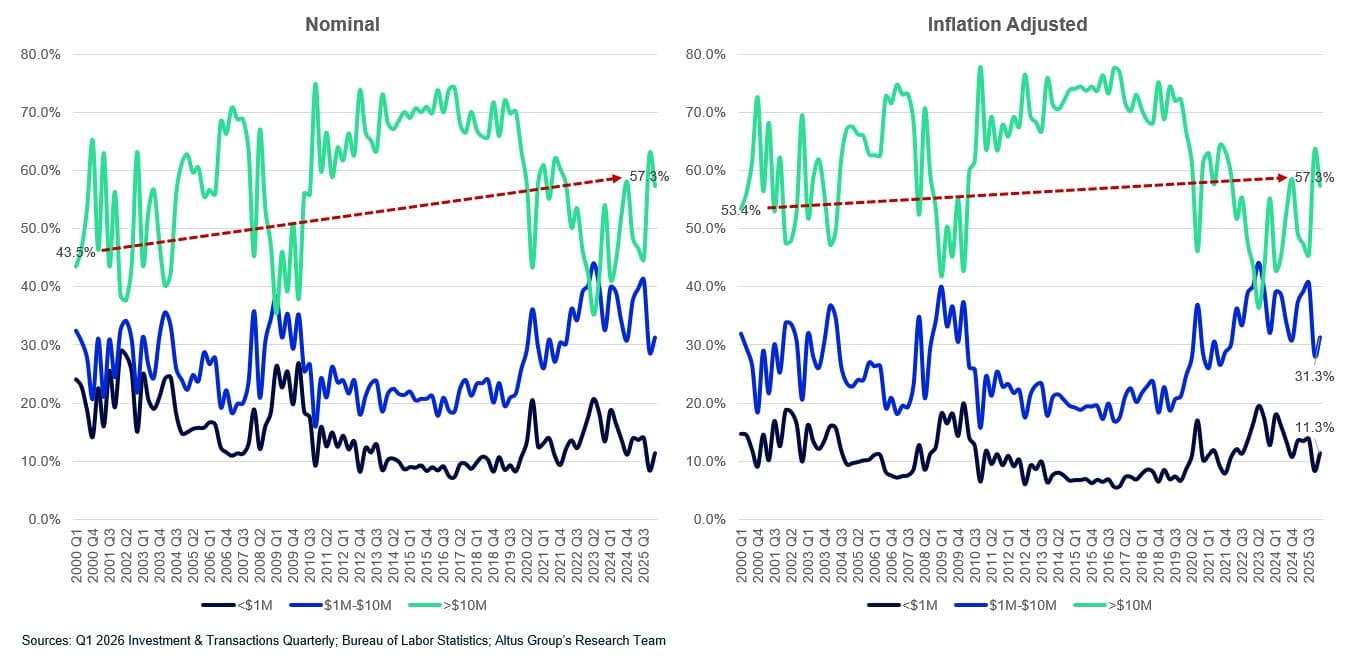
Office's large deal share has fallen in real terms
Nominal shift vs. inflation-adjusted shift: Does not hold up, most of the apparent rise was bracket creep
Office is the clearest case where the inflation adjustment exposes the nominal picture as misleading. Its above-$10M share is up 13.8 points since 2000 in nominal terms but just 3.9 in real terms; almost the entire apparent rise was bracket creep. On a constant-dollar basis the share has actually fallen 16.3 points over the last decade, with fewer of the dollars spent on office properties coming from large transactions. The pattern is consistent with the sector's well-documented post-COVID demand challenges. The one counterpoint worth noting: the large-deal bucket is still up 8.1 points year over year, the strongest rebound of any sector.
Figure 4: Office transaction value by deal size bucket (%)
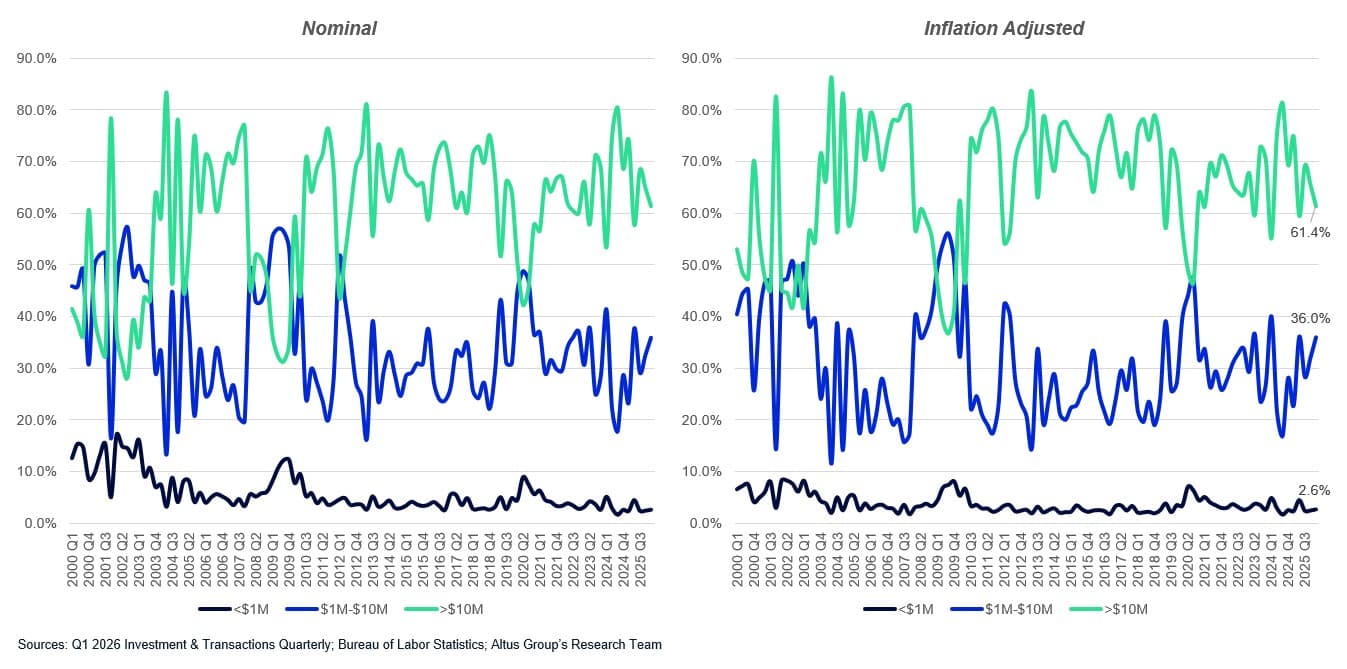
Hospitality was always a large-deal market
Nominal shift vs. inflation-adjusted shift: Large-deal dominance confirmed as structural and genuine
Hospitality required a different kind of reading than the other sectors. At 61.4%, it is the highest large-deal-concentrated sector in the dataset, but that has always been the case given the capital intensity of hotel assets. The inflation adjustment barely changes its shape: there is little real shift to explain, because the sector has been dominated by $10 million or larger deals throughout the period.
Figure 5: Hospitality transaction value by deal size bucket (%)
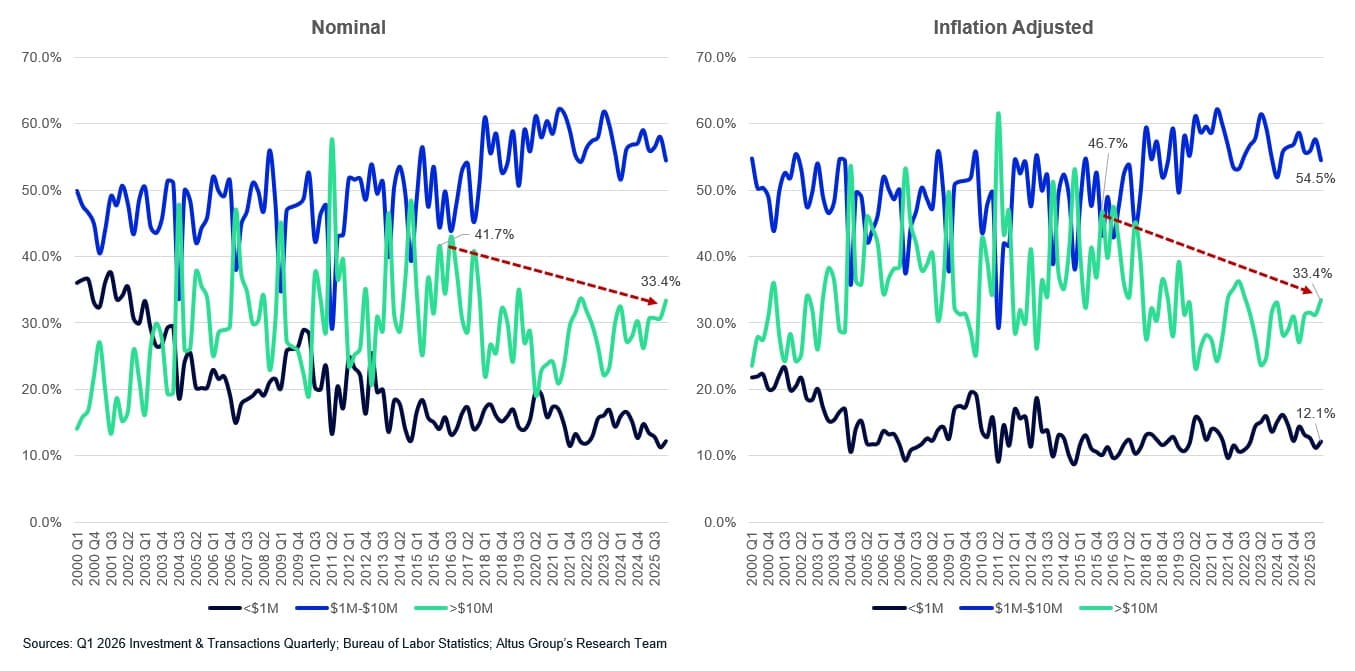
Retail is now a mid-market story
Nominal shift vs. inflation-adjusted shift: Mid-market dominance confirmed as real, and the apparent decline in small deals is bracket creep, not transactions disappearing
Retail’s story is about the middle of the market, not the top. The inflation adjustment confirms that retail’s $1M-$10M bucket’s dominance at 54.5% is structural, and consistent with retail's traditionally fragmented buyer base of net-lease and strip-center investors. Its large-deal share is up 9.9 points in nominal terms since 2000 but down 13.3 points in real terms over the decade, and much of the apparent decline in small deals is bracket creep rather than a genuine retreat.
Figure 6: Retail is now a mid-market story
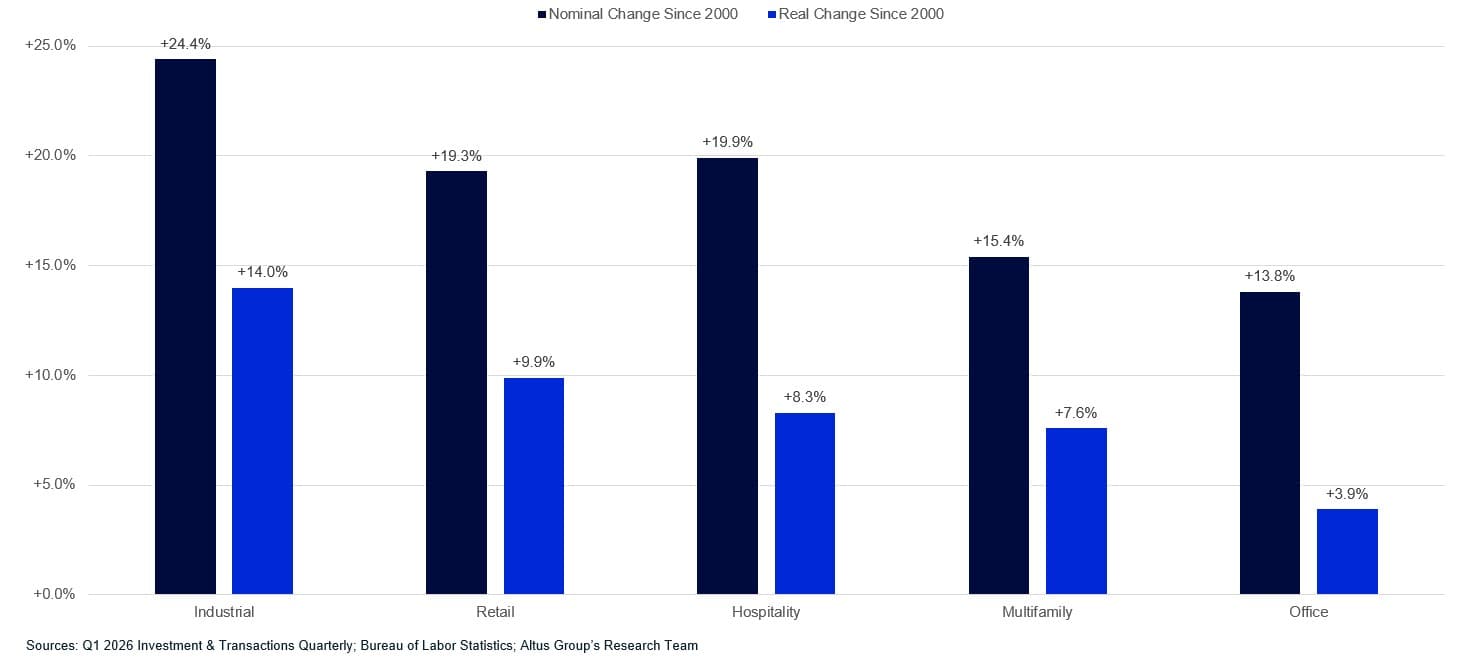
What survives adjustment
The chart below compares the nominal and inflation-adjusted change in each sector's above-$10M share since 2000. Industrial's shift stands well above the rest, while office's nearly vanishes once inflation is stripped out, with bracket creep accounting for the bulk of its apparent gain.
A few themes hold regardless of how the data is cut. Industrial's march into large deals is consistent in both nominal and real terms, reflecting the sector's long-run maturation and price appreciation. Multifamily tells a similar story over the longer horizon, even as the rate cycle of the past few years introduced a visible interruption. Office moves in the opposite direction, with its real large-deal share shrinking over the decade in a pattern that aligns with the sector's well-known structural headwinds. And retail's mid-market dominance is equally clear in both views, with the $1M to $10M bucket holding its ground as the sector's defining transaction tier.
Figure 7: Change in share of transacted value in deals above $10 million: Since Q1 2000, nominal vs. CPI-adjusted (percentage points)
Measuring by share of deal size is only a reliable signal if you account for what the threshold is actually measuring over time. Adjust for inflation, the market looks different, and in some sectors the narrative flips entirely.
Explore the full data
Deal-size composition is one of many metrics tracked in the Q1 2026 US CRE Investment and Transactions Quarterly Report. For a deeper look at transaction volume, pricing, and market composition across property types, view the full report.
Want to be notified of our new and relevant CRE content, articles and events?
Disclaimer
This publication has been prepared for general guidance on matters of interest only and does not constitute professional advice or services of Altus Group, its affiliates and its related entities (collectively “Altus Group”). You should not act upon the information contained in this publication without obtaining specific professional advice.
A number of factors may influence the performance of the commercial real estate market, including regulatory conditions and economic factors such as interest rate fluctuations, inflation, changing investor sentiment, and shifts in tenant demand or occupancy trends. We strongly recommend that you consult with a qualified professional to assess how these and other market dynamics may impact your investment strategy, underwriting assumptions, asset valuations, and overall portfolio performance.
No representation or warranty (express or implied) is given as to the accuracy, completeness or reliability of the information contained in this publication, or the suitability of the information for a particular purpose. To the extent permitted by law, Altus Group does not accept or assume any liability, responsibility or duty of care for any consequences of you or anyone else acting, or refraining to act, in reliance on the information contained in this publication or for any decision based on it. The distribution of this publication to you does not create, extend or revive a client relationship between Altus Group and you or any other person or entity. This publication, or any part thereof, may not be reproduced or distributed in any form for any purpose without the express written consent of Altus Group.
Author
Cole Perry
Associate Director of Research, Altus Group
Resources
Latest insights