Where the Boomers are going, and why supply hasn't caught up
A data-driven look at the suburban senior housing opportunity in America's fastest-growing counties.
Where the Boomers are going, and why supply hasn't caught up
A data-driven look at the suburban senior housing opportunity in America's fastest-growing counties.
Author

Adam Mauro, CFA
Senior Manager, Valuation Advisory
Key highlights:
Senior housing net absorption has outpaced new supply for 18 consecutive quarters, and the industry must add roughly 800,000 units by 2030 just to maintain 90% occupancy at a scale no current pipeline comes close to addressing
The counties absorbing the largest 80+ senior inflows are fast-growing suburban markets outside Raleigh, Dallas, Denver, and Jacksonville, where proximity to adult children is the primary relocation driver
Developers and capital allocators relying on MSA-level data risk missing the most compelling submarket opportunities entirely, as county-level supply gaps in places like Douglas County, Colorado reveal pockets of severe undersupply hidden behind metro-wide averages
The conventional wisdom in senior housing has long centered on familiar retirement corridors: coastal Florida, metro Phoenix, the Sun Belt. And for good reason. Those markets built the industry's playbook over three decades. But the data tells a different story now. The oldest Boomers turned 80 in 2026, and the counties absorbing this wave aren't the ones investors have been watching traditionally. They're suburban growth engines outside Raleigh, Jacksonville, Austin, Denver, and Dallas; places where seniors are moving to be closer to their adult children, not to retire in a warm climate.
The problem is that senior housing supply hasn't followed.
A national crisis in slow motion
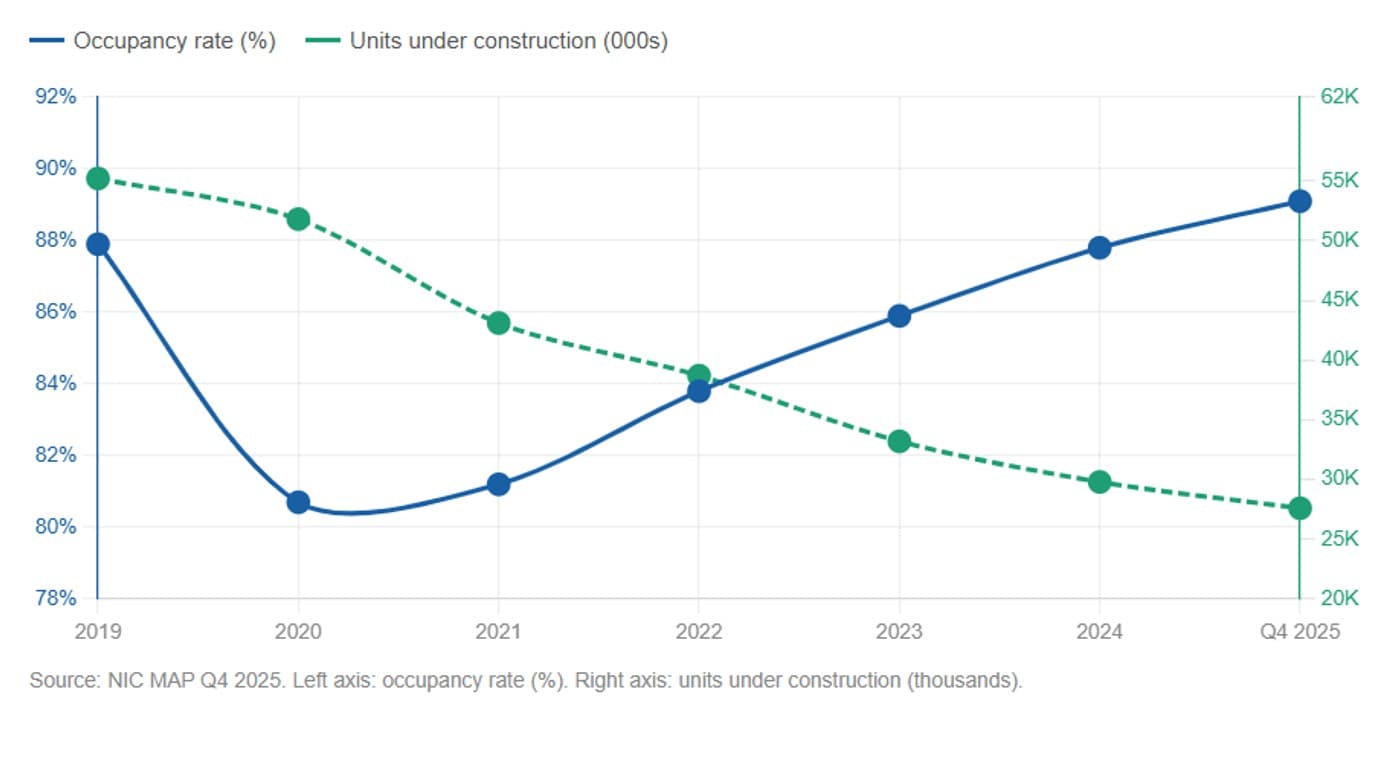
The headline numbers from the National Investment Center for Seniors Housing & Care (NIC MAP) tell a stark story. By Q4 2025, senior housing occupancy across NIC's 31 Primary Markets had risen to 89.5%, the highest level in 18 consecutive quarters of recovery. Independent living crossed 90% for the first time since 2019. Demand is not the constraint, supply is.
Units under construction fell to roughly 27,600 in late 2025, the lowest quarterly figure since Q2 2009. New inventory grew less than 1% year-over-year. Net absorption — the number of units actually being leased — has outpaced new supply for 18 consecutive quarters. NIC projects the industry must add more than 200,000 units by 2028 and roughly 800,000 units by 2030 just to maintain 90% occupancy. At an annual increase of 3% - 4%, the rise of the 80+ population will be an estimated 36–48% this decade.
The gap between demographic demand and available inventory is the defining investment story in senior housing right now. The question is where, specifically, that gap is widest.
Figure 1: Occupancy rising, construction falling – the national supply-demand scissors
The migration shift: suburban counties are the new retirement destinations
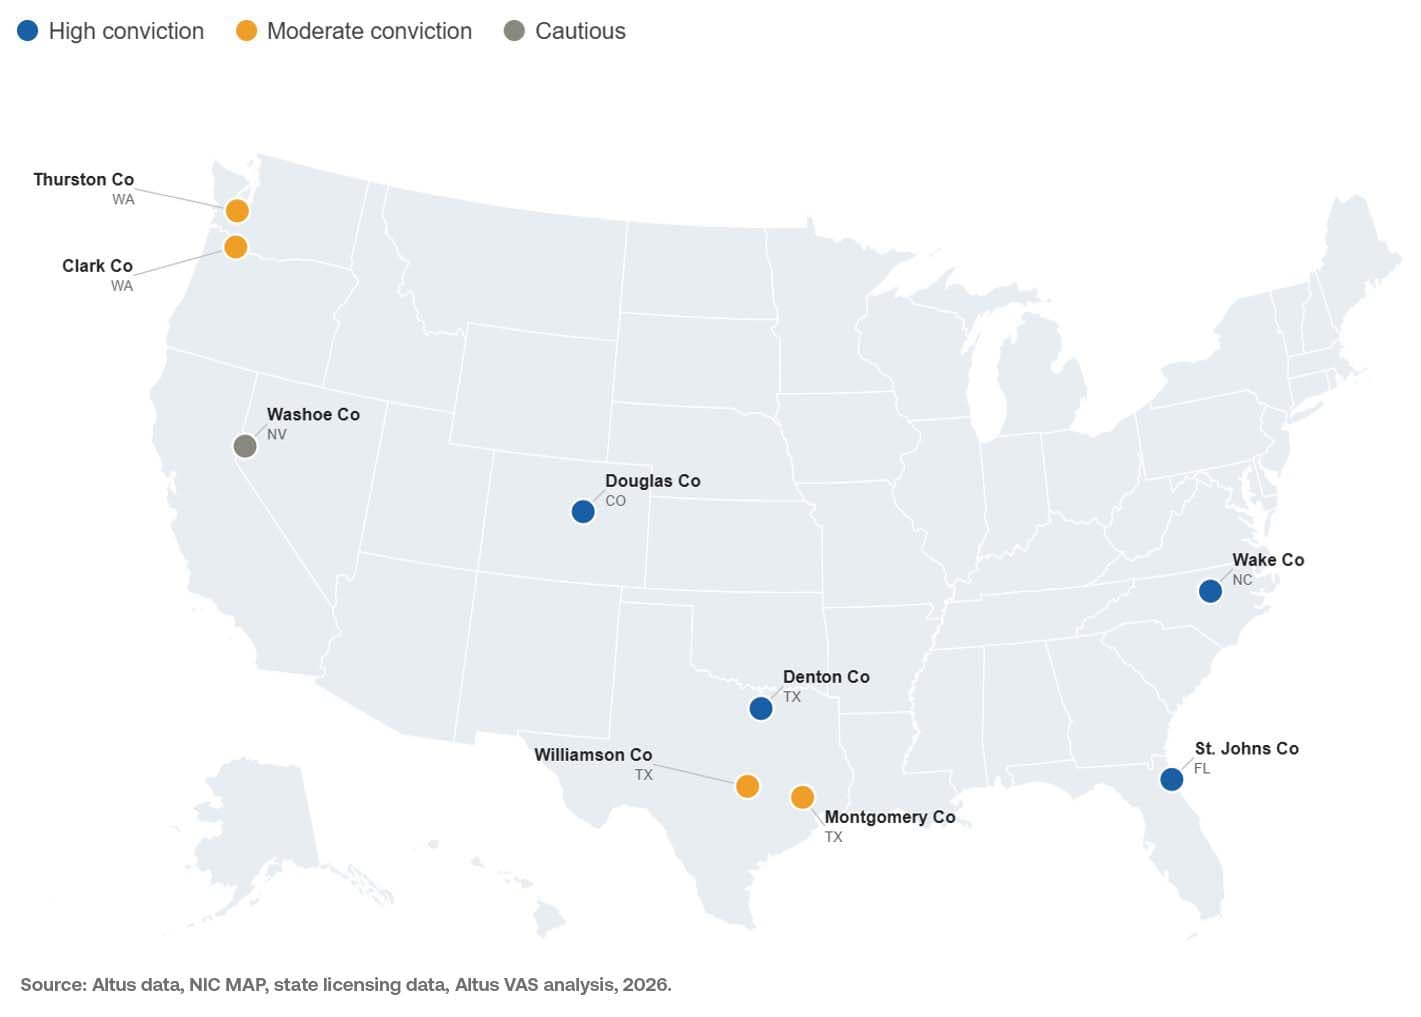
To identify where senior housing demand is most compelling, we utilized Altus data to screen all 3,100+ US counties against a rigorous, data-driven filter. Counties were required to meet two criteria simultaneously:
First, they had to rank at the 90th percentile or higher on both population growth and net migration for the 80+ and 85+ age cohorts, meaning they sit in the top 10% of all U.S. counties on each of these measures. This dual filter ensures we're identifying markets with both a large existing senior population growing rapidly in place and a meaningful inflow of new seniors arriving from elsewhere.
Second, the adult child cohort (age 40–59) in each county had to rank at the 91st percentile or higher nationally for household net worth, confirming that the families supporting these seniors have the financial capacity to afford premium care.
Nine counties cleared both thresholds. The result is a shortlist of markets that are simultaneously elite-tier migration destinations, high-growth senior population centers, and home to some of the wealthiest working-age households in the country.
Figure 2: US suburban counties matching our retirement destination criteria
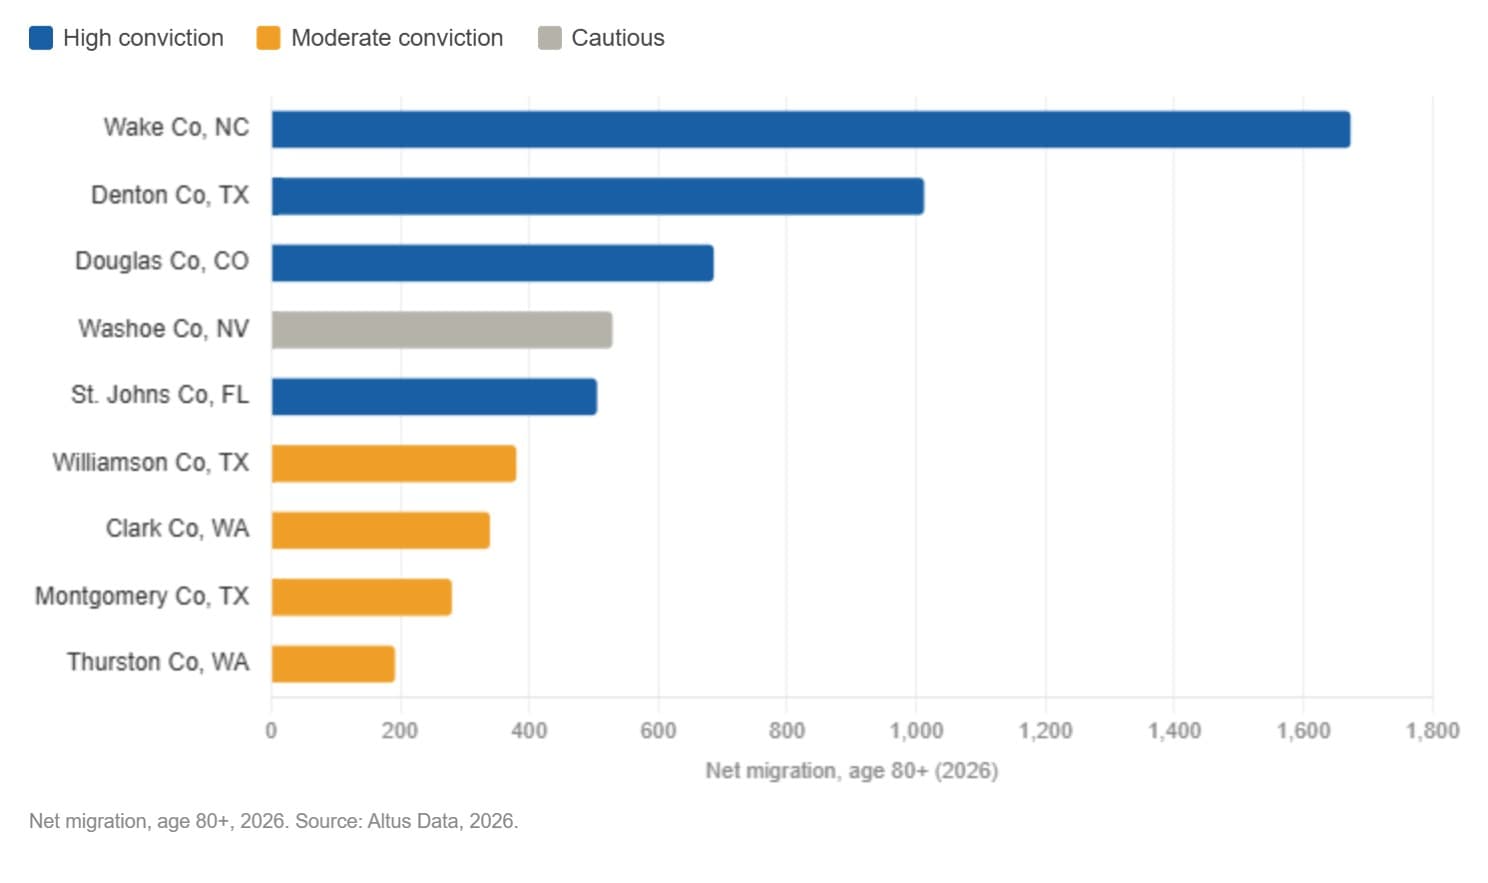
Using Altus’ county-level migration data, net migration figures reveal that the strongest inflows are increasingly concentrated in suburban counties surrounding major Sun Belt and Mid-Atlantic metros, rather than the traditional coastal retirement clusters:
Wake County, North Carolina (Raleigh-Cary) absorbed 1,673 net migrants aged 80+ in 2026
Denton County, Texas (Frisco, Flower Mound, north Dallas) absorbed 1,012
Washoe County, Nevada (Reno) absorbed 529
St. Johns County, Florida (Ponte Vedra Beach, Nocatee) absorbed 505, a remarkable figure for a county with roughly one-tenth the population of Miami-Dade
Figure 3: Net migration, age 80+: all nine study counties rank in the top 10% nationally
The adult child factor: a variable most analyses ignore
The standard framework for evaluating senior housing demand focuses on the 75+ or 80+ population:
Size
Growth rate
Income
Wealth
Each of the mentioned variables is necessary but insufficient. Senior housing decisions are rarely made by seniors alone. Adult children, typically in their 40s and 50s, are the most influential actors in the care transition. They initiate conversations, evaluate communities, and in a significant portion of cases, co-fund or fully fund the cost of care.
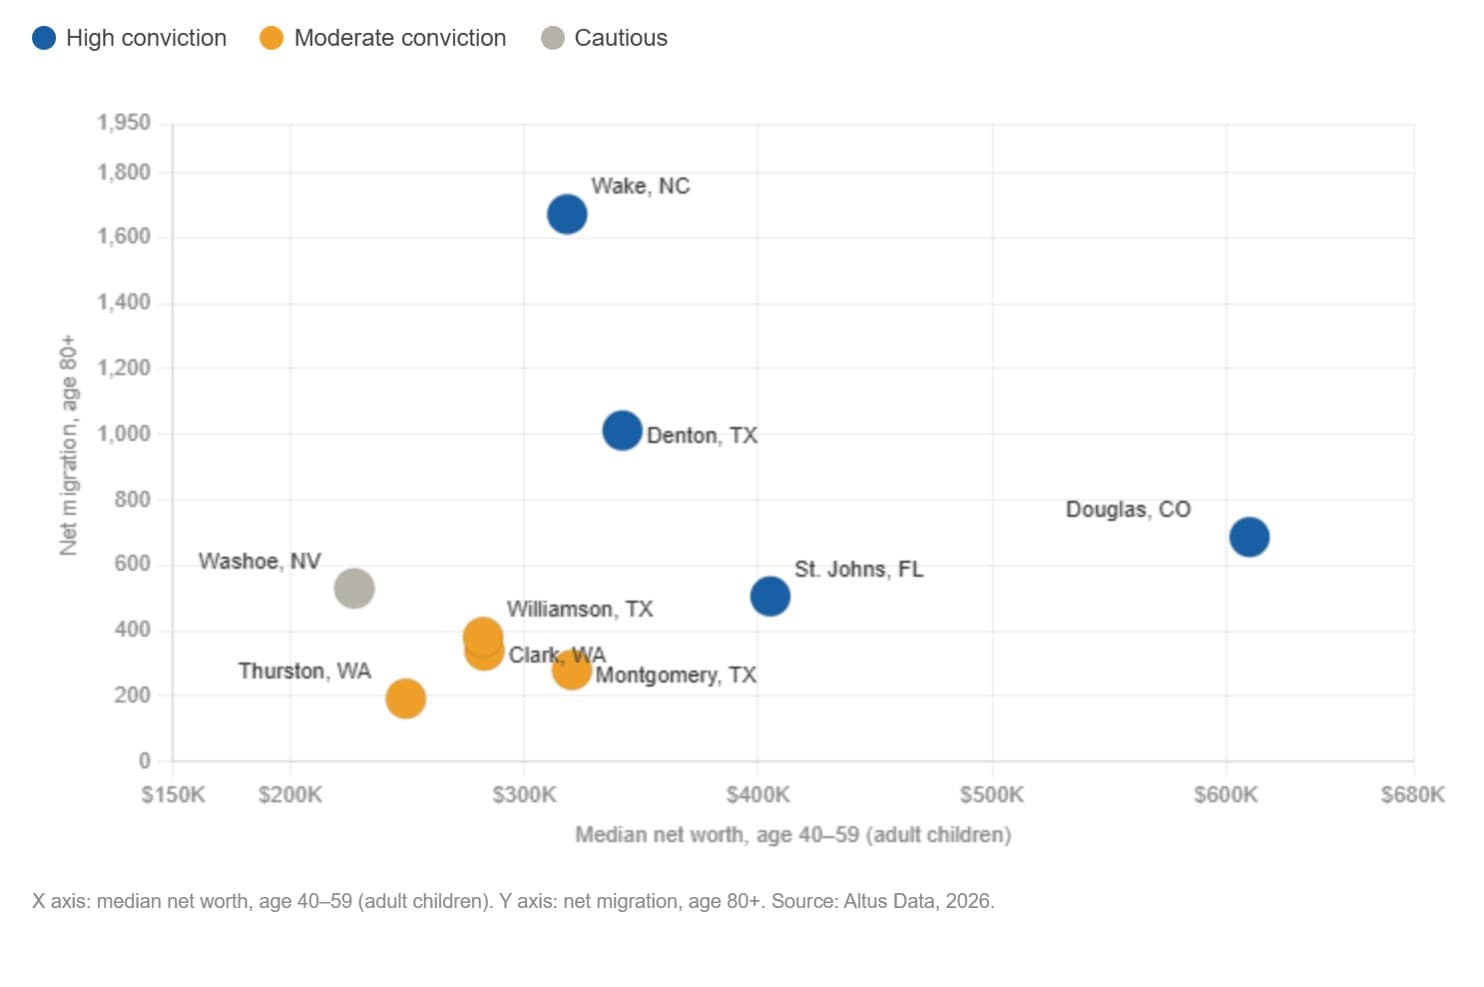
That is why adult child wealth was embedded directly into the county selection screen. All nine counties in this study were required to rank at the 91st percentile or higher nationally for median household net worth among the 40–59 age cohort; a deliberate filter designed to ensure that the markets identified are not just demographically active, but financially capable of supporting high-quality, private-pay senior housing at scale.
The results confirm that the counties absorbing the most 80+ migrants are, in many cases, the same counties where the 40–59 cohort is among the wealthiest in the country.
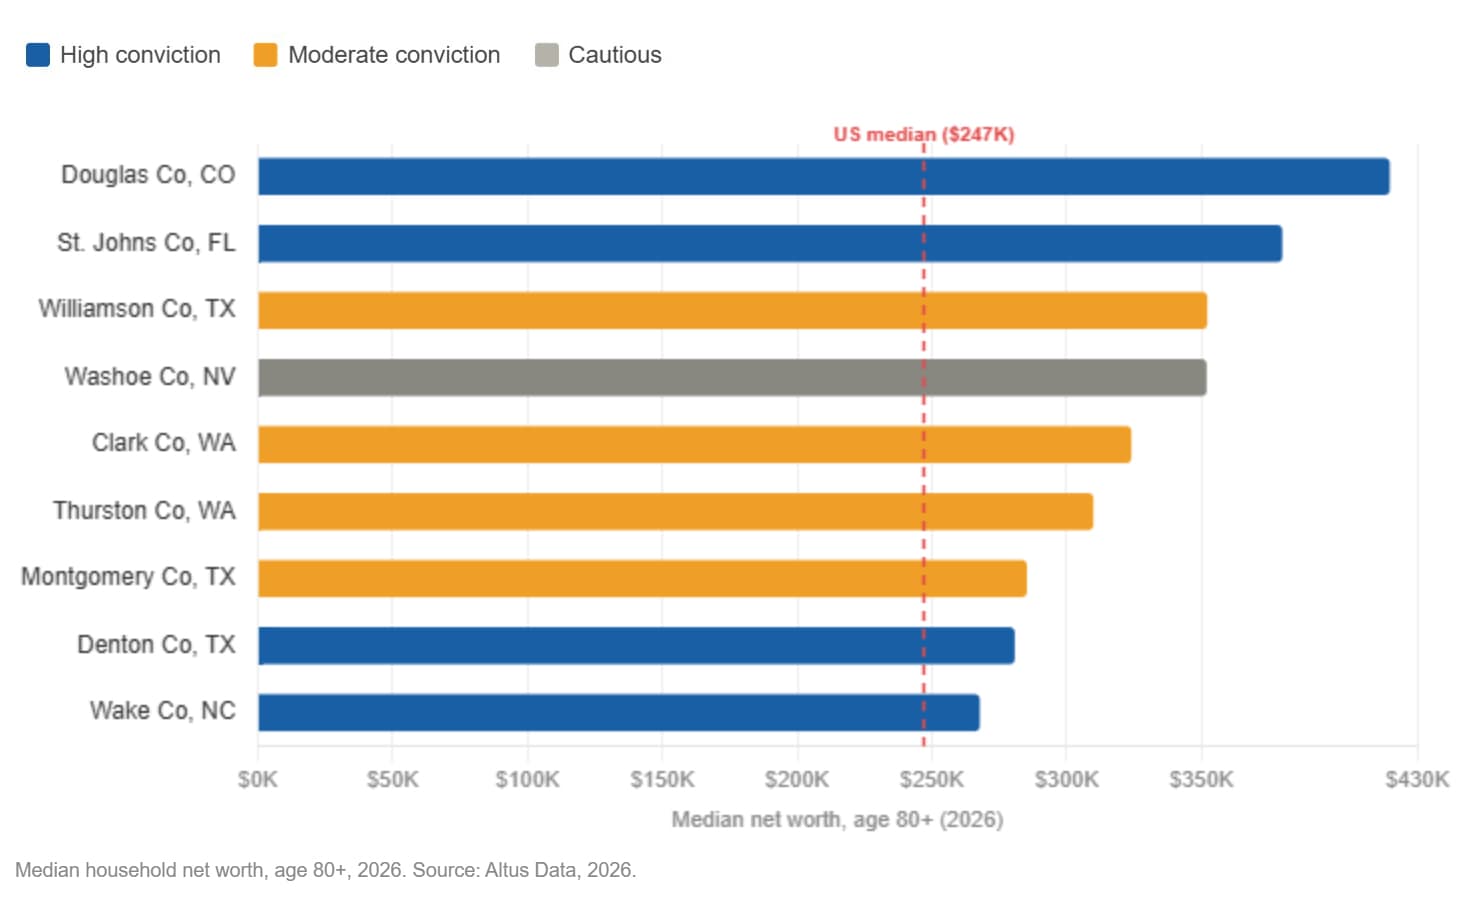
Douglas County, Colorado (Parker, Castle Rock, Highlands Ranch) has a median net worth of $610,000 for the 40–59 cohort representing the 99.7th percentile nationally. St. Johns County, Florida sits at $405,000 (98.6th percentile). Denton County, Texas at $342,000 (97.9th percentile). Even the lowest-ranking county in the study set, Washoe County, Nevada, sits at the 91.1st percentile nationally with a median adult child net worth of $227,000.
Figure 4 – Adult child wealth vs. senior migration: every study county exceeds national medians on both axes
An additional data point to review is the income of the seniors moving to these regions. Every county highlighted above exceeds the national median net worth for the 80+ cohort of $247,000. Douglas County seniors hold a median net worth of $420,000 - 70% above the national benchmark - while St. Johns County and Washoe County seniors exceed $350,000. In several markets the seniors themselves are as wealthy or wealthier than their adult children. This indicates strong self-pay capacity independent of family support. For operators, this is the difference between a market that requires aggressive lease-up discounting and one where premium pricing holds.
Figure 5: Senior net worth exceeds national median in every study county
Supply is not keeping pace
Against this backdrop of surging demand and deep-pocketed customers, the supply picture in these markets ranges from modest to severely constrained.
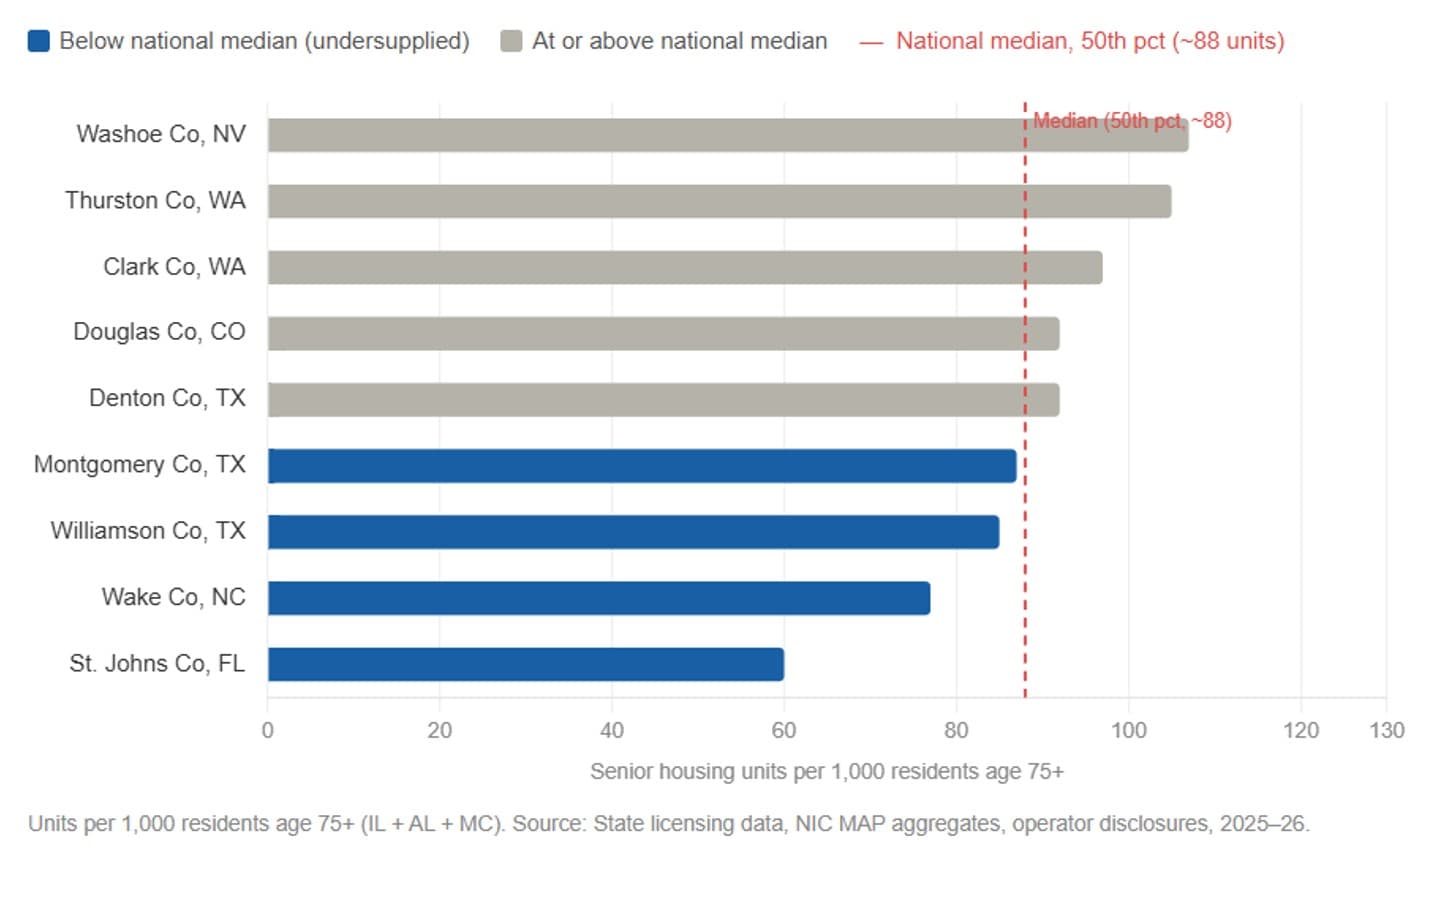
We synthesized county-level senior housing inventory from state licensing databases, operator disclosures, and NIC MAP Metropolitan Statistical Area(MSA) aggregates, and normalized it against the age 75+ population in each county. The national median penetration rate (the 50th percentile across all U.S. counties) is approximately 88 units of Independent Living(IL)/Assisted Living(AL)/Memory Care(MC) per 1,000 residents aged 75+.
St. Johns County, Florida is the most dramatic undersupply story in our study set. Despite being one of the fastest-growing and wealthiest suburban counties in Florida, the county has an estimated 60 units per 1,000 residents aged 75+, which is well below the national median. The county's senior housing landscape is dominated by age-qualified for-sale communities (Del Webb Nocatee, Cascades at World Golf Village, Parkland Preserve), not service-enriched independent living, assisted living, or memory care. A senior who ages out of active adult living has few options locally.
Wake County, North Carolina sits at approximately 77 units per 1,000, inside a Raleigh MSA where the 75+ population is growing at nearly 5% annually. The Research Triangle's economic dynamism has drawn professionals and their parents in equal measure, but assisted living construction has been minimal, average AL rents of $5,388/month in Raleigh are running well above the state average, a clear signal of pricing power meeting constrained supply.
Williamson County, Texas (Austin MSA) presents an interesting nuance. The active adult rental market has been overbuilt on Highway 130 and adjacent corridors, which has dampened overall senior housing occupancy metrics for the Austin MSA. But traditional IL/AL/MC inventory is a different story, licensing data suggest roughly 85 units per 1,000 age 75+, below the national median, in a county where the 80+ population is growing at 6% annually, one of the fastest rates in the nation.
Douglas County, Colorado has one of the most bifurcated supply pictures in our dataset. Two large Continuing Care Retirement Communities(CCRCs), Wind Crest (Erickson, Highlands Ranch) and Vi at Highlands Ranch, create a high apparent penetration near Highlands Ranch, while Parker and Castle Rock remain substantially undersupplied. Developers who look at Douglas County through an MSA-level lens will miss the submarket opportunity.
Across all nine counties in our study, bringing penetration rates to even a modest equilibrium would require an estimated 8,000–12,000 net new IL/AL/MC units over the next decade, which is well above current pipeline velocity.
Figure 6: Senior housing supply gap: units per 1,000 residents age 75+ vs. national median
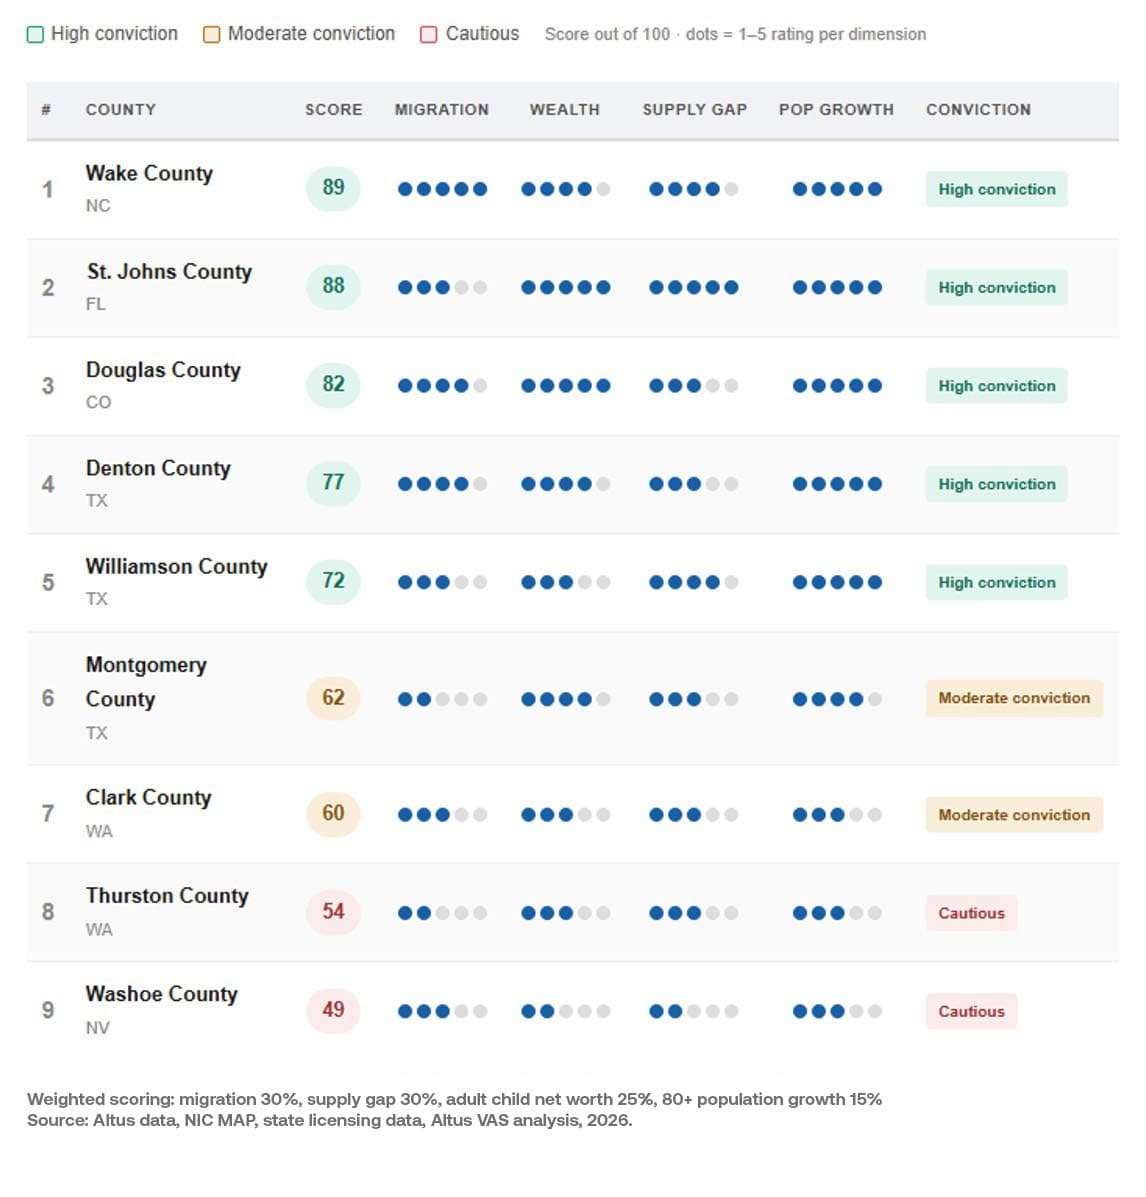
Ranking the opportunity: a multi-factor framework
Altus Valuation Advisory Services (VAS) scored each of the nine target counties across four dimensions, weighted to reflect what matters most for senior housing investment:
Senior net migration (30%) — the volume and velocity of 80+ inflows, as a proxy for lease-up addressable market
Supply gap (30%) — the deficit between current penetration and the national median
Adult child net worth (25%) — the financial capacity of the 40–59 cohort to support premium care costs
Population growth, age 80+ (15%) — the long-run demographic tailwind through 2031
High conviction markets: St. Johns County, FL, Wake County, NC, Denton County, TX, and Douglas County, CO score highest because all four dimensions align. Strong migration, thin supply, wealthy adult children, and rapid demographic growth create conditions where both development and stabilized acquisitions carry favorable risk-adjusted return profiles.
Moderate conviction markets: Williamson County, TX, Montgomery County, TX, Clark County, WA, and Thurston County, WA, have strong demographics but one softening factor in each case. Williamson sits inside an active-adult-oversupplied MSA. Montgomery County is part of the Houston metro, which has among the weakest senior housing occupancy of any major market at roughly 83–85%. Clark County and Thurston County in Washington are smaller markets with meaningful supply already relative to their scale.
Cautious markets: Washoe County, Nevada, is the most conservatively positioned of the nine. Reno's senior housing market is relatively well supplied, adult child wealth is the lowest in the group, and the migration tailwind, while present, is less powerful than in the Texas and Southeast markets.
Figure 7: Market scoring matrix: combining migration, supply gap, wealth, and population growth
What this means for capital allocation
The Boomers are not going where the conventional playbook assumed. They are following their children to the exurbs of Raleigh, to northeast Florida's master-planned communities, to the affluent suburbs of Denver and Dallas. And the senior housing infrastructure to serve them in these places is, in most cases, a decade behind the demographic reality.
For developers, the highest-conviction greenfield opportunities are in markets where annual 80+ population growth exceeds 25%, adult child wealth ranks above the 96th percentile nationally, and current penetration sits below 80 units per 1,000 for age 75+. St. Johns County, Wake County, and Williamson County clear all three bars simultaneously.
For acquirers, the opportunity is in stabilized assets in markets where supply constraints have driven occupancy above 88–89% and rent growth is outpacing inflation, a description that fits the Raleigh, Dallas-Fort Worth, and Portland (Clark County, WA) MSAs as of early 2026.
For lenders and capital partners, the demographic underpinning of these markets is as durable as any asset class in real estate. The 80+ population in the United States will not shrink for at least 25 years. The adult children supporting them are, in these specific markets, among the most financially capable households in the country. And supply is not being built at the pace required.

Boost investor confidence with independently managed valuations
Independent appraisals trusted by funds, investors, lenders, and public entities around the world.
Want to be notified of our new and relevant CRE content, articles and events?
Disclaimer
This publication has been prepared for general guidance on matters of interest only and does not constitute professional advice or services of Altus Group, its affiliates and its related entities (collectively “Altus Group”). You should not act upon the information contained in this publication without obtaining specific professional advice.
A number of factors may influence the performance of the commercial real estate market, including regulatory conditions and economic factors such as interest rate fluctuations, inflation, changing investor sentiment, and shifts in tenant demand or occupancy trends. We strongly recommend that you consult with a qualified professional to assess how these and other market dynamics may impact your investment strategy, underwriting assumptions, asset valuations, and overall portfolio performance.
No representation or warranty (express or implied) is given as to the accuracy, completeness or reliability of the information contained in this publication, or the suitability of the information for a particular purpose. To the extent permitted by law, Altus Group does not accept or assume any liability, responsibility or duty of care for any consequences of you or anyone else acting, or refraining to act, in reliance on the information contained in this publication or for any decision based on it. The distribution of this publication to you does not create, extend or revive a client relationship between Altus Group and you or any other person or entity. This publication, or any part thereof, may not be reproduced or distributed in any form for any purpose without the express written consent of Altus Group.
Author
Adam Mauro, CFA
Senior Manager, Valuation Advisory
Resources
Latest valuation insights


Jun 2, 2026
Performance under pressure: What four CRE leaders agree on, and why it starts with data