Canadian industrial market update – Q3 2026
Canada’s industrial market reached 6.2% availability in Q3 2026 amid trade uncertainty. Explore regional performance, completions and pipeline.
Canadian industrial market update – Q3 2026
Canada’s industrial market reached 6.2% availability in Q3 2026 amid trade uncertainty. Explore regional performance, completions and pipeline.
Author

Jennifer Nhieu
Senior Research Analyst
Key highlights:
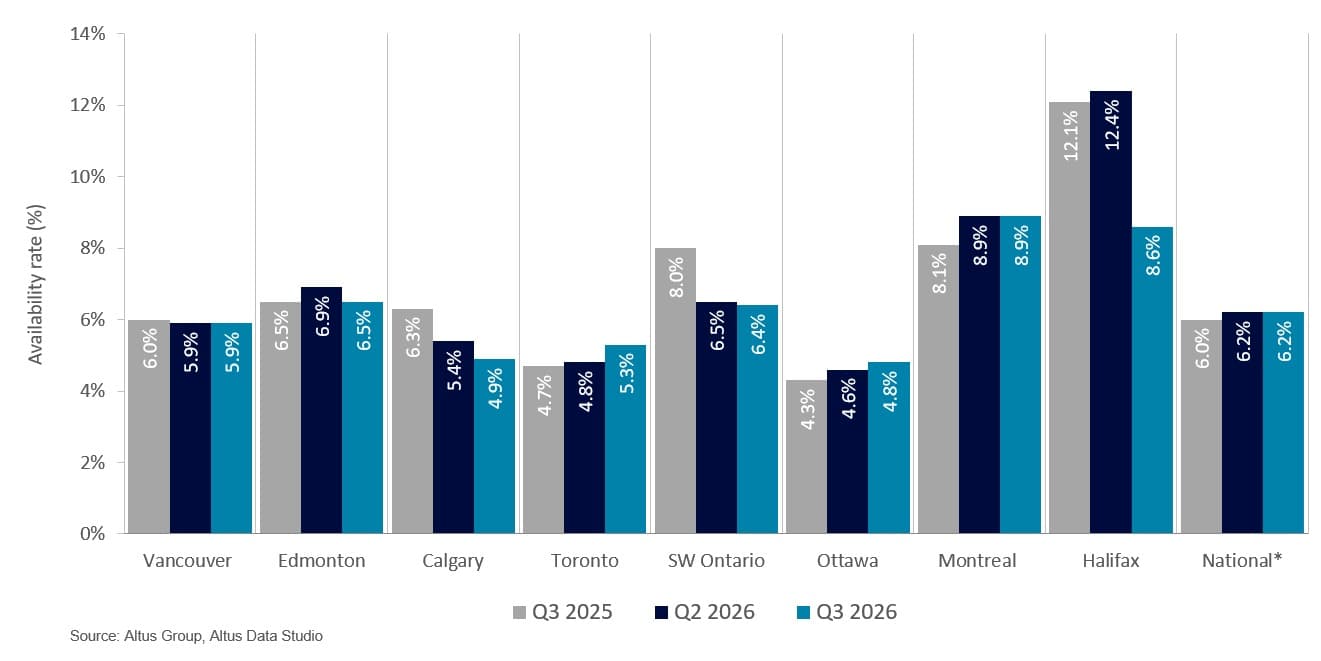
Canada’s national industrial availability rate increased by 20 basis points (bps) year-over-year to 6.2%
Eighteen new industrial buildings added approximately 3.9 million square feet to national inventory, with 61% of the completed space remaining available at quarter-end
The national industrial construction pipeline comprised 140 active projects representing nearly 28 million square feet of planned inventory, with approximately 56% available for lease
National industrial availability rose 20 bps year-over-year to 6.2% in the third quarter of 2026
National industrial availability rose 20 bps year-over-year to 6.2% in the third quarter of 2026 as steady completions and prolonged leasing decisions outpaced demand. Macroeconomic uncertainty reinforced this cautious environment: new U.S. tariffs and Ottawa’s matching retaliatory duties on $27.6 billion in targeted goods increased risk for trade-exposed businesses, while weaker employment and measured consumer demand encouraged occupiers to favour disciplined expansion and lease renewals over speculative commitments.
Operational performance and rental dynamics
Heightened tenant selectivity placed modest downward pressure on average national net asking rents, which generally ranged from $15.50 to $16.00 per square foot. Pressure was concentrated in legacy assets with lower clear heights, where tenant improvement allowances and rental concessions became standard tools for attracting occupiers. By contrast, prime Class A logistics and distribution centres with modern specifications retained stronger pricing power and experienced only nominal rate pullbacks. This flight to quality showed that active occupiers prioritized long-term operating efficiency over short-term savings. Sustained demand for top-tier space therefore established a pricing floor and contributed to the national market’s fifth consecutive quarter of positive net absorption.
Figure 1: Industrial availability (Q3 2025 vs. Q2 2026 vs. Q3 2026)
Regional performance and market disparities
Regional performance diverged considerably across Canada’s primary industrial markets in the third quarter of 2026. Availability increased in the Greater Toronto Area (GTA), Ottawa and Montreal; declined in Vancouver, Calgary, Southwestern Ontario and Halifax; and was unchanged in Edmonton. Markets with constrained supply or stronger population and economic growth generally outperformed those absorbing substantial speculative completions. Across regions, however, prime modern space retained more resilient pricing than legacy inventory.
Vancouver recorded a modest 10-bps year-over-year decrease in availability to 5.9%. Strict geographic constraints continued to limit speculative inventory expansion, while demand remained anchored by port-adjacent logistics and third-party logistics (3PL) providers serving a growing regional population. Broader economic uncertainty lengthened negotiation periods, but occupiers continued to favour modern, high-efficiency space. Flight-to-quality relocations into newly delivered facilities in the Fraser Valley, Delta and Richmond therefore supported absorption.
The GTA’s availability rate increased 60 bps year-over-year as a multi-year wave of construction deliveries along key logistics corridors outpaced a disciplined tenant base. Underlying demand from GTA manufacturing and distribution businesses remained supported by demographic growth, e-commerce fulfillment and supply-chain restructuring, but elevated interest rates and cross-border trade friction kept tenants highly selective. Occupiers used the greater range of available space to secure concessions and tenant improvement allowances in legacy properties while prioritizing build-to-suit and high-specification Class A facilities, where pricing and terms remained firm.
In contrast to the elevated supply and cautious tenant behaviour observed across the major coastal gateways, Alberta’s key industrial markets demonstrated notable resilience. Their performance was supported by stronger provincial economic growth, sustained interprovincial migration and expanding manufacturing and energy-related demand.
Calgary’s availability rate fell 140 bps year-over-year to 4.9%. As Western Canada’s primary inland distribution and logistics hub, the market continued to record robust absorption from e-commerce, third-party logistics (3PL) and retail distribution users expanding along the Stoney Trail and Eastfield corridors. Lower corporate costs and a favourable tax environment relative to coastal gateways further encouraged national occupiers to centralize distribution operations in Calgary. Large-bay distribution facilities accounted for much of the leasing volume, while demand for small- to mid-bay flex and light industrial space also remained tight, supported by population growth and trade-service activity.
Edmonton’s availability rate held flat year-over-year at 6.5%. Rising leasing demand from logistics and industrial support firms attracted by lower rents and streamlined permitting offset cautious speculative construction. Demand remained anchored by heavy manufacturing, energy-sector servicing and major infrastructure projects in the Industrial Heartland and Nisku/Leduc submarkets, while investment in cold storage and air-cargo infrastructure near Edmonton International Airport strengthened the region’s role as a northern trade and distribution corridor.
Southwestern Ontario’s availability rate fell 160 bps year-over-year to 6.4% despite its exposure to cross-border trade uncertainty and tariff changes. The region’s integration with U.S. automotive, EV battery and advanced-manufacturing supply chains along the Highway 401 corridor left occupiers exposed to CUSMA negotiations and reciprocal duties. However, these pressures accelerated supply-chain localization, nearshoring and inventory-buffer expansion among domestic manufacturers and tier-one suppliers. Disciplined speculative development aligned new supply with tenant requirements, while lower capital barriers helped protect the market from broader national volatility.
Montreal’s industrial availability rate rose 80 bps year-over-year to 8.9% despite two consecutive quarters of positive net absorption in mid-2026. The increase was concentrated in large-bay logistics facilities and reflected a small number of fully vacant properties entering the market, including the sublease of a former Amazon distribution centre in Montérégie. Off-Island speculative completions continued to outpace demand, while limited small- to mid-bay construction kept smaller buildings tight and availability in Laval and Longueuil below the metropolitan average. Even with these localized additions, net asking rents maintained a stable floor.
Halifax’s industrial availability rate, which had been the highest among major hubs for several quarters, fell 350 bps year-over-year to 8.6%. As a smaller, less liquid market, Halifax remained particularly sensitive to individual tenant movements, and major vacancies in submarkets such as Bayers Lake had a disproportionate effect on regional data. Elevated availability had reflected the slow absorption of existing direct space rather than speculative overbuilding or significant sublease activity. In the third quarter, three tenants leased space in Bayers Lake Industrial Centre Buildings A and B, which comprised 230,235 and 166,445 square feet, respectively, materially reducing the region’s available inventory.
National supply dynamics and inventory trends
Eighteen industrial buildings added nearly 3.9 million square feet to Canada’s inventory in the third quarter (Figure 2). At quarter-end, 61% of the completed space remained available, reflecting cautious corporate decision-making and extended leasing timelines. The concentration and absorption of this new supply varied sharply by market, revealing substantial differences in developer discipline and tenant demand across Canada’s major economic centres.
Figure 2: Industrial completions and availability (Q3 2026)
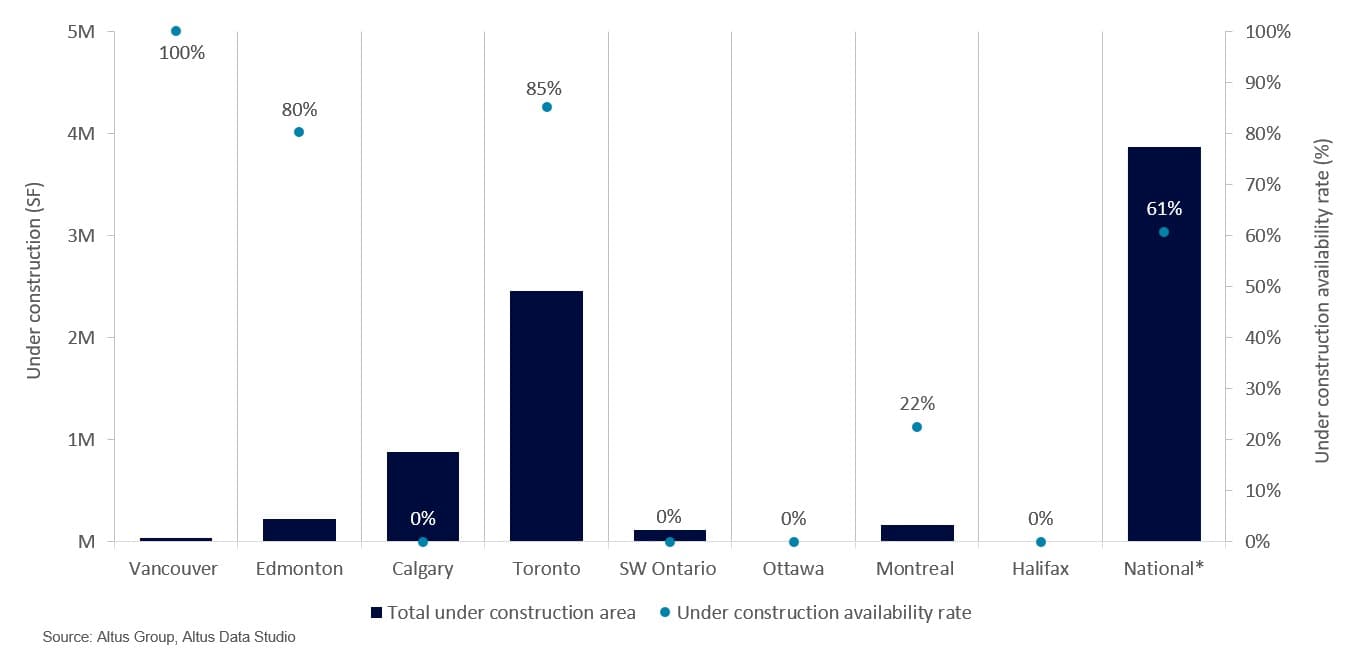
The GTA accounted for nine of the quarter’s total completions, adding nearly 2.5 million square feet, of which 85% remained available at quarter-end. Amid trade uncertainty and elevated capital costs, large-bay occupiers prioritized consolidation and cost efficiency over expansion. By contrast, Southwestern Ontario delivered one built-to-suit facility of approximately 111,000 square feet that was absorbed immediately, reflecting supply-chain localization, manufacturing resilience and disciplined development aligned with tenant demand.
Completed-space performance varied considerably across Metro Vancouver, Montreal and Calgary. Metro Vancouver added one small-bay building of roughly 40,000 square feet, which remained fully available. Severe geographic constraints and Agricultural Land Reserve restrictions continued to restrict the pipeline for larger logistics developments, leaving small- to mid-bay projects to define local activity. Montreal recorded two off-Island completions totalling nearly 166,000 square feet, with 22% of the newly delivered space remaining available, supported by steady tenant migration to modern, high-specification facilities on the North and South Shores. Calgary recorded the country’s strongest pre-leasing momentum, delivering three fully leased facilities totalling 273,000 square feet. Robust interprovincial migration, expanding third-party logistics requirements and favourable corporate cost structures enabled Calgary to absorb the inventory upon completion.
National industrial construction pipeline
The national industrial construction pipeline comprised 140 projects representing nearly 28 million square feet of planned inventory. Approximately 56% of the space remained available, as occupiers stayed selective and developers calibrated additions to long-term regional growth.
Figure 3: Industrial under construction and availability (Q3 2026)
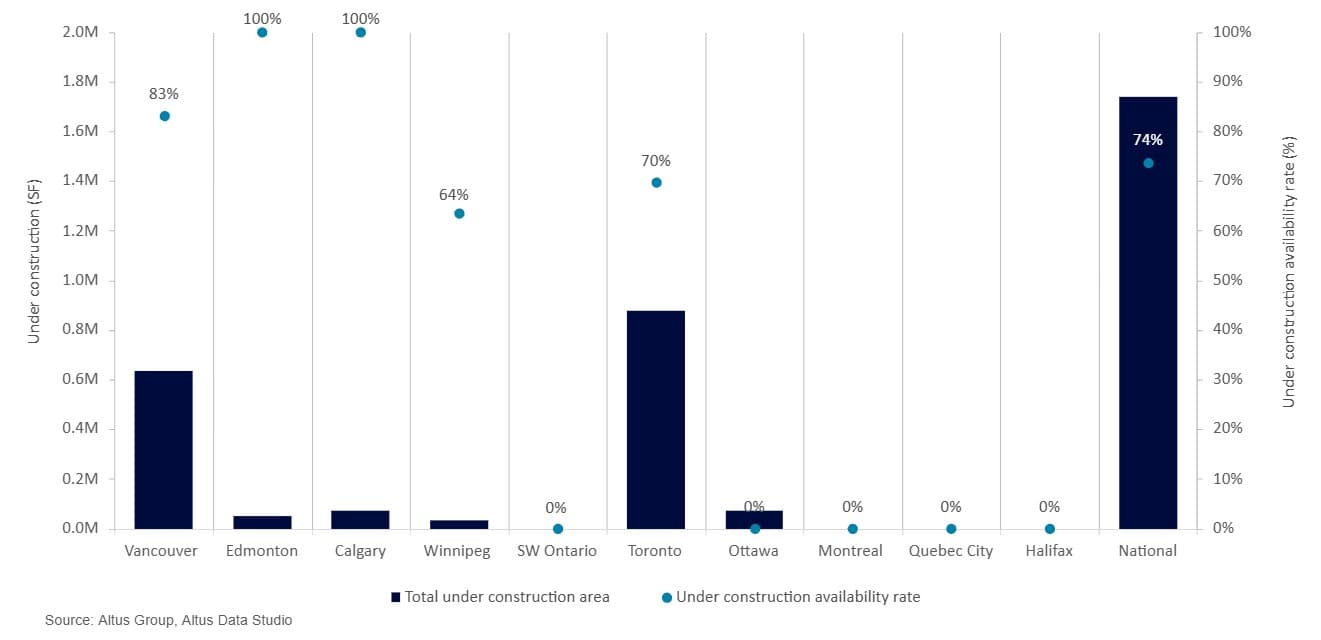
The GTA remained Canada’s primary development centre, with 43 projects totalling 12.3 million square feet under construction. Nearly 63% of this active space remained available, reflecting developers’ continued reliance on speculative projects and institutional confidence in a medium-term demand recovery. Construction remained tightly focused on modern Class A logistics facilities, grounded in expectations that high-specification assets would capture the bulk of corporate expansion as broader macroeconomic conditions stabilized.
Metro Vancouver’s development pipeline comprised 26 industrial buildings totalling nearly 3.2 million square feet, with 47% of the space remaining available. Overall, activity increased in the third quarter, driven mainly by build-to-suit commitments and multi-bay projects designed to make efficient use of land-constrained sites.
Calgary’s active construction pipeline comprised 12 projects totalling nearly 1.8 million square feet, with 81% of the space remaining available. This availability contrasted with strong leasing in completed facilities during the quarter and showed that demand had not yet spread evenly to planned speculative supply. Major logistics developments along the Stoney Trail and Balzac corridors expanded the pipeline and targeted national third-party logistics and e-commerce distributors that used Calgary as Western Canada’s central distribution hub.
Edmonton’s development activity also increased, supported by more than $50 billion in existing investment in Alberta’s Industrial Heartland and an additional $30 billion under construction. During the third quarter, 11 projects totalling 1.3 million square feet were underway, with 59% of the space available for lease. The substantial quarter-over-quarter expansion helped ease the market’s supply constraints.
Further east, Ottawa’s industrial supply pipeline was anchored by Amazon’s 3.1-million-square-foot fulfillment centre in Barrhaven. Upon completion, it was expected to become Amazon’s third fulfillment centre in Ottawa and the largest facility of its kind in Canada, reinforcing the company’s long-term investment in regional distribution infrastructure and Ottawa’s strategic role between the Toronto and Montreal corridors. Beyond this mega-project, the local pipeline included three built-to-suit industrial buildings totalling 183,000 square feet.
Montreal had 18 buildings totalling nearly 3 million square feet under construction, primarily in the North Shore, Laurentides and Laval regions. Although institutional developers maintained long-term confidence in demand for modern industrial infrastructure, nearly 69% of the pipeline remained available. Three years of largely negative net absorption therefore left substantial speculative space available and sustained upward pressure on regional availability.
Navigating future market dynamics
Canada’s industrial market was moving toward a post-expansion equilibrium in which asset quality, location and occupier exposure to trade and demographic shifts were expected to increasingly determine performance. Near-term demand was expected to remain strongest for modern logistics, built-to-suit, cold-storage and manufacturing facilities in supply-constrained or high-population-growth markets. Legacy properties and uncommitted speculative developments were expected to face longer lease-up periods, greater concession pressure and a higher risk of repricing.
Demographic shifts continued to reshape industrial space requirements. Although federal immigration changes moderated national population growth, high living costs in gateway markets sustained migration toward more affordable regions, particularly Alberta, supporting logistics absorption in Calgary and Edmonton. Elevated household debt constrained discretionary retail spending, but e-commerce, essential-goods fulfillment and cold storage maintained a stable demand floor across major distribution hubs.
Institutional investors continued to favour prime Class A logistics and modern built-to-suit facilities with high clear heights, sustainability features and secure income. Legacy assets with functional limitations faced cap-rate expansion and longer lease-up periods, prompting retrofits or repositioning, while uncommitted speculative projects remained less attractive than stabilized assets in supply-constrained corridors.
Periodic CUSMA reviews and targeted cross-border tariffs continued to shift occupier strategies from just-in-time inventory toward supply-chain resilience, buffer stocks and nearshoring. This localization trend supported long-term demand for domestic manufacturing and regional warehousing, particularly in Southwestern Ontario and Western Canada, reinforcing the industrial sector’s role in North American trade.

Leverage our real estate data and predictive analytics
The performance attribution, predictive analytics and market intelligence you need to explain performance and improve decision making.
Want to be notified of our new and relevant CRE content, articles and events?
Disclaimer
This publication has been prepared for general guidance on matters of interest only and does not constitute professional advice or services of Altus Group, its affiliates and its related entities (collectively “Altus Group”). You should not act upon the information contained in this publication without obtaining specific professional advice.
A number of factors may influence the performance of the commercial real estate market, including regulatory conditions and economic factors such as interest rate fluctuations, inflation, changing investor sentiment, and shifts in tenant demand or occupancy trends. We strongly recommend that you consult with a qualified professional to assess how these and other market dynamics may impact your investment strategy, underwriting assumptions, asset valuations, and overall portfolio performance.
No representation or warranty (express or implied) is given as to the accuracy, completeness or reliability of the information contained in this publication, or the suitability of the information for a particular purpose. To the extent permitted by law, Altus Group does not accept or assume any liability, responsibility or duty of care for any consequences of you or anyone else acting, or refraining to act, in reliance on the information contained in this publication or for any decision based on it. The distribution of this publication to you does not create, extend or revive a client relationship between Altus Group and you or any other person or entity. This publication, or any part thereof, may not be reproduced or distributed in any form for any purpose without the express written consent of Altus Group.
Author
Jennifer Nhieu
Senior Research Analyst
Resources
Latest insights