How property vintage shapes pricing across CRE's core sectors
In CRE, newer doesn't always mean more valuable; we ran a vintage analysis across four sectors to see where age remains a pricing signal.
How property vintage shapes pricing across CRE's core sectors
In CRE, newer doesn't always mean more valuable; we ran a vintage analysis across four sectors to see where age remains a pricing signal.
Author

Cole Perry
Associate Director of Research, Altus Group
Key highlights
Median transacted property age hit record highs in multifamily (61 years), industrial (41 years), and office (39 years) in Q1 2026, potentially reflecting a long-run deceleration in new construction and a tendency for owners of newer assets to hold rather than sell
Vintage is not always a reliable proxy for value: in industrial and multifamily, newer construction does not command the highest price per square foot, while in retail and office it does
Multifamily's 2000s cohort traded at the lowest median price per square foot of any vintage in Q1 2026, below even pre-1970 stock
Retail carries the widest vintage-based pricing spread of any sector, with post-2010 properties trading at a 161.5% premium to pre-1970 stock, yet it is the oldest cohort generating the strongest annual appreciation at +17.7%
Drawing on transaction-level data through Q1 2026 from Reonomy, Altus Group's US Research Team tracked the median price per square foot by vintage cohort across the property sectors. The findings reveal that the relationship between vintage and value is neither linear nor consistent, and in several sectors runs counter to what market participants might expect.
Median age and the limits of vintage as a value signal
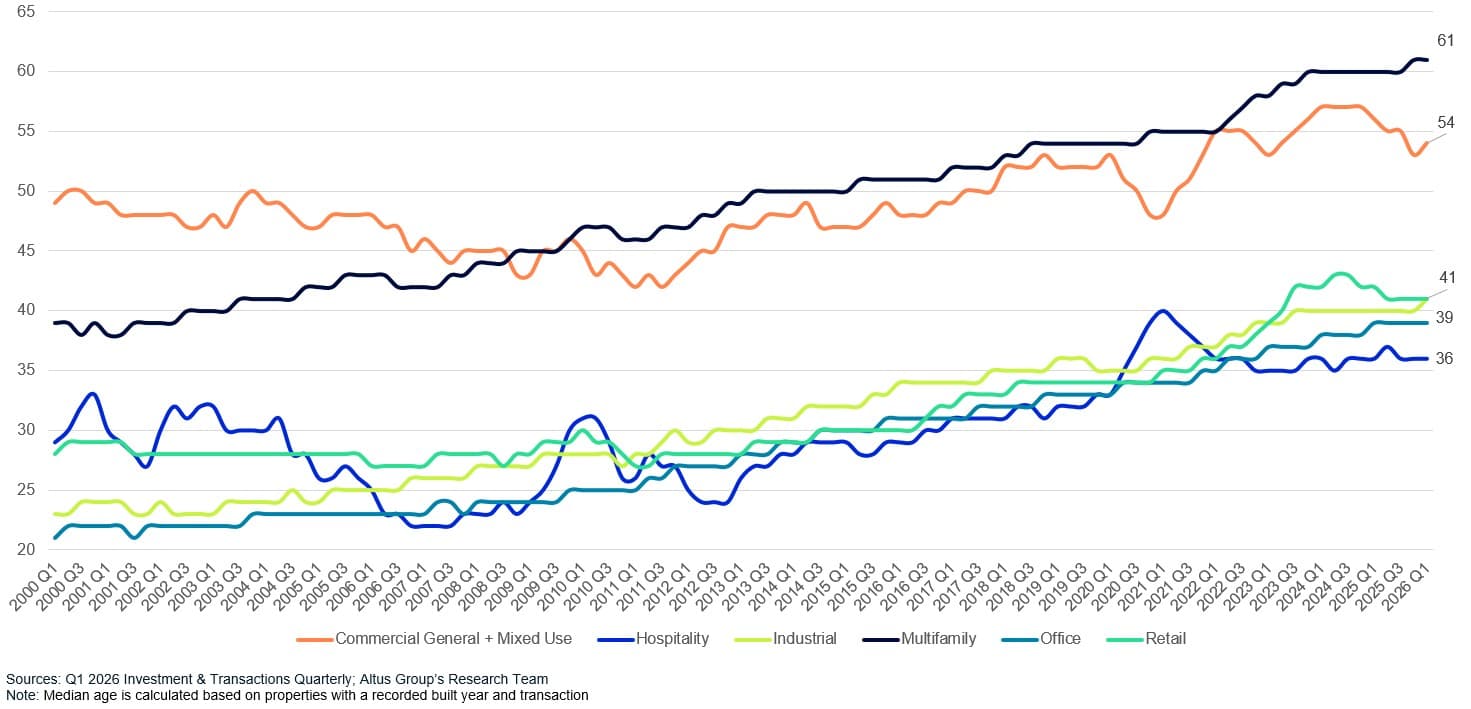
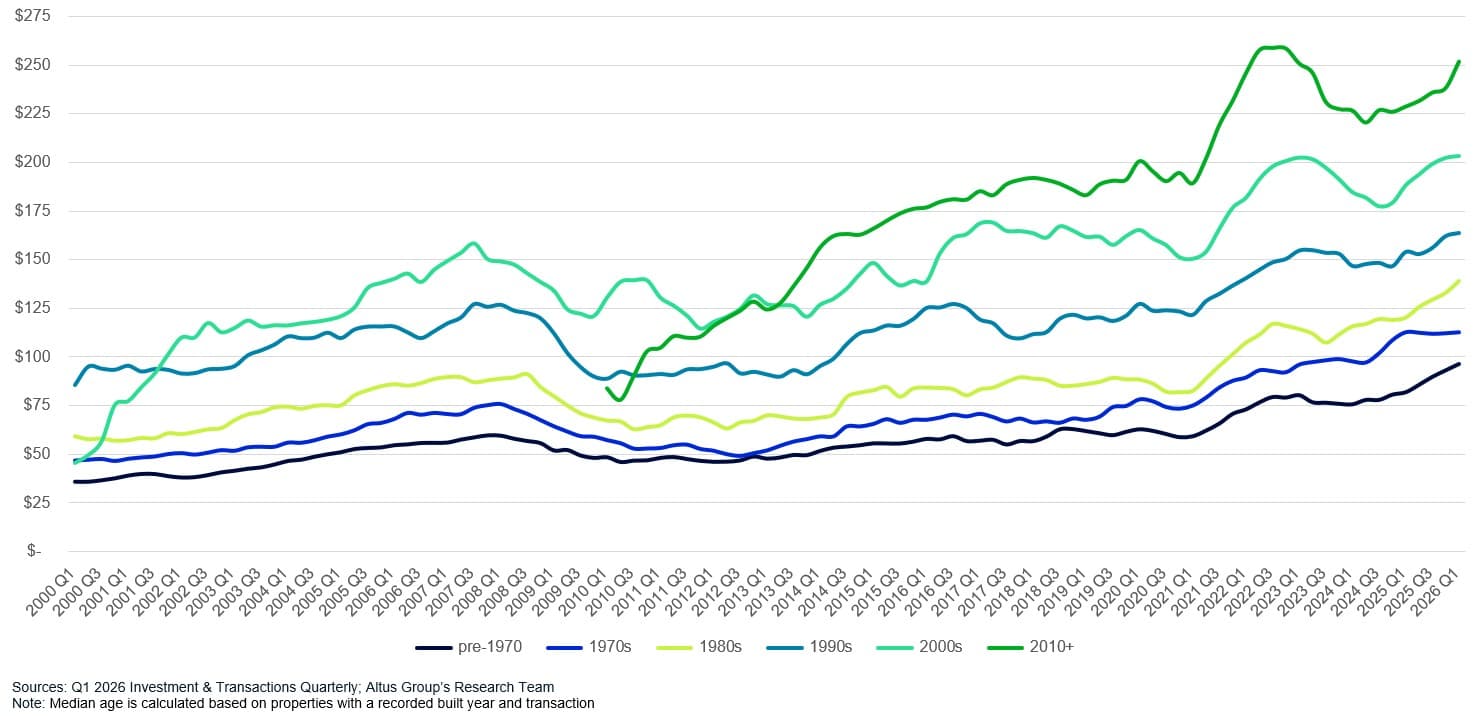
Median transacted age has been rising across sectors, likely reflecting a long-run slowdown in new construction and a tendency for owners of newer assets to hold rather than sell. In Q1 2026, the median multifamily transaction involved a 61-year-old property, a record high. Industrial and retail both posted median transacted ages of 41 years, near or at records, while office came in at 39 years.
Market participants might expect, in theory, that newer traded product generally commands a premium - a "vintage premium thesis". But across many sectors, the thesis breaks down, and in some cases, inverts entirely.
Figure 1: Median age of transacted property
Older multifamily stock leads on price
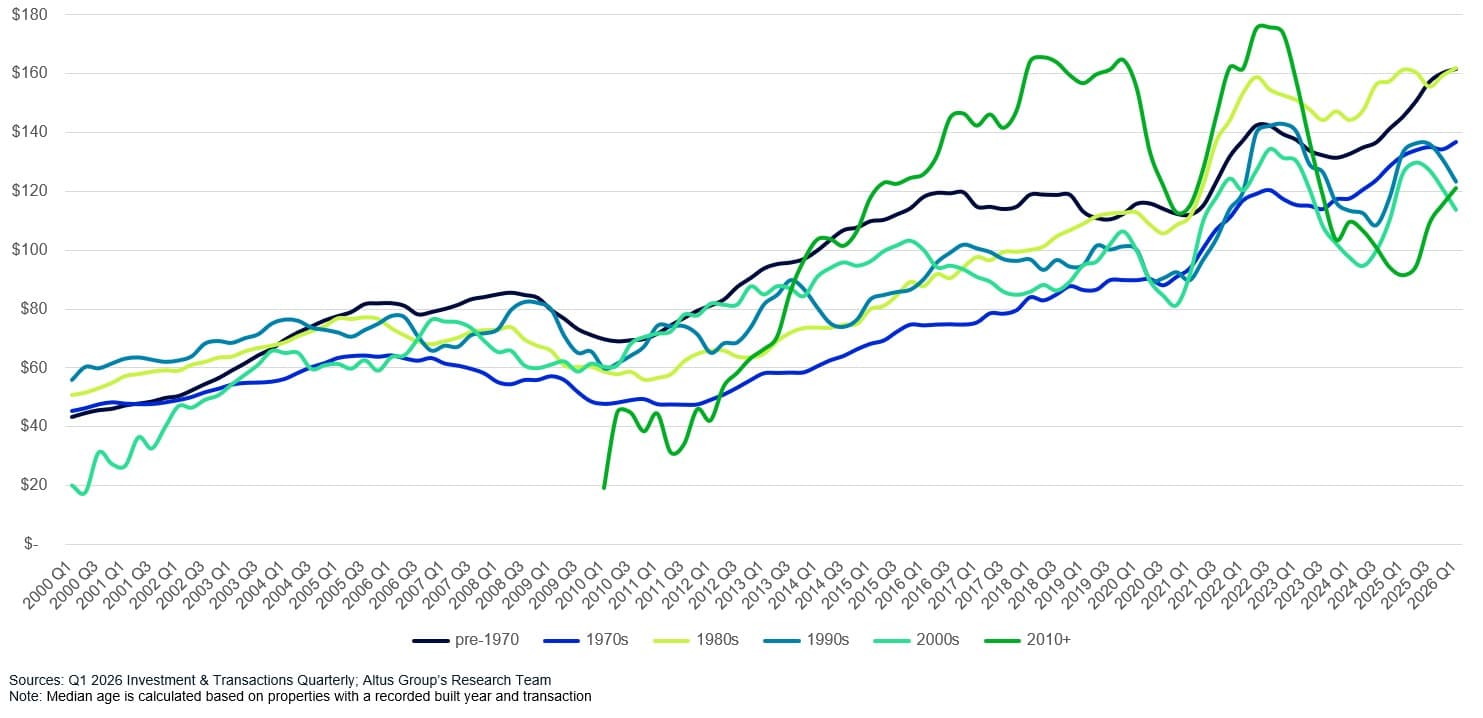
Multifamily presents the starkest departure from the vintage premium thesis. The 1980s cohort led all vintages on median price per square foot in Q1 2026, in line with pre-1970s stock, while 2000s-built properties traded at the lowest values. Post-2010 assets posted the strongest appreciation, up 4.8% quarterly and 32.4% annually, but from a compressed base; they have ranked near the bottom of the pricing stack for several quarters. The 2000s cohort continues to underperform, falling 5.9% quarterly and 9.8% annually, a dislocation that has persisted since late 2022. Older stock that does transact may be concentrated in supply-constrained infill markets where location supports pricing power, and GSE financing generally leans more towards existing workforce housing product, which tends to be older, may be sustaining activity in that segment.
Figure 2: Multifamily – Median price per square foot by built decade
Industrial pricing favors middle vintages
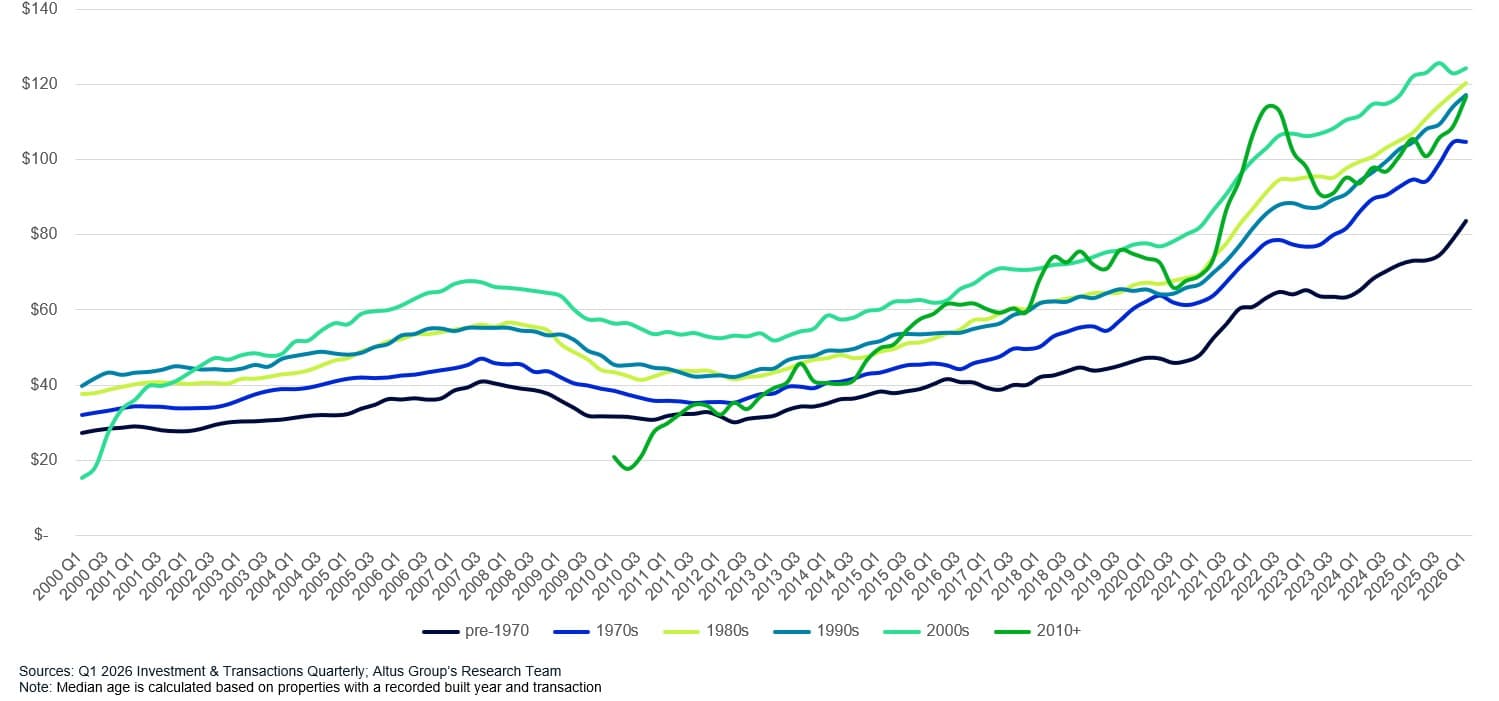
Industrial similarly challenges the vintage premium thesis. Post-2010 assets led quarterly price growth at +7.4%, yet their median price per square foot trails 1980s-, 1990s-, and 2000s-built stock. Pre-1970 properties grew the most on an annual basis at +14.5%. Older industrial assets coming to market tend to be in infill locations where land constraints and proximity to population centers can outweigh the functional advantages of newer vintage.
Figure 3: Industrial – Median price per square foot by built decade
Office premium concentrates at the top
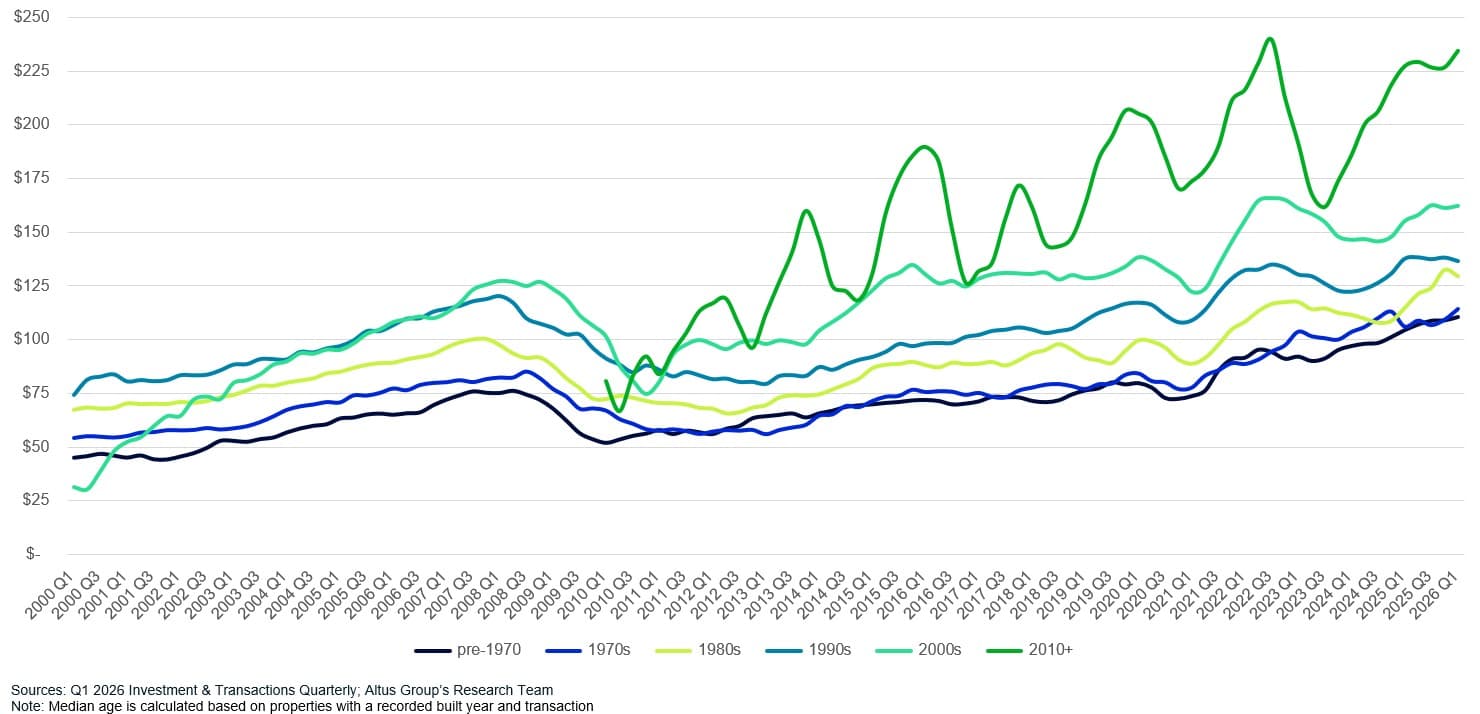
Office exhibits a clearer vintage premium, though concentrated at the top of the distribution. Post-2010 assets trade at a 44.6% premium to 2000s-built stock, the widest gap between adjacent cohorts of any sector, while differentiation across older vintages is limited. The office transaction market remains highly selective, and composition effects (trophy assets versus possibly-distressed dispositions) shape observed pricing. Interestingly, 1980s-built properties posted the strongest annual price growth at +12.9%, reflecting continued appetite for older product at an attractive basis.
Figure 4: Office – Median price per square foot by built decade
Retail's widest vintage spread
Retail carries the widest vintage-based pricing spread of any sector. Post-2010 properties trade at a 161.5% premium to pre-1970 stock, with values stepping down in relatively orderly fashion across intermediate cohorts. Yet it is the oldest cohort generating the strongest appreciation, with pre-1970 properties up 17.7% year-over-year, while post-2010 assets remain 2.7% below their Q3 2022 peak. The absolute pricing hierarchy favors newer product; the near-term pricing growth profile is more complicated.
Figure 5: Retail – Median price per square foot by built decade
Does property age predict value in commercial real estate?
Across all four sectors, the data points to one consistent theme: vintage is a starting point, not a conclusion. Location appears to be playing a significant role in influencing pricing more than age alone.
Multifamily: The 2000s cohort discount has persisted since late 2022 and has not closed despite broader price recovery. Older infill stock continues to lead on price, with GSE financing likely sustaining activity in the workforce housing segment.
Industrial: Older assets in supply-constrained infill locations are trading at premiums that newer suburban product cannot match, with pre-1970 properties leading annual price growth at +14.5%.
Office: The vintage premium is real but narrow. The post-2010 premium over 2000s stock is the widest adjacent-cohort gap of any sector, but differentiation across older vintages is limited, making vintage an unreliable guide to value outside the trophy segment.
Retail: The assets generating the strongest near-term appreciation are not the newest ones. Pre-1970 properties led annual growth at +17.7%, even as post-2010 product holds the absolute pricing high ground.
Bottom line
The Q1 2026 data makes clear that newer does not reliably mean more expensive across CRE sectors. With the typical transacted property getting older across the board, understanding which vintages are actually commanding premiums (and which are not) matters more than ever. Vintage is one input among many; location, capital access, and tenant profile all play a role in determining what the data actually reflects, and the cases where conventional assumptions break down are at least as instructive as the ones where they hold.
Vintage-based pricing trends are one of many metrics covered in the Q1 2026 US CRE Investment and Transactions Quarterly Report. For a deeper look at transaction volume, pricing, and market composition across property types, view the full report.
Want to be notified of our new and relevant CRE content, articles and events?
Disclaimer
This publication has been prepared for general guidance on matters of interest only and does not constitute professional advice or services of Altus Group, its affiliates and its related entities (collectively “Altus Group”). You should not act upon the information contained in this publication without obtaining specific professional advice.
A number of factors may influence the performance of the commercial real estate market, including regulatory conditions and economic factors such as interest rate fluctuations, inflation, changing investor sentiment, and shifts in tenant demand or occupancy trends. We strongly recommend that you consult with a qualified professional to assess how these and other market dynamics may impact your investment strategy, underwriting assumptions, asset valuations, and overall portfolio performance.
No representation or warranty (express or implied) is given as to the accuracy, completeness or reliability of the information contained in this publication, or the suitability of the information for a particular purpose. To the extent permitted by law, Altus Group does not accept or assume any liability, responsibility or duty of care for any consequences of you or anyone else acting, or refraining to act, in reliance on the information contained in this publication or for any decision based on it. The distribution of this publication to you does not create, extend or revive a client relationship between Altus Group and you or any other person or entity. This publication, or any part thereof, may not be reproduced or distributed in any form for any purpose without the express written consent of Altus Group.
Author
Cole Perry
Associate Director of Research, Altus Group
Resources
Latest insights