CRE debt markets entered a state of transition in Q1 2026
Floating-rate borrowers captured the biggest gains as SOFR dropped another 34 bps, but rising Treasury yields created a split narrative across the capital stack.

Key takeaways
SOFR plunged 67 bps year-over-year and 34 bps quarter-over-quarter to 366 bps, with floating-rate borrowers benefiting from falling all-in costs across nearly every property type
The 5-Year UST and 10-Year UST each rose 10 bps quarter-over-quarter to 377 bps and 420 bps, respectively, reversing several quarters of declines and partially offsetting spread compression for fixed-rate borrowers
Total quotes rose 24% quarter-over-quarter to 1,866, with quotes per participant jumping to a high of 17.0 and borrowers continuing to receive roughly 5.1 competitive quotes for new financing
The first quarter of 2026 delivered a more nuanced picture of the CRE debt markets than the broad-based improvement that defined 2025. SOFR continued its descent, falling to a quarterly average of 366 bps and bringing floating-rate all-in costs meaningfully lower. But Treasury yields moved the other direction. The 5-Year and 10-Year both rose roughly 10 bps quarter-over-quarter, pushing fixed-rate benchmarks higher for the first time in several quarters. The result was a market where the direction of your rate depends on the structure of your loan. Based on findings from the Altus Group's US Debt Capital Market Survey for Q1 2026, quote volume rebounded 24% from 4Q 2025's holiday-depressed levels, and engaged participants reported nearly 17 quotes each. The survey captured 1,866 quotes from 110 industry professionals, providing a detailed look at where the market stands as 2026 takes shape.
Quote activity and market composition
The 1,866 total quotes reported in 1Q 2026 represent a healthy rebound from 4Q 2025's 1,511. The quarterly increase of 24% largely reflects the absence of holiday-related slowdowns that depressed 4Q activity. Year-over-year, volume is still down 18% from 1Q 2025's 2,289 quotes, but the per-participant engagement tells a more optimistic story. Each survey participant reported an average of 17.0 quotes, up sharply from 13.3 in 4Q 2025 and higher than any quarter since 2Q 2025. That suggests the active participants in this market are very active.
On the competitive landscape, borrowers seeking new financing received approximately 5.1 competitive quotes on average, essentially flat with 4Q 2025's 5.2 and in line with the 5.1 seen a year ago in 1Q 2025. Lender competition remains stable. Borrowers with quality assets in favored sectors continue to attract multiple bids, though we haven't seen the kind of acceleration in competition that might signal overheating.
Surveyed quotes: Count of quotes received by product type
Rate type | Product | Q1 2026 | Q4 2025 | QoQ %Δ | Q1 2025 | YoY %Δ |
|---|---|---|---|---|---|---|
Fixed | Senior Short (1) | 388 | 394 | -2% | 568 | -32% |
Fixed | Senior Long (2) | 358 | 210 | 70% | 310 | 15% |
Fixed | Mezzanine (2) | 73 | 78 | -6% | 117 | -38% |
Fixed | Pref. Eq. (3) | 44 | 52 | -15% | 77 | -43% |
Floating | Senior Short (4) | 720 | 573 | 26% | 930 | -23% |
Floating | Mezzanine (4) | 159 | 117 | 36% | 143 | 11% |
Floating | Repo/Facility (4) | 124 | 87 | 43% | 144 | -14% |
Total (All products) | 1,866 | 1,511 | 23% | 2,289 | -18% |
Benchmarks: 1) 5-Year US Treasury yield; 2) 10-Year US Treasury yield; 3) All-in Coupon Rate %; 4) Term SOFR
Product mix: As percentage of total quotes received
Rate type | Product | Q1 2026 | Q4 2025 | QoQ %Δ | Q1 2025 | YoY %Δ |
|---|---|---|---|---|---|---|
Fixed | Senior Short (1) | 21% | 26% | -5% | 25% | -4% |
Fixed | Senior Long (2) | 19% | 14% | 5% | 14% | 6% |
Fixed | Mezzanine (2) | 4% | 5% | -1% | 5% | -1% |
Fixed | Pref. Eq. (3) | 2% | 3% | -1% | 3% | -1% |
Floating | Senior Short (4) | 39% | 38% | 1% | 41% | -2% |
Floating | Mezzanine (4) | 9% | 8% | 1% | 6% | 2% |
Floating | Repo/Facility (4) | 7% | 6% | 1% | 6% | 0% |
Total (All products) | 100% | 100% | 100% |
Benchmarks: 1) 5-Year US Treasury yield; 2) 10-Year US Treasury yield; 3) All-in Coupon Rate %; 4) Term SOFR
The product mix showed floating-rate senior short leading the way at 39% of total quotes (720 quotes), followed by fixed-rate senior short at 21% (388 quotes) and fixed-rate senior long at 19% (358 quotes). Floating-rate mezzanine accounted for 9% (159 quotes), while repo/warehouse facilities made up 7% (124 quotes). The floating-rate dominance makes sense given where SOFR is heading. Borrowers who expect continued Fed easing have reason to stay floating rather than lock in.
Collateral sector mix: As percentage of total quotes received
Property type | Q1 2026 | Q4 2025 | QoQ %Δ | Q1 2025 | YoY %Δ |
|---|---|---|---|---|---|
Residential | 23% | 25% | -2% | 26% | -3% |
Industrial | 18% | 20% | -2% | 18% | 0% |
Office | 17% | 17% | 0% | 16% | 1% |
Retail | 17% | 15% | 2% | 17% | -1% |
Hotel | 8% | 7% | 0% | 6% | 2% |
Specialty | 8% | 6% | 2% | 6% | 2% |
Construction | 10% | 9% | 0% | 10% | 0% |
All Collateral | 100% | 100% | 100% |
On the collateral side, residential retained its top position at 23% of total quotes, followed by industrial at 18%. Office and retail tied at 17% each. Construction came in at 10%, with hotel and specialty each at 8%. Office maintaining its share near the levels seen in 4Q 2025 (when it jumped to 17%) suggests the re-engagement with that sector wasn't a one-quarter anomaly. Lenders continue to differentiate within office, favoring trophy and well-leased properties.
Benchmark rates: The yield curve normalizes
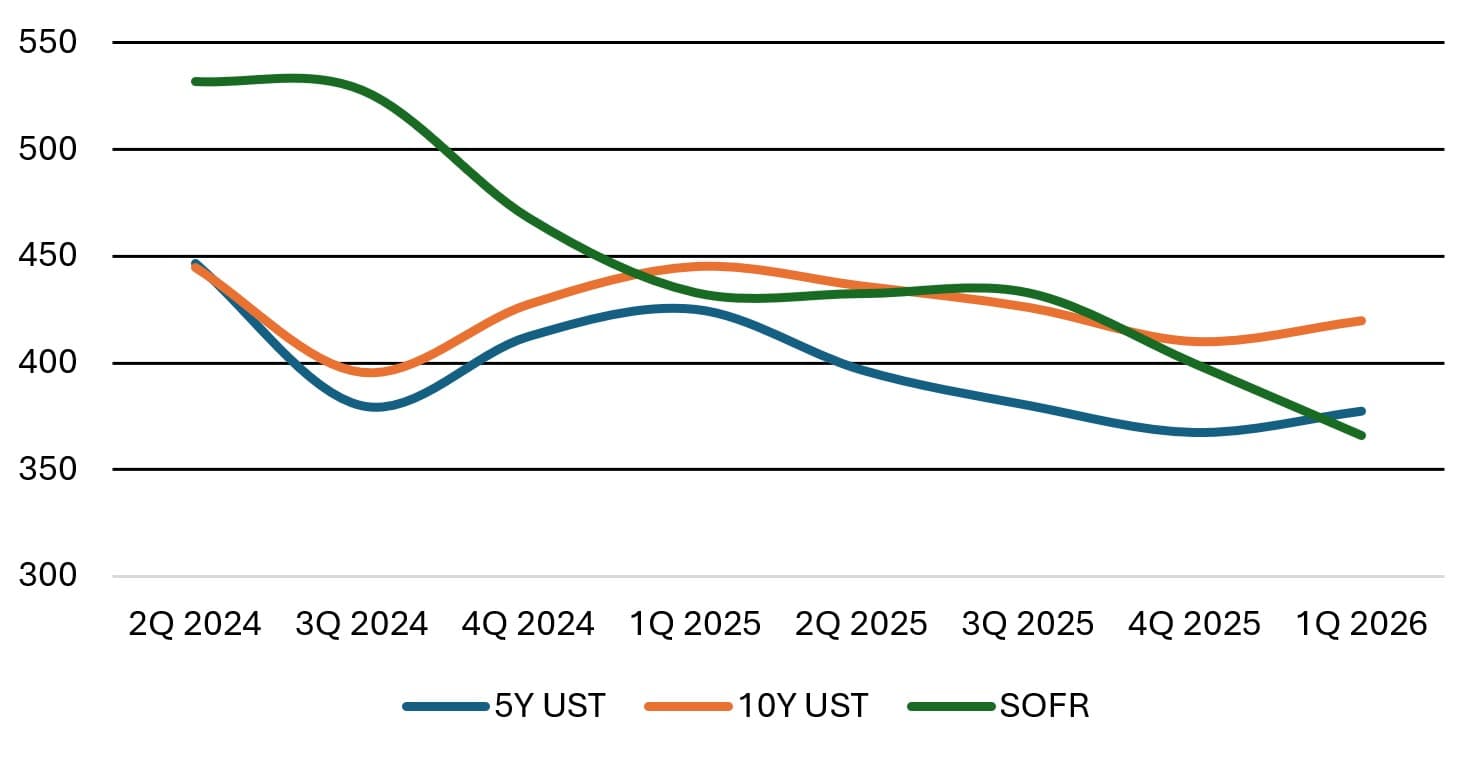
This quarter's benchmark story is a tale of two markets. SOFR continued its steady decline, averaging 366 bps for the quarter, down 34 bps from 4Q 2025's 399 bps and down 67 bps year-over-year. The Fed's rate-cutting cycle remains the dominant force for floating-rate pricing.
Figure 1: Benchmark yields (Quarterly average, bps)
Source: US Treasury
Treasury yields, however, reversed course. The 5-Year UST averaged 377 bps, up 10 bps from 367 bps in 4Q 2025 but still down 48 bps year-over-year. The 10-Year UST averaged 420 bps, also up 10 bps quarter-over-quarter and down 26 bps from a year ago. After several quarters of declining Treasury yields, this uptick introduces a wrinkle for fixed-rate borrowers. The year-over-year trajectory is still favorable, but the quarter-over-quarter trend is not.
Benchmark | Q1 2026 | Q4 2025 | QoQ Δ (bps) | Q1 2025 (%) | YoY Δ (bps) |
|---|---|---|---|---|---|
5-Year UST | 3.77 | 3.67 | +10 | 4.25 | -48 |
10-Year UST | 4.20 | 4.10 | +10 | 4.45 | -26 |
Term SOFR | 3.66 | 3.99 | -33 | 4.33 | -67 |
This divergence matters. Floating-rate borrowers saw their benchmark costs drop meaningfully, while fixed-rate borrowers absorbed a modest increase. The spread compression happening in the market helped offset some of the Treasury backup, but not all of it.
Spreads: Compression across the board
Spreads continued their tightening trend in Q1 2026. The weighted average spread on lower-leverage floating-rate senior short financing came in at 267 bps over SOFR, while higher-leverage floating-rate senior short averaged 348 bps. On the fixed side, lower-leverage senior short averaged 218 bps over the 5-Year Treasury and higher-leverage averaged 303 bps.
Spreads: Average spread by product type
Rate type | Product | Leverage (LTV) | Q1 2026 | Q4 2025 | QoQ %Δ | Q1 2025 | YoY %Δ |
|---|---|---|---|---|---|---|---|
Fixed | Senior Short (1) | Lower (≤65%) | 218 | 225 | -3% | 255 | -15% |
Fixed | Senior Short (1) | Higher (>65%) | 303 | 312 | -3% | 330 | -8% |
Fixed | Senior Long (2) | Lower (≤65%) | 203 | 201 | 1% | 218 | -7% |
Fixed | Senior Long (2) | Higher (>65%) | 273 | 256 | 7% | 300 | -9% |
Fixed | Mezzanine (2) | 70-90% | 774 | 814 | -5% | 887 | -13% |
Fixed | Pref. Eq. (3) | ≥70% | 12.37 | 12.68 | -2% | 13.51 | -8% |
Floating | Senior Short (4) | Lower (≤65%) | 267 | 253 | 5% | 275 | -3% |
Floating | Senior Short (4) | Higher (>65%) | 348 | 361 | -4% | 388 | -10% |
Floating | Mezzanine (4) | 70-90% | 752 | 780 | -4% | 840 | -10% |
Floating | Repo/Facility (4) | Adv Rate (50-80%) | 206 | 171 | 20% | 205 | 0% |
Benchmarks: 1) 5-Year US Treasury yield; 2) 10-Year US Treasury yield; 3) All-in Coupon Rate %; 4) Term SOFR
Fixed-rate mezzanine spreads averaged 774 bps over the 10-Year, while floating-rate mezzanine came in at 752 bps over SOFR. Preferred equity coupons averaged 12.4%.
Senior-short spreads: Average spreads by select collateral type*
Property type | Q1 2026 | Q4 2025 | QoQ %Δ | Q1 2025 | YoY %Δ |
|---|---|---|---|---|---|
Residential | 240 | 243 | -1% | 249 | -4% |
Industrial | 247 | 242 | 2% | 257 | -4% |
Office | 330 | 357 | -8% | 348 | -5% |
Retail | 296 | 255 | 16% | 324 | -9% |
Hotel | 324 | 379 | -14% | 400 | -19% |
Specialty | 302 | 308 | -2% | 405 | -26% |
Construction | 344 | 357 | -4% | 396 | -13% |
Note: Average spreads for senior, short-term fixed and floating rate debt; not all property types shown
All-in rates: Meaningful relief for borrowers
When you combine benchmark moves with spread compression, the all-in rate picture becomes the most telling indicator of where borrowing costs actually land. Across all property types and subtypes, the average quarter-over-quarter change in all-in rates was -10 bps, with the average year-over-year change at -68 bps. The year-over-year relief continues to be substantial, even as the pace of quarter-over-quarter improvement has slowed from Q4 2025's -45 bps average.
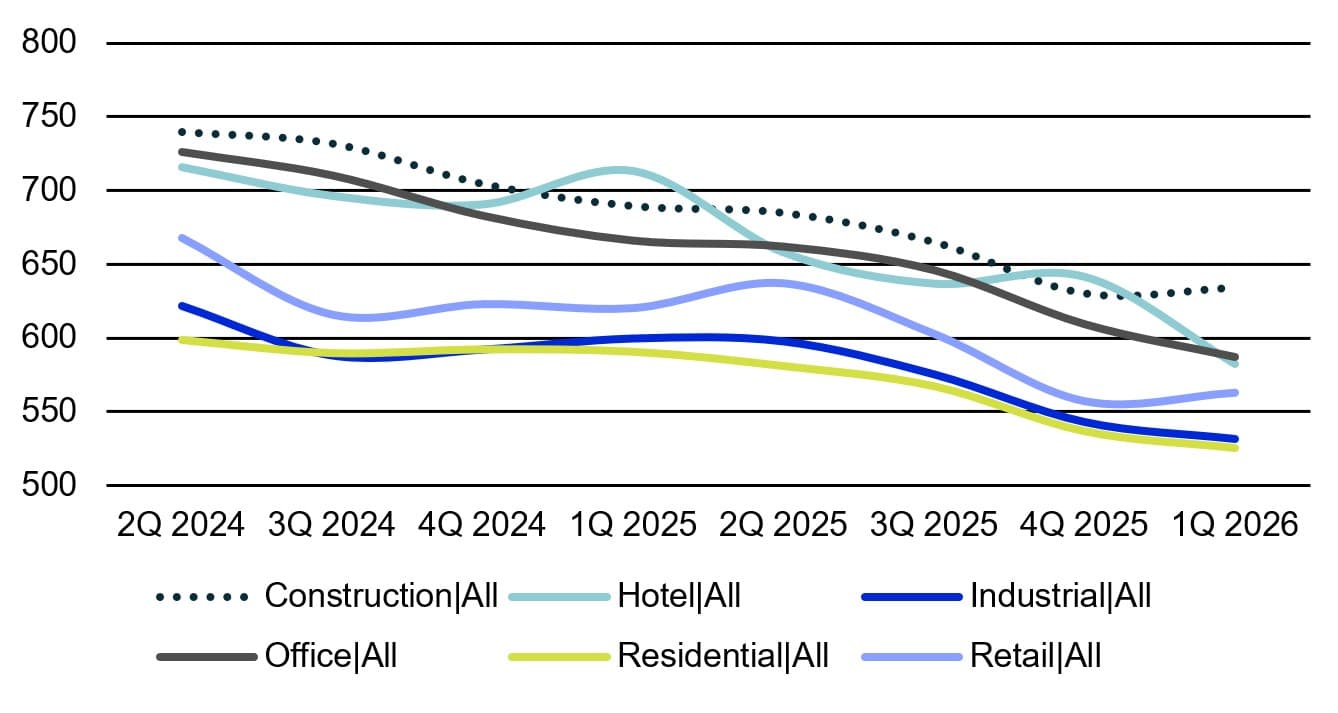
At the property type level, hotels were the runaway story. Hotel all-in rates fell 59 bps quarter-over-quarter to 582 bps, the largest move of any sector by a wide margin. Within the sector, Limited Service dropped 68 bps to 574 bps (down 150 bps year-over-year, or 21%), while Full Service fell 51 bps to 591 bps (down 112 bps YoY, or 16%). This kind of repricing signals that lenders have grown meaningfully more comfortable with hospitality risk after years of post-pandemic caution.
Figure 2: All-in rates (Assume 65% senior, 15% mezzanine; bps)
Source: Altus Group US Debt Capital Markets Survey (Q2 2024 - Q1 2026)
Office all-in rates continued their descent, falling 22 bps quarter-over-quarter to 587 bps and 79 bps year-over-year. Trophy office saw the steepest YoY decline, down 100 bps to 566 bps, while Commodity Suburban fell 91 bps YoY to 607 bps and Commodity Urban dropped 95 bps to 603 bps. The spread between Trophy and Commodity product has narrowed, suggesting capital is flowing more broadly into the sector rather than concentrating only at the top.
Residential and industrial both declined about 11 bps quarter-over-quarter to 525 and 532 bps respectively, with year-over-year drops of 65 and 68 bps. These two sectors remain the lowest-cost conventional asset classes and continue their steady march lower.
On the other end, a few sectors saw modest increases. Retail all-in rates ticked up 6 bps quarter-over-quarter to 563 bps (though still down 58 bps YoY), and construction edged up 4 bps to 634 bps. The construction story has a notable outlier in Construction Office, which jumped 133 bps quarter-over-quarter to 797 bps, a reflection of the still-challenging risk profile for new office development. Specialty was essentially flat at 571 bps.
Looking ahead
The Q1 2026 data paints a market in transition. The floating-rate side of the capital stack continues to benefit from SOFR's decline, and sectors like hotel are seeing aggressive repricing that would have been hard to imagine a year ago. But the uptick in Treasury yields is a reminder that the path lower isn't guaranteed for fixed-rate borrowers. If long rates continue to climb while SOFR falls, borrowers will face an increasingly important decision about rate structure. Transaction volumes, lender competition, and the pace of the Fed's remaining cuts will determine whether the current momentum carries through the rest of the year. For now, the market remains borrower-friendly, but the easy gains may be behind us.

Boost investor confidence with independently managed valuations
Independent appraisals trusted by funds, investors, lenders, and public entities around the world.
Want to be notified of our new and relevant CRE content, articles and events?
Disclaimer
This publication has been prepared for general guidance on matters of interest only and does not constitute professional advice or services of Altus Group, its affiliates and its related entities (collectively “Altus Group”). You should not act upon the information contained in this publication without obtaining specific professional advice.
A number of factors may influence the performance of the commercial real estate market, including regulatory conditions and economic factors such as interest rate fluctuations, inflation, changing investor sentiment, and shifts in tenant demand or occupancy trends. We strongly recommend that you consult with a qualified professional to assess how these and other market dynamics may impact your investment strategy, underwriting assumptions, asset valuations, and overall portfolio performance.
No representation or warranty (express or implied) is given as to the accuracy, completeness or reliability of the information contained in this publication, or the suitability of the information for a particular purpose. To the extent permitted by law, Altus Group does not accept or assume any liability, responsibility or duty of care for any consequences of you or anyone else acting, or refraining to act, in reliance on the information contained in this publication or for any decision based on it. The distribution of this publication to you does not create, extend or revive a client relationship between Altus Group and you or any other person or entity. This publication, or any part thereof, may not be reproduced or distributed in any form for any purpose without the express written consent of Altus Group.
Authors

Omar Eltorai
Senior Director of Research, Altus Group

Andrew Pabon
Director Global Advisory, Altus Group
Authors
Omar Eltorai
Senior Director of Research, Altus Group
Andrew Pabon
Director Global Advisory, Altus Group
Resources
Latest insights