
Key highlights
The overall capitalization rate (OCR) was largely flat at 5.83% in Q1 2024 compared to the previous quarter at 5.88%
In 2024, the continued preference for multi-family, industrial, and food-anchored retail strip assets persisted, bolstered by strong underlying demographic and economic fundamentals
The top three preferred markets for investors across all asset classes were Vancouver, Toronto, and Ottawa
The top three preferred property types by investors were food anchored retail strip, multi-tenant industrial and suburban multiple unit residential
All office-type assets had a negative momentum ratio with concerns around elevated availability rates
The Canadian CRE industry is off to a moderate start for the first quarter of 2024, as investors continue to grapple with elevated interest rates and economic uncertainty
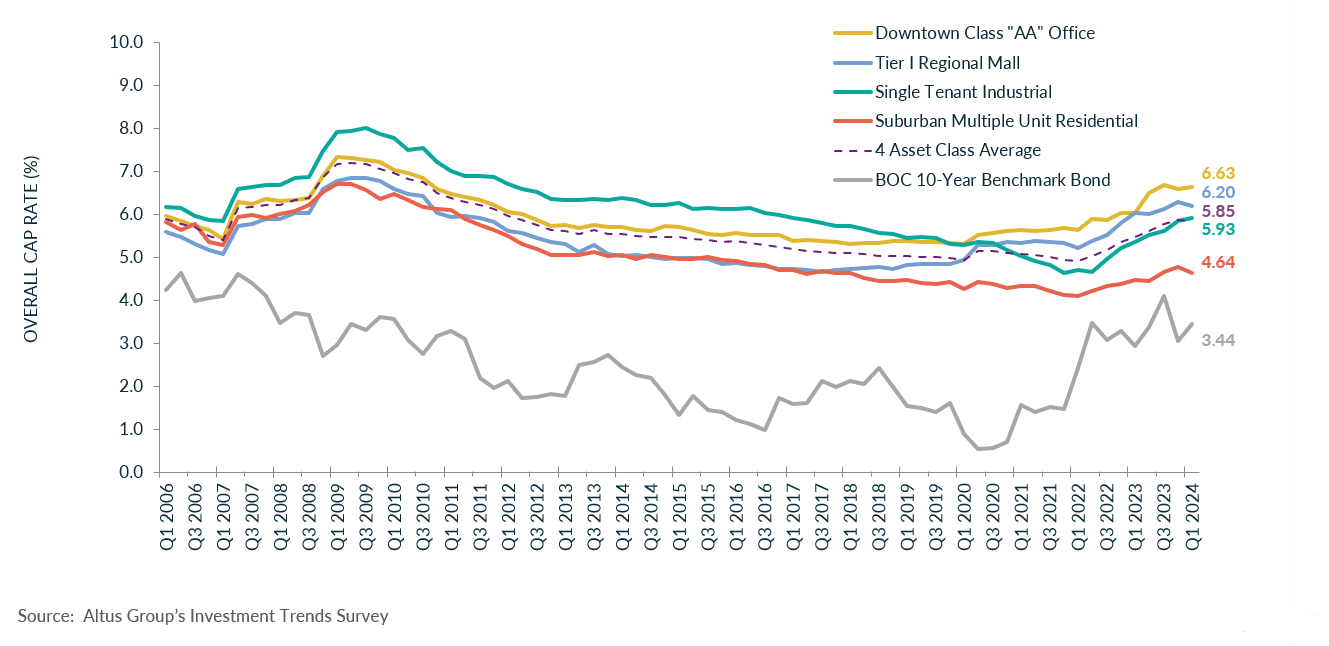
The latest results from Altus Group’s Canadian Investment Trends Survey (ITS) for the four benchmark asset classes show that the overall capitalization rate (OCR) was largely flat at 5.83% in Q1 2024 compared to the previous quarter at 5.88% (Figure 1). The cap rates are reflective of fewer transactions in Canada and continued price discovery amongst buyers and sellers.
According to Statistics Canada’s Labour Force Survey (LFS), as of March 2024, employment remained virtually unchanged (-2,200, -0.0%), as population growth continued to outpace employment growth. In addition, the unemployment rate is up slightly by 0.3 percentage points to 6.1%. Gains in employment were noted primarily in health care and social assistance. Meanwhile, losses in employment were led by accommodation and food services.
The Bank of Canada’s bond rate, as of March 23, 2024, was recorded at 3.44%, representing an increase of 38 bps compared to the end of Q4 2023, at 3.06%.
As the Bank of Canada continued to focus on inflationary control measures with its 2% inflation target, the average OCR remained flat to 5.83% from 5.88% in Q4 2023. Cap rates have levelled across most asset classes except for single-tenanted industrial which increased from 5.85% to 5.93%. In 2024, the continued preference for multi-family, industrial, and food-anchored retail strip assets persisted, bolstered by strong underlying demographic and economic fundamentals.
Figure 1 - OCR trends across 4 benchmark asset classes
Commercial investment activity
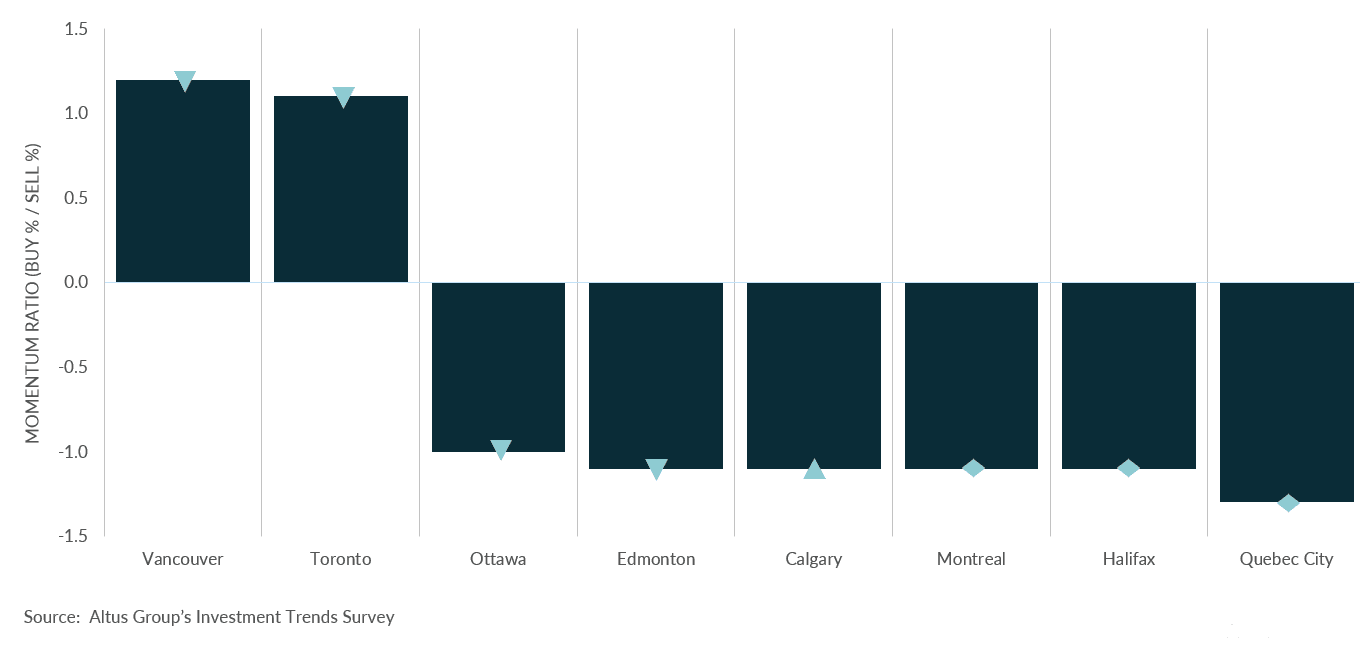
The top three preferred markets for investors across all asset classes were Vancouver, Toronto, and Ottawa, respectively, which remained unchanged from the previous quarter (Figure 2). Similar to the previous quarter, the location barometer reported a mostly unchanged or negative momentum ratio (percentage of investors looking to buy/percentage of investors looking to sell) across all markets.
Figure 2 - Location barometer - All available products (Q1 2024)
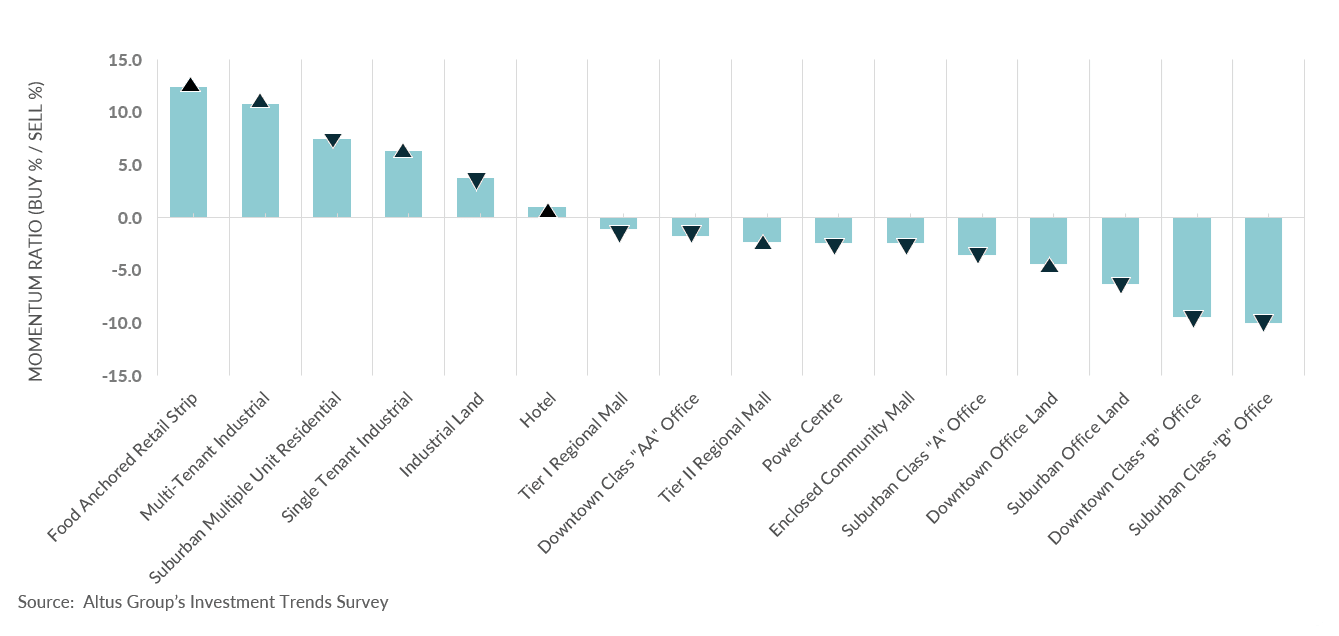
The top three preferred property types by investors in the first quarter of 2024 were food-anchored retail strip, multi-tenant industrial and suburban multiple unit residential, respectively (Figure 3). Tight market conditions have continued to drive the demand for the three property types, and markets continue to grapple with meeting long-term demand. In addition, the hybrid work model and prioritization of essential goods and services have allowed food-anchored retail strips to thrive. Moreover, all office-type assets had a negative momentum ratio with concerns around elevated availability rates.
Figure 3 - Property type barometer – All available products (Q1 2024)
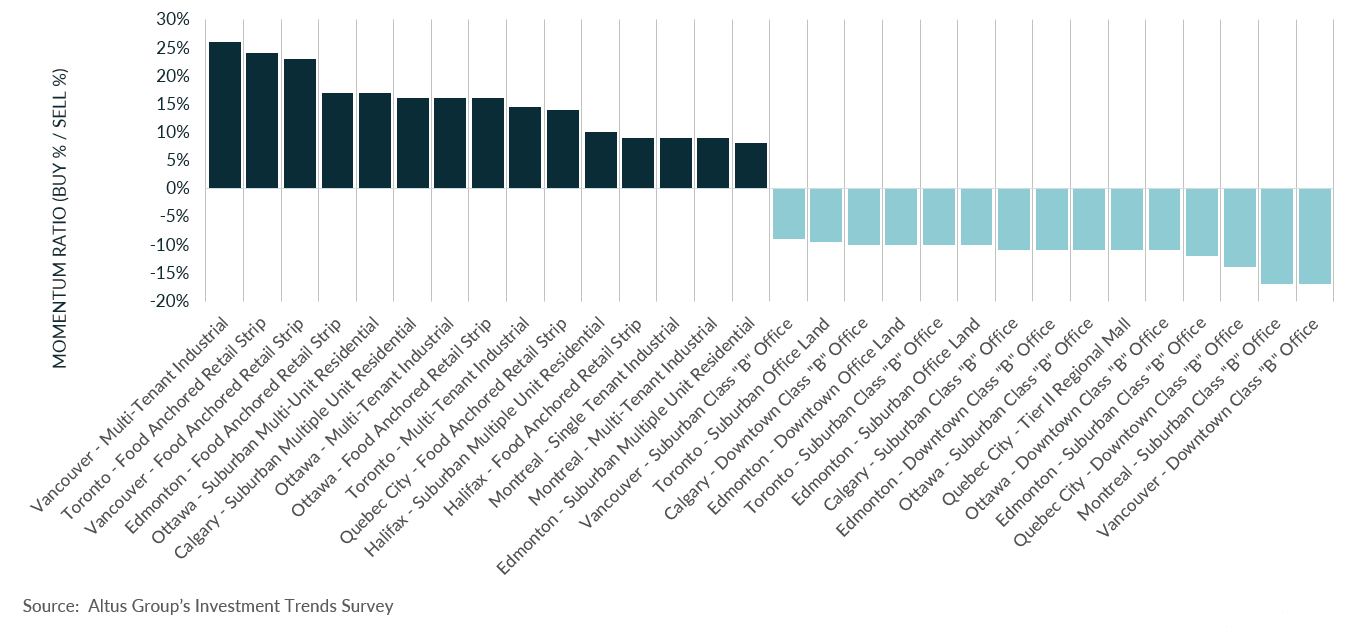
According to the product/market barometer, the top three preferred combinations were Vancouver – multi-tenant industrial, followed by food-anchored retail strips in Toronto and Vancouver, respectively (Figure 4). The 15 least preferred combinations largely revolved around office and mall assets. Challenges created by elevated interest rates and underlying inflationary pressures have led investors to rebalance their portfolios with low-risk assets providing stable returns, such as residential, industrial, and food-anchored retail.
Figure 4 - Product/market barometer - All available products (Q1 2024) – Top 15 preferred/15 least preferred
Market highlights for the quarter include:
Cap rates for suburban multiple unit residential decreased to 4.64%. The suburban multiple-unit residential cap rate decreased by 0.14 percentage points quarter-over-quarter. Cap rates across all markets were mixed, as most markets experienced a decrease or remained unchanged. Vancouver was the only market to report an increase of 0.10 percentage points to 4.2.
Cap rates for single-tenant industrial increased slightly to 5.93%. The national industrial availability rate increased to 5.1%. Four of the eight major markets experienced an increase in their cap rate quarter-over-quarter, except for Edmonton, Calgary, Halifax (unchanged) and Quebec City (decrease).
Downtown class “AA” office cap rates increased slightly to 6.63%. The national office availability rate flattened at 17.5%. Cap rate trends were primarily up across the major markets. However, Vancouver and Halifax remained unchanged, while Edmonton observed a decrease.
Tier 1 regional mall cap rates decreased to 6.20%. Most major markets experienced a decrease in their cap rates quarter-over-quarter, except for Vancouver, which observed an increase and Halifax which remained unchanged.
Barometer highlights include:
Of the 128 combinations of products and markets covered in the Investment Trends Survey for Q1 2024:
50 had a “positive” momentum ratio (i.e., a higher percentage of respondents said they were more likely to be a buyer than a seller in that particular segment), down one from what was reported in Q4 2023; 78 had a “negative” momentum ratio, up one of what was reported in Q4 2023.
The top 15 products/markets which showed the most positive momentum were:
Calgary – Suburban multiple unit residential
Toronto – Food-anchored retail strip and multi-tenant industrial
Ottawa – Suburban multiple unit residential, food-anchored retail strip, and multi-tenant industrial
Montreal – Multi-tenant industrial and single tenant industrial
Quebec City – Food-anchored retail strip
Edmonton – Food-anchored retail strip and suburban multiple unit residential
Halifax – Suburban multiple unit residential and food-anchored retail strip
Vancouver – Multi-tenant industrial and food-anchored retail strip
Authors

Jennifer Nhieu
Senior Research Analyst
Authors
Jennifer Nhieu
Senior Research Analyst