
Key highlights
The increase in cap rates is reflective of fewer transactions in Canada, which dropped by almost 50% compared to 2022
As the Bank of Canada continued to focus on inflationary control measures with its 2% inflation target, the average OCR increased to 5.88% from 5.77% in Q4 2023
In 2023, the demand for industrial and multi-family products remained unabated, as both were supported by strong underlying demographic and economic fundamentals
The top three preferred markets for investors across all asset classes were Vancouver, Toronto, and Ottawa, respectively
The top three preferred property types by investors in Q4 2023 were suburban multiple-unit residential, multi-tenant industrial, and food-anchored retail strip, respectively
The top three preferred combinations were Vancouver – suburban multiple-unit residential, followed by food-anchored retail strips in Montreal and Vancouver, respectively
Investors remain committed to stable, low-risk asset types as elevated interest rates and continued price discovery processes slowed transaction activity
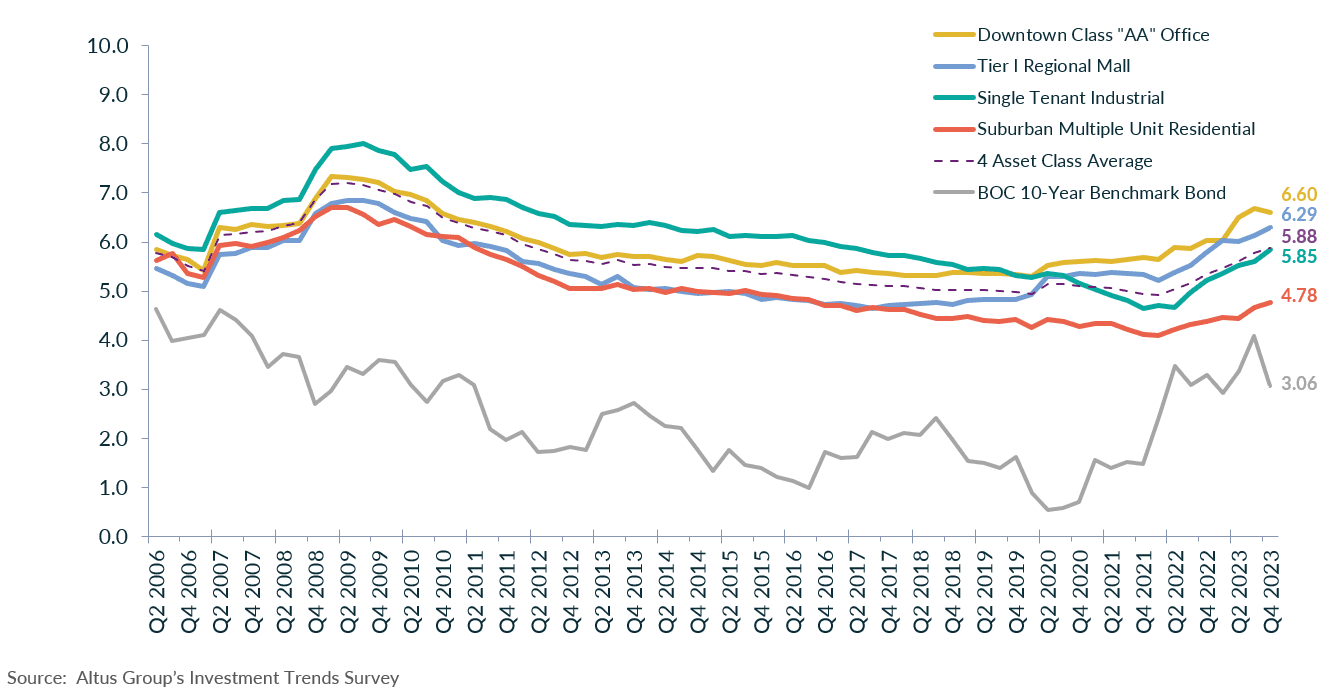
The latest results from Altus Group’s Canadian Investment Trends Survey (ITS) for the four benchmark asset classes show that the overall capitalization rate (OCR) rose slightly to 5.88% in Q4 2023 compared to the previous quarter at 5.77% (Figure 1). The increase in cap rates is reflective of fewer transactions in Canada, which dropped by almost 50% compared to 2022. This reduction in activity could be attributed to higher interest rates, changing buyer and seller expectations along with some economic uncertainty in 2023.
According to Statistics Canada’s Labour Force Survey (LFS), as of November 2023, employment remained virtually unchanged (+25,000; 0.1%), with the unemployment rate up slightly (0.1 percentage points) to 5.8%. Increased layoffs in the wake of macroeconomic headwinds and softening labour market conditions have contributed to the unemployment rate increase. Gains in employment were noted in manufacturing and construction. Meanwhile, losses in employment were noted in wholesale and retail trade and finance, insurance, real estate, and rental and leasing.
The Bank of Canada’s (BoC) bond rate, as of December 23, 2023, was recorded at 3.06%, decreasing by 103 bps since the end of Q3 2023. As the BoC continued to focus on inflationary control measures with its 2% inflation target, the average OCR increased to 5.88% from 5.77% in Q4 2023. Cap rates have steadily increased across most asset classes, with the exception of the downtown class AA office segment. This trend does not come as a surprise; investors have adjusted to unfavourable economic conditions, thus contributing to a slowdown in investment activity and the inevitable increase in cap rates. However, in 2023, the demand for industrial and multi-family products remained unabated, as both were supported by strong underlying demographic and economic fundamentals.
Figure 1 - National markets - OCR trends for four benchmark asset classes
Commercial investment activity
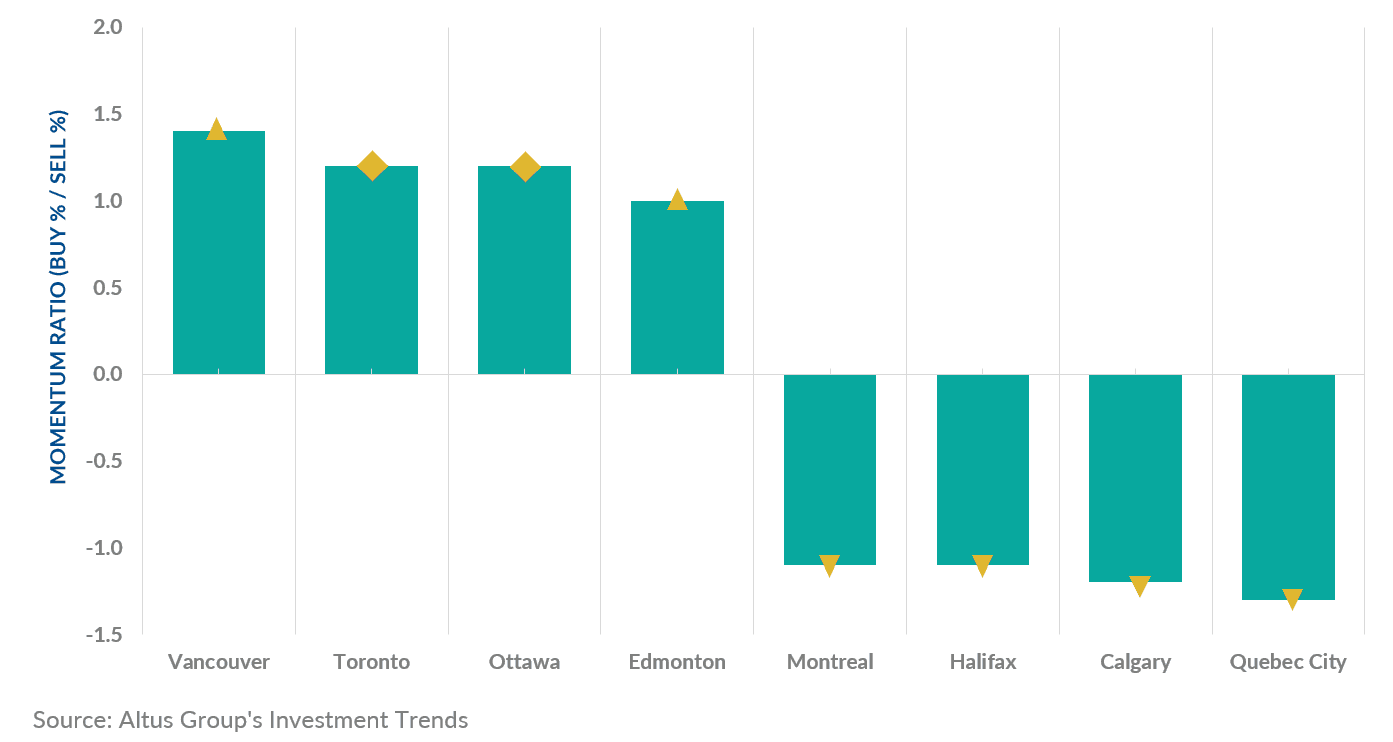
2023 was the year of price discovery, as investors adjusted to higher financing costs and tightened lending practices. The top three preferred markets for investors across all asset classes were Vancouver, Toronto, and Ottawa, respectively (Figure 2). Vancouver climbed by four places to the top spot as the top preferred market in Q4 2023, while Toronto remained second. The location barometer reported a mostly downward trend in the momentum ratio (percentage of investors looking to buy/percentage of investors looking to sell) across all markets compared to the previous quarter, which reported a mixed trend. Vancouver, the most preferred market, reported an upward momentum, while Toronto and Ottawa remained unchanged.
Figure 2 - Location barometer - All available products (Q4 2023)
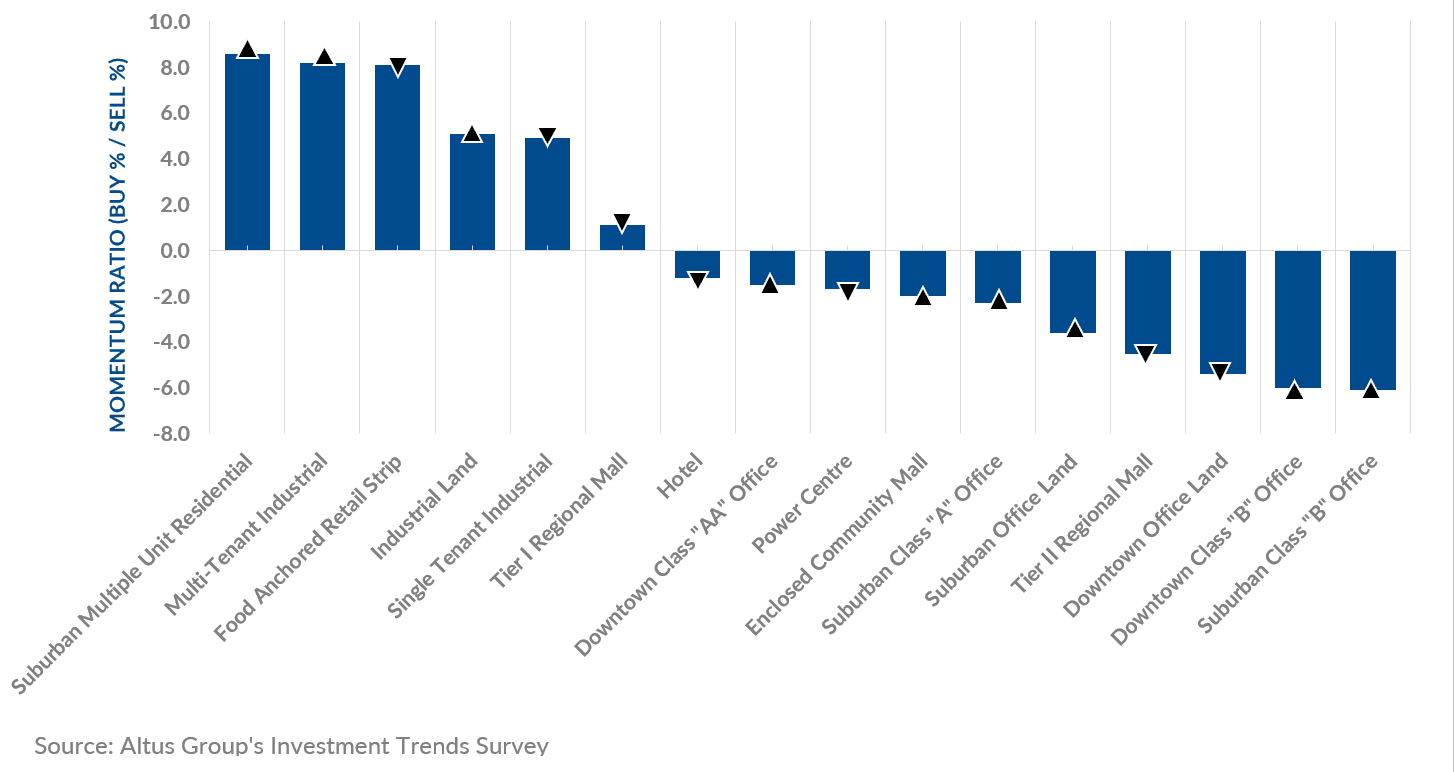
The top three preferred property types by investors in the fourth quarter of 2023 were suburban multiple-unit residential, multi-tenant industrial, and food-anchored retail strip, respectively (Figure 3). Limited inventory has driven the steady and strong demand for multi-family and industrial products. However, a return to moderation has been observed in the fourth quarter after the feverish demand reported in the first half of 2023. Moreover, as flexible work arrangements have become commonplace in Canada, more time has been spent at home and in local neighbourhoods, which has allowed community-level retail centres to thrive. In addition, all office-type assets had a negative momentum ratio with concerns around elevated availability rates. Conversely, suburban multiple-unit residential and multi-tenant industrial reported an increase in momentum ratio.
Figure 3 - Property type barometer - All available products (Q4 2023)
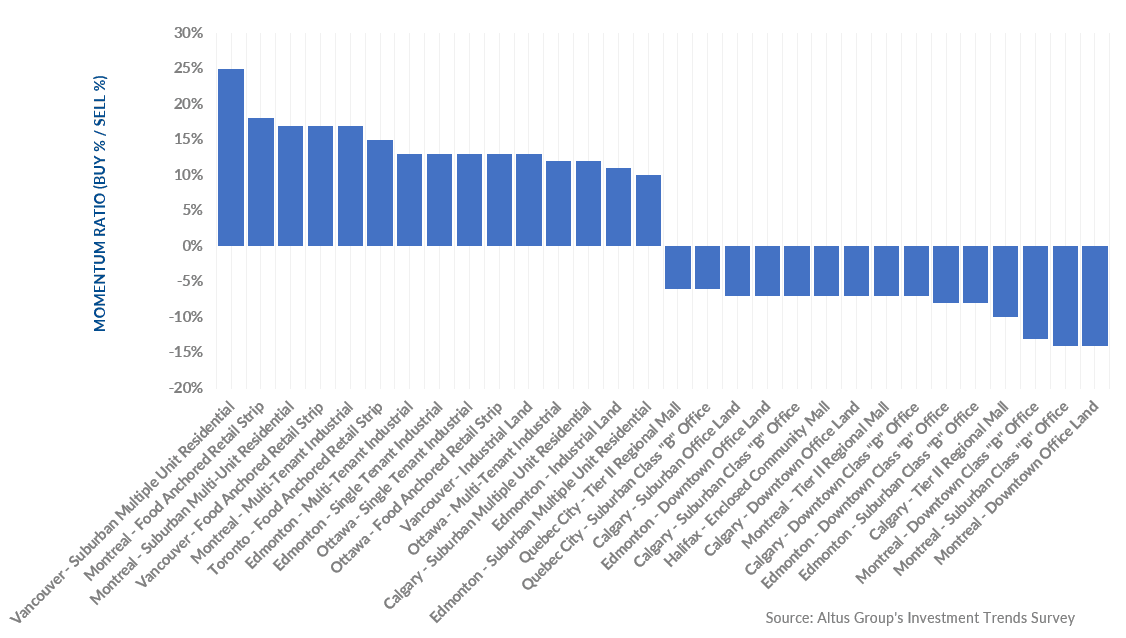
According to the Product/Market barometer, the top three preferred combinations were Vancouver – suburban multiple-unit residential, followed by food-anchored retail strips in Montreal and Vancouver, respectively (Figure 4). The 15 least preferred combinations largely revolved around office and mall assets. Challenges created by elevated interest rates and underlying inflationary pressures have led investors to rebalance their portfolios with low-risk assets providing stable returns, such as residential, industrial, and food-anchored retail.
Figure 4 - Product/Market barometer - All available products (Q4 2023) – Top 15 preferred/least preferred
Market highlights for the quarter include:
Cap rates for suburban multiple-unit residential increased to 4.78%. The suburban multiple-unit residential cap rate increased by 0.11% quarter-over-quarter. Cap rates across all markets were mixed. Half experienced an increase, while the other half remained unchanged. Quebec City and Montreal recorded the highest increase of 0.3%.
Cap rates for single-tenant industrial increased to 5.85%. The national industrial availability rate increased to 4.3%. Five of the eight major markets experienced an increase in their cap rate quarter-over-quarter, except for Vancouver and Edmonton (both unchanged) and Calgary (down).
Downtown class AA office cap rates eased slightly to 6.60%. The national office availability rate flattened at 17.6%. Cap rate trends were primarily down across the major markets. However, Vancouver and Edmonton observed an increase, while Montreal remained unchanged.
Tier 1 regional mall cap rates increased slightly to 6.29%. All major markets experienced an upward pressure in their cap rates, apart from Vancouver, which remained unchanged.
Barometer highlights include:
Of the 128 combinations of products and markets covered in the Investment Trends Survey for Q4 2023:
51 had a “positive” momentum ratio (i.e., a higher percentage of respondents said they were more likely to be a buyer than a seller in that particular segment), down four from what was reported in Q3 2023; 77 had a “negative” momentum ratio, up four of what was reported in Q3 2023.
The top 15 products/markets which showed the most positive momentum were:
Calgary – Suburban multiple-unit residential
Toronto – Food-anchored retail strip
Ottawa – Food-anchored retail strip, single-tenant industrial, multi-tenant industrial
Montreal – Food-anchored retail strip, multi-tenant industrial, suburban multiple-unit residential
Edmonton – Multi-tenant industrial, single-tenant industrial, industrial land, suburban multiple-unit residential
Vancouver – Suburban multiple-unit residential, food-anchored retail strip, industrial land
Author

Jennifer Nhieu
Senior Research Analyst
Author
Jennifer Nhieu
Senior Research Analyst
Resources
Latest insights