Canadian commercial real estate market update – Q4 2025
Canada's 2025 commercial real estate market held firm at $52.9B as retail led gains, hotel momentum built, and investors moved toward active deployment.

Key highlights:
Source: Altus Data Studio market data and analysis
The Canadian commercial real estate market demonstrated structural stability in 2025, recording $53 billion in investment volume, a marginal 6% year-over-year decline
Retail emerged as the year’s premier asset class, with a 17% increase in investment volume driven by intense demand for defensive, food-anchored assets, and shopping centres with redevelopment potential
The office sector experienced a pronounced divide as institutional capital favoured premium Class AAA assets while Class B properties faced accelerated obsolescence
Montreal led the major markets with 5% growth, contrasting with notable investment contractions in Vancouver and Ottawa
Strengthening fundamentals in the hospitality industry and 2026 FIFA World Cup preparations propelled the hotel sector to a 7% year-over-year increase in transaction volume
While national industrial volume moderated by 4%, robust leasing momentum persisted across the Calgary, Edmonton, and Greater Golden Horseshoe (GGH) industrial hubs
Investor sentiment has transitioned from capital preservation toward proactive deployment as a new pricing equilibrium and interest rate stability take hold
Investment volume and core drivers of contraction
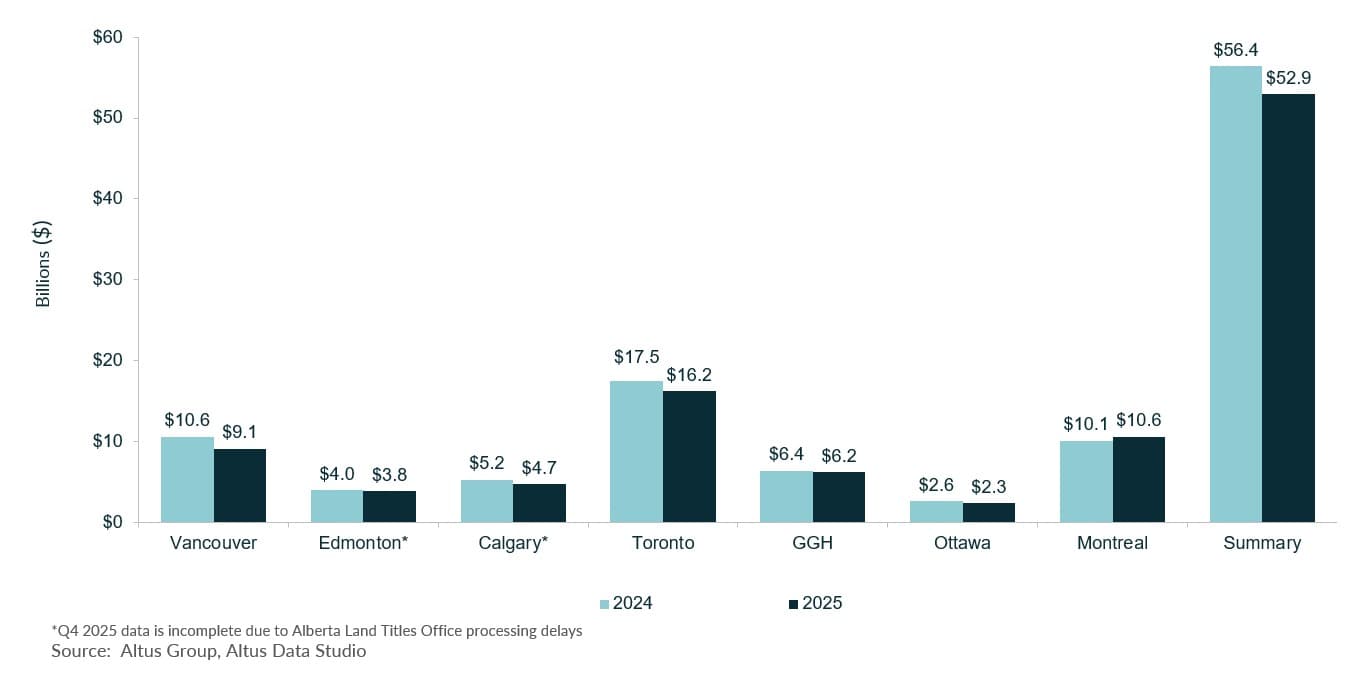
Throughout 2025, the Canadian commercial real estate market underwent a strategic reassessment, concluding the fiscal year with structural resilience despite a complex macroeconomic backdrop. Based on Altus Data Studio data, total investment volume reached $52.9 billion, representing a marginal 6% year-over-year decline (Figure 1). However, this figure’s downward trajectory was largely attributed to an atypical surge in activity during the second quarter of 2024, when investors accelerated deal closures to precede a proposed capital gains tax increase. Although the federal government subsequently rescinded this policy in the first quarter of 2025, the initial rush created an artificially elevated benchmark that skewed annual comparisons.
Figure 1: Canada’s total investment activity YTD – All sectors by region (2024 vs. 2025)
Investor confidence in core assets remained steadfast despite heightening geopolitical tensions during the first half of the year. This period of normalization proved essential for mitigating previous market volatility and established a sustainable foundation for future valuation growth. While caution peaked in the second quarter of 2025 due to shifting perceptions of the Canadian economy, stability improved in the latter half of the year. This recovery was bolstered by the Canada-United States-Mexico Agreement (CUSMA), which functioned as a critical legal safeguard against US trade protectionism and provided necessary predictability for cross-border capital flows.
Monetary policy reached a definitive turning point on December 10, 2025, when the Bank of Canada (BoC) maintained its overnight rate at 2.25% following two consecutive reductions. This pause was deemed appropriate as national GDP growth stalled, with the economy recording an annualized contraction of 0.6% in the fourth quarter. Furthermore, the labour market exhibited signs of softening, with the unemployment rate rising to 6.8% as the influx of job seekers outpaced domestic hiring capacity.
In response to these conditions, the investment community adopted a disciplined approach characterized by rigorous capital preservation. According to the latest Investment Trends Survey, food-anchored retail strips maintained their position as the most attractive property type for the eighth consecutive quarter (Figure 2).
Figure 2: Investment Trends Survey (ITS) - Property type barometer - All available products (Q4 2025)
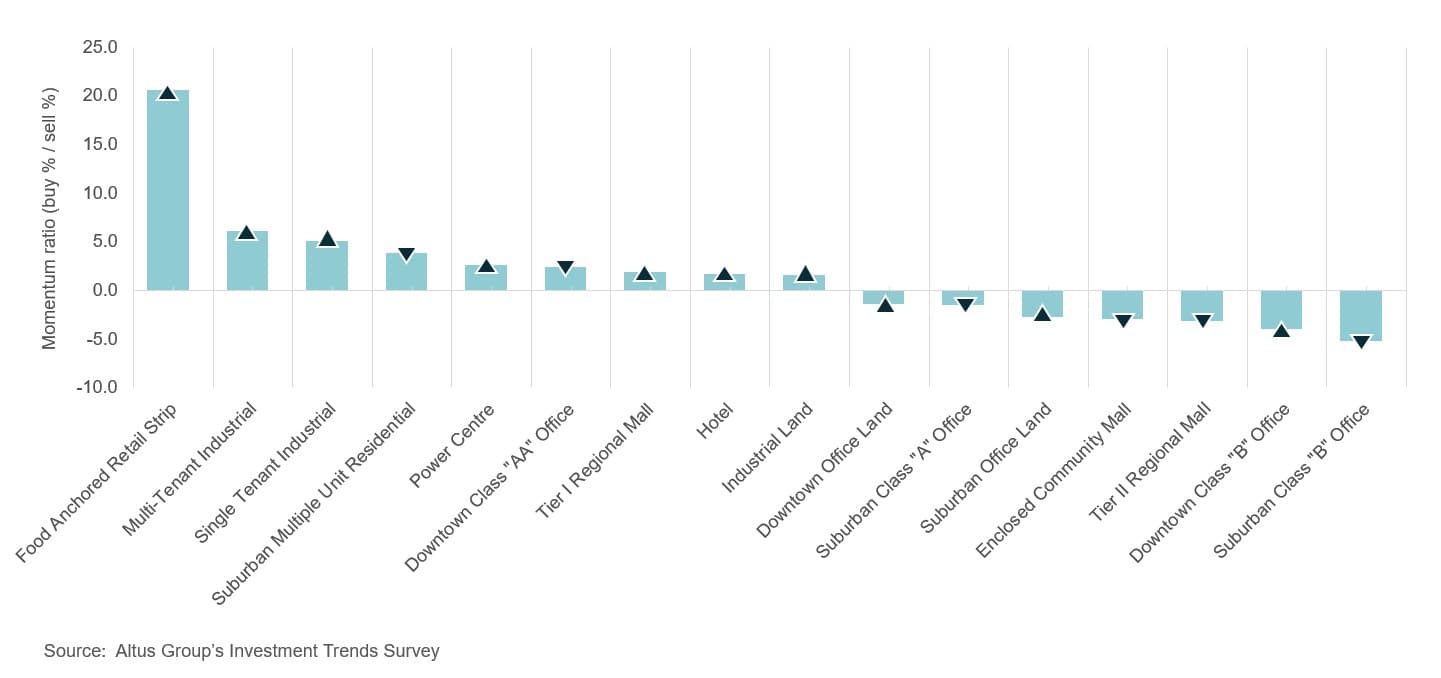
This sustained demand drove a 17% year-over-year increase in retail investment volume. Consequently, property owners prioritized balance sheet management, emphasizing conservative refinancing strategies and reducing speculative development. Throughout the year, developers favoured liquidity over aggressive expansion while awaiting clearer signals regarding long-term neutral interest rates.
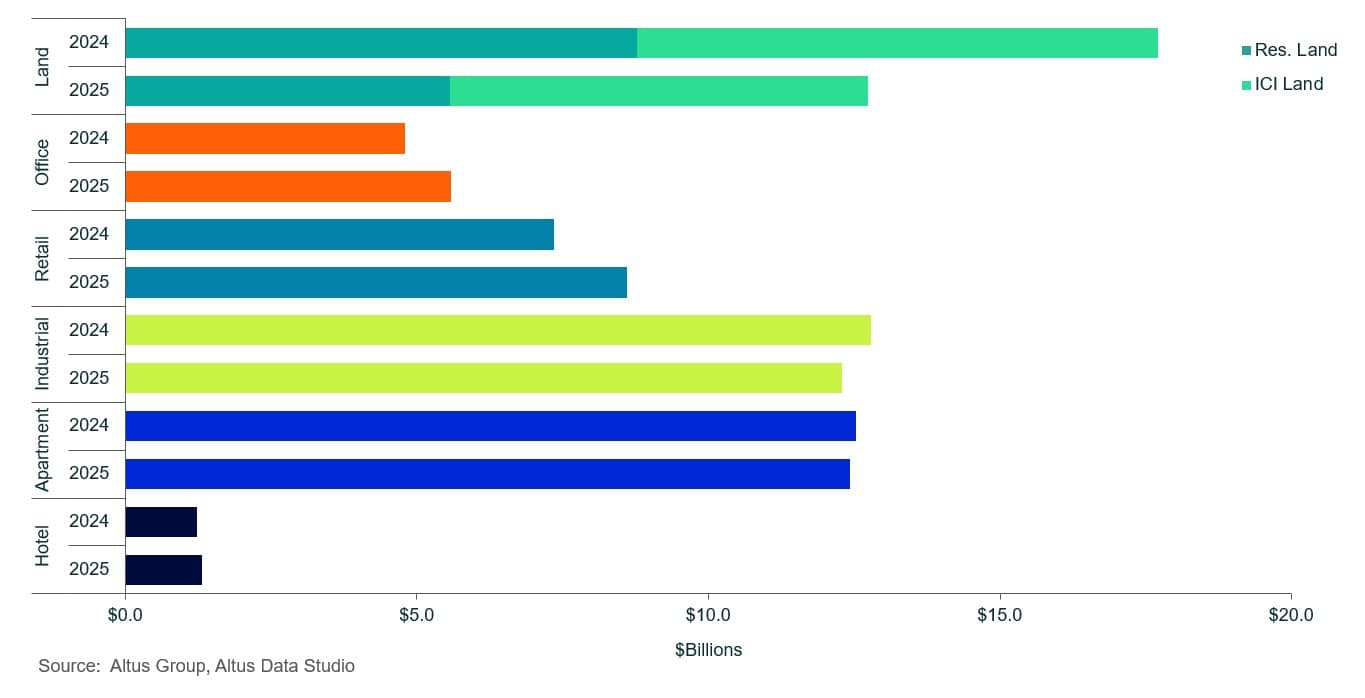
Figure 3: Canada’s property transactions by asset class (2024 vs. 2025)
Regional investment performance
In 2025, Canadian commercial real estate investment activity experienced a broad downturn across most major metropolitan areas, though localized pockets of growth suggested a fragmented recovery. Montreal emerged as a leading performer among the tracked eastern markets, recording a 5% year-over-year increase with $10.6 billion in total transaction volume. This expansion was primarily fuelled by robust demand in the multi-family and retail sectors, notably highlighted by significant suburban multi-family acquisitions and the $565 million divestiture of Promenades St-Bruno, the largest retail transaction of the fiscal year.
The Greater Golden Horseshoe (GGH) demonstrated notable resilience, transacting $6.2 billion in dollar volume. Although this represented a marginal 3% year-over-year decrease in total volume, specific asset classes outperformed the broader market. The industrial, retail, and multi-family sectors saw significant year-over-year increases of 51%, 24%, and 15%, respectively, as investors prioritized defensive assets in the region.
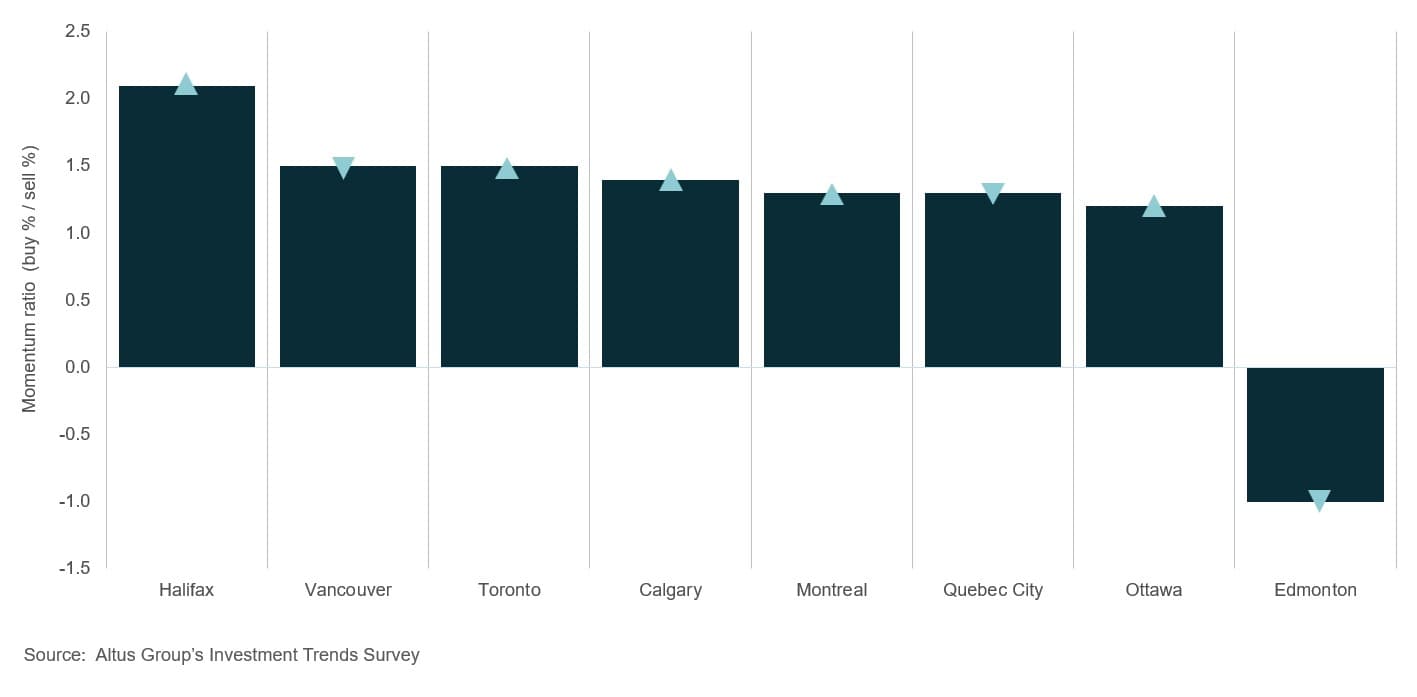
Conversely, Vancouver reported a notable 14% contraction in investment volume. Despite this pullback, the Investment Trends Survey confirmed that Vancouver remained among the top three investor-preferred markets across asset classes for nine consecutive quarters (Figure 4). While the market registered a negative momentum ratio, indicating a higher proportion of sellers than buyers, the office and hotel sectors posted localized year-over-year growth of 92% and 204%, respectively, coming off very low levels in the previous year. Expanded return-to-office mandates and a recovery in corporate travel revitalized high-volume tourism and convention-related assets.
Figure 4: Investment Trends Survey (ITS) - Location barometer (Q4 2025)
In the nation’s capital, Ottawa experienced a 10% decline in investment activity, totalling $2.3 billion. This downturn was largely driven by a 73% decline in office sector transactions, which fell to $99 million amid persistent uncertainty about federal return-to-office strategies. Concurrently, the market for Class AAA trophy assets faced a dwindling supply, which limited investment activity as existing owners remained reluctant to divest high-quality inventory amid volatility.
The Greater Toronto Area (GTA) recorded a moderate deceleration, with total transaction volume reaching $16.2 billion, an 8% year-over-year decrease. Institutional interest remained concentrated in defensive assets such as food-anchored retail, resulting in a 16% increase in investment. Furthermore, the GTA maintained its position as the national epicentre for industrial activity, recording $5.3 billion in volume, a 4% decline that represented the lowest contraction in industrial investment among the major markets.
Comprehensive data for the Alberta markets, including Calgary and Edmonton, remained incomplete at the time of reporting due to significant processing delays at the Alberta Land Titles Office. While current indicators for these markets show promising momentum, recording $4.7 and $3.8 billion in dollar volume transacted as of October 2025, with upward growth trajectories for the office and industrial sectors in Calgary and the retail and hotel sectors in Edmonton.
Retail sector
The Canadian retail sector demonstrated significant structural strength throughout 2025, recording a total transaction volume of nearly $8.6 billion. This represented a 17% year-over-year increase, solidifying the asset class as a primary driver of investment activity alongside office for the fiscal year. Food-anchored retail assets remained at the forefront of investor preference, as these essential-service properties were highly valued for their defensive qualities. Specifically, investors prioritized these assets for their historically higher occupancy rates, lower tenant turnover, and inherent resistance to e-commerce disruption and broader macroeconomic volatility.
This sustained demand, coupled with the property type’s efficacy as an inflation hedge, exacerbated an acute inventory shortage. Property owners increasingly retained high-performing, income-producing assets, while restricted lending and the elevated cost of capital severely limited new development starts. Consequently, near-term investment activity was constrained by limited product availability and high financing costs. In response, market participants focused on intensifying existing sites. Many owners explored adding residential components to suburban shopping centres to maximize land value and create mixed-use hubs that leveraged established consumer traffic.
From a regional perspective, nearly all major markets reported positive year-over-year growth, with the notable exception of Calgary. The Calgary market recorded $690 million in transaction volume, representing a 21% decline (though 2025 data are incomplete). However, this contraction followed a record-breaking 2024, during which the sector achieved an unprecedented $871 million in volume. Furthermore, Calgary’s construction pace failed to keep pace with demand, resulting in a shortage of prime retail inventory that hindered further transaction activity.
Edmonton recorded the highest year-over-year growth at 81%, totalling nearly $620 million in volume. This surge was primarily driven by Primaris REIT’s acquisition of a 50% interest in Southgate Centre from Ivanhoe Cambridge for approximately $208 million. Following the sale's closure, Southgate Centre became Primaris’ largest asset by both total store sales volume and same-store sales productivity. Meanwhile, Vancouver and the GGH both recorded $1.3 billion in investment volume, marking increases of 31% and 24%, respectively. The GTA maintained the highest absolute volume at $2.4 billion, a 16% increase, while Ottawa and Montreal followed with $331 million and $1.9 billion, representing a 14% and 13% year-over-year rise, respectively.
Office sector
The Canadian office landscape continued to navigate shifting workplace preferences and the enforcement of return-to-office mandates throughout 2025, resulting in a pronounced market bifurcation. According to the latest Altus Group Canadian office market update, the national office availability rate contracted by 140 basis points (bps) year-over-year to 16.0% (Figure 5). Improved tenant utilization rates and a significant reduction in new construction starts primarily drove this tightening. As the supply of modern, top-tier inventory dwindled, market participants were increasingly compelled to re-evaluate older Class A assets, placing greater strategic emphasis on repositioning well-located secondary properties.
Figure 5: Office availability rates (Q4 2024 vs Q3 2025 vs Q4 2025)
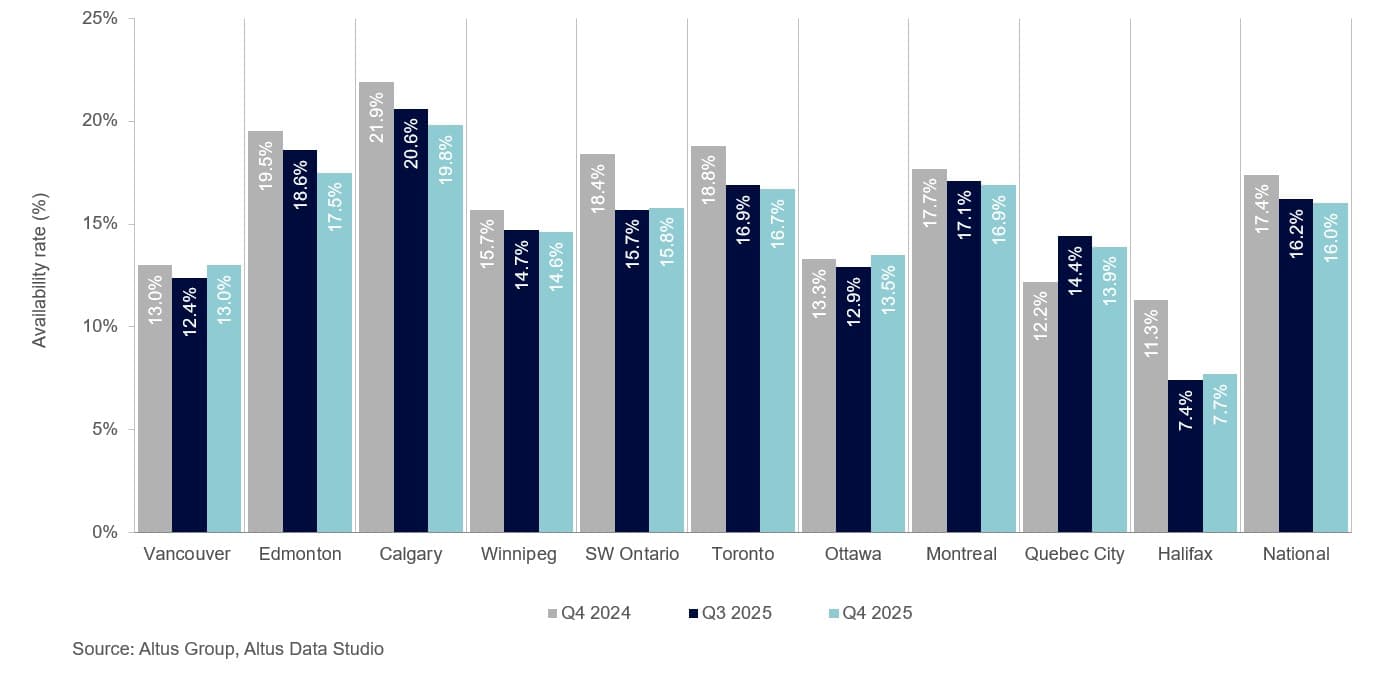
Despite broader economic headwinds, the office sector recorded nearly $5.6 billion in transaction volume, representing a notable 17% year-over-year increase. Investment activity was heavily concentrated within the Class AAA segment, as institutional capital prioritized premium, amenitized assets. This flight to quality was reflected in the national downtown direct Class A availability rate, which increased only 10 bps to 11.5%. Transaction data further corroborated this preference:
Class A transactions accounted for the majority of market activity with 522 deals encompassing 17.3 million square feet
Conversely, Class B office space saw significantly lower demand, comprising only 153 transactions totalling nearly 3 million square feet, highlighting the growing obsolescence of aging, suburban non-amenitized inventory
Regional performance varied significantly, with Vancouver registering a 92% year-over-year increase in dollar volume to $2.5 billion. This surge was primarily attributed to the landmark $1.2 billion acquisition of The Post by Pontegadea in the fourth quarter. As the largest single-asset office transaction in Canadian history, this deal served as a major indicator of global confidence in Vancouver’s core. Notably, excluding this outlier, the region's year-over-year investment volume would have remained flat.
Calgary followed with $664 million in transaction volume, a 53% increase year-over-year. The market benefited from strong leasing momentum in Class AAA spaces and continued to lead the nation in office-to-residential conversions, with municipal plans to remove six million square feet of vacant inventory by 2031. Montreal also demonstrated robust performance, with $626 million transacted, a 27% increase, headlined by KingSett Capital’s $101 million acquisition of 1200 McGill College Avenue.
In contrast, Ottawa reported the largest contraction, with investment volume falling 73% to $99 million, reflecting a significant pause in capital deployment in the federal capital. Edmonton, the GGH, and the GTA also recorded year-over-year decreases of 36%, 35%, and 19%, respectively.
Hotel sector
The Canadian hotel sector achieved a total transaction volume of $1.3 billion in 2025, marking a 7% year-over-year increase. This expansion was underpinned by strengthening market fundamentals and a consistent rise in occupancy demand. The industry benefited significantly from a revitalized professional landscape and a robust recovery in high-volume tourism, which collectively bolstered asset performance throughout the fiscal year.
This upward trajectory was sustained as expanded return-to-office mandates fostered a resurgence in corporate travel and large-scale conventions. Furthermore, leisure tourism demonstrated notable resilience, supported by the preliminary economic impact and infrastructure preparations associated with the 2026 FIFA World Cup. Investors increasingly view hospitality assets as a strategic component of diversified portfolios, favouring the sector for its unique ability to adjust average daily rates in real time to hedge against inflationary pressures and shifting market conditions.
From a regional perspective, Vancouver recorded the highest year-over-year growth in hotel investment, with $1.6 billion transacted, a 204% increase. This surge was primarily attributed to the acquisition of the Hyatt Vancouver Downtown Alberni (formerly Shangri-La Vancouver) by Brookfield Asset Management from Westbank Corp., and Peterson Group via a share sale for a combined $160 million.
Montreal followed with a 93% year-over-year increase, reaching $130 million in volume. Given the city’s status as a premier destination for global sporting and cultural events, the annual Formula 1 Canadian Grand Prix continued to provide a guaranteed seasonal peak in occupancy and revenue, while the return of international music festivals and film events drove record summer hotel stays. Additionally, the Ottawa and GTA markets observed year-over-year increases of 65% and 8%, respectively.
Industrial sector
The Canadian industrial sector underwent a period of strategic moderation in 2025, recording a total transaction volume of $12.3 billion. This figure represented a modest 4% year-over-year decline, primarily driven by a deliberate deceleration in capital deployment in the second quarter. During this period, investors adopted a “wait-and-see” approach as they navigated significant disruptions from escalating geopolitical tensions and broader macroeconomic shifts. These headwinds necessitated a highly selective acquisition strategy, with capital diverted to core, functional assets that offered long-term stability rather than speculative high-growth plays.
Despite the trade uncertainties, industrial leasing momentum remained remarkably resilient in key regional hubs. The Calgary, Edmonton, and GGH markets emerged as primary drivers of activity, posting year-over-year increases in investment volume of 74%, 31%, and 51%, respectively. The outsized growth in the Alberta markets was particularly noteworthy, reflecting the region’s expanding role as a critical logistics and distribution nexus for Western Canada, supported by relatively lower land costs and a favourable regulatory environment.
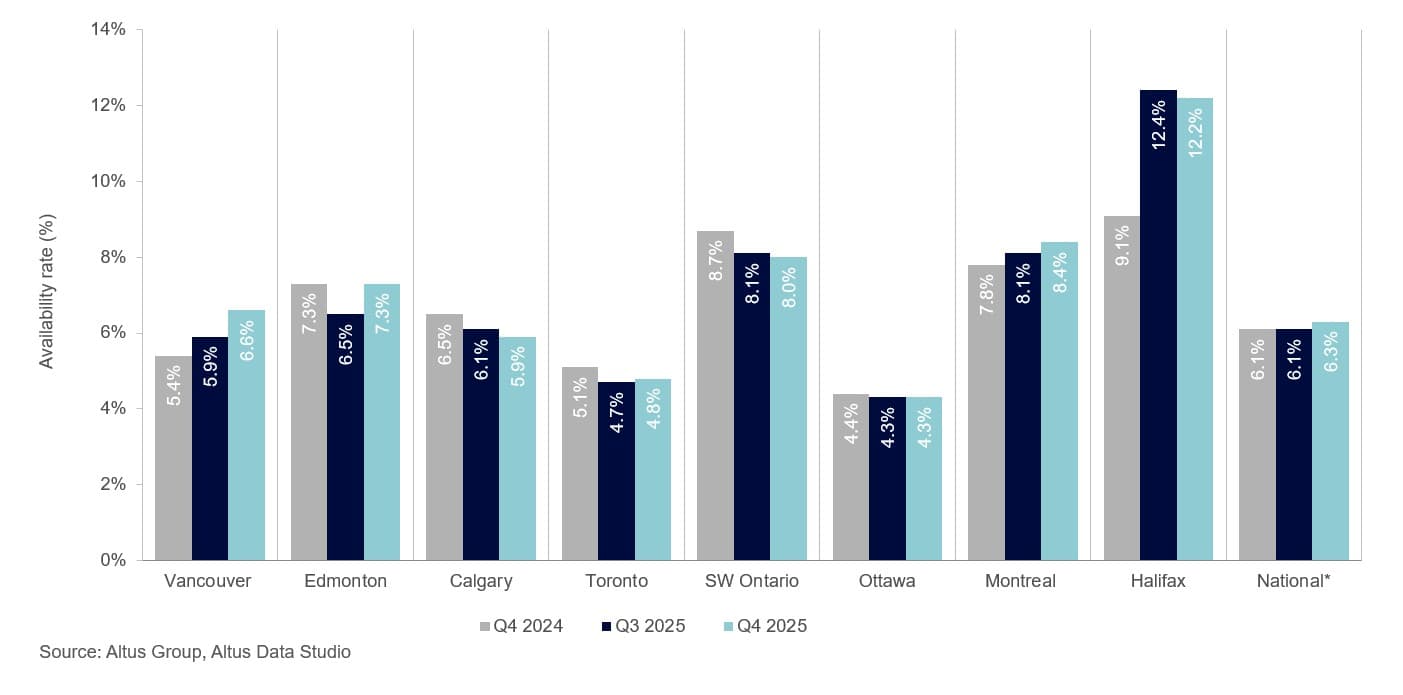
Simultaneously, the national industrial landscape navigated a nuanced rebalancing of supply and demand. According to the latest Altus Group Canadian industrial market update, the industrial availability rate rose slightly by 20 bps to 6.3% year-over-year (Figure 6). While availability edged up, the influx of new supply was tempered by a significant reduction in new construction starts, which served as a natural governor, preventing oversupply in most secondary markets. This environment effectively shifted market leverage toward occupiers, giving tenants greater flexibility in lease negotiations and more favourable rental rates for existing inventory. However, despite this softening, face rents for newly delivered, high-specification products remained elevated, reflecting the persistent premium placed on modern logistics infrastructure with high clear heights and advanced features.
Figure 6: Industrial availability rates (Q4 2024 vs Q3 2025 vs Q4 2025)
Conversely, Montreal and Vancouver experienced a significant contraction in investment volume. Vancouver recorded approximately $1.5 billion in transactions, while Montreal followed with $1.4 billion, representing a sharp departure of 24% and 44% from the record-setting activity observed in previous cycles. These declines largely reflected a “price discovery” phase, as the bid-ask spread widened between vendors accustomed to peak valuations and purchasers facing high debt-servicing costs.
Multi-family sector
The Canadian multi-family sector demonstrated notable stability in 2025, recording $12.4 billion in total transaction volume. While this represented a marginal 1% year-over-year decrease, the annual figure masked a shift in intra-year momentum. Market activity remained subdued during the first half of the year as investors grappled with elevated interest rates and a cooling rental market. However, capital deployment accelerated in the second half as macroeconomic conditions stabilized.
Regional performance was highly polarized, with Montreal and the GGH emerging as the only major markets to post positive growth. Montreal achieved a record-breaking $5.2 billion in transactions. By the end of 2025, the multi-family sector had solidified its position as the city’s premier asset class, accounting for approximately 49% of Montreal’s total commercial real estate investment volume. While the Island of Montreal remained the primary destination for capital, securing $3.4 billion, the regional narrative shifted toward strategic expansion into peripheral markets. The Laval region, in particular, saw transaction volume surge 383% to $848 million, driven by large-scale portfolio acquisitions by Broadwalk REIT and CAPREIT. The GGH continued its upward trend, with $885 million in volume, a 15% year-over-year increase.
In contrast, Calgary and Ottawa reported the most significant contractions, with investment volumes declining by 35% and 28%, respectively. It is critical to note, however, that these declines followed an exceptional 2024, during which both cities reached multi-year transaction peaks of $1.2 billion. The cooling in 2025 was further exacerbated by a surge in condominium completions. This influx of new supply exerted downward pressure on resale values and rental rates for newly completed units, giving tenants greater leverage and challenging the yield performance of traditional multi-family assets.
Despite these supply-side pressures, the sector remained defined by a deepening housing affordability crisis. Elevated homeownership costs effectively sidelined prospective first-time buyers, ensuring a consistent floor for rental demand. Nevertheless, the competitive landscape created by the new condominium inventory tempered rental income stability and limited the potential for short-term capital appreciation for many property owners.
Market outlook
As the Canadian real estate market transitioned into 2026, the prevailing sentiment among the investment community was one of cautious optimism, underpinned by a return to fundamental valuation principles. The structural reassessment that defined much of 2025 successfully established a more sustainable pricing floor, effectively narrowing the bid-ask spread that had previously hindered transaction velocity. Investors entered the new year with a refined focus on resilient growth, prioritizing assets that demonstrated clear hedging capabilities against lingering inflationary pressures.
The stabilization of the BoC’s overnight rate provided much-needed clarity for debt capital markets, allowing for more predictable underwriting. Investor appetite for defensive, essential-service assets, specifically food-anchored retail, was expected to remain a cornerstone of portfolio strategies. Furthermore, the “flight-to-quality” in the office sector continued to intensify, as capital favoured well-located, amenitized environments that aligned with the evolving requirements of corporate occupiers.
Looking ahead, the market was positioned for a gradual recovery in investment volumes, bolstered by the mounting necessity to deploy capital that had accumulated on the sidelines during the previous period of price discovery. While geopolitical tensions and domestic productivity concerns remained on the horizon, the legal certainty provided by the CUSMA framework and the predictability of interest rates served as critical catalysts for renewed confidence. Consequently, the narrative for 2026 was increasingly defined by a transition from capital preservation to the pursuit of strategic opportunities in a “higher-for-longer” interest rate environment.
Want to be notified of our new and relevant CRE content, articles and events?
Disclaimer
This publication has been prepared for general guidance on matters of interest only and does not constitute professional advice or services of Altus Group, its affiliates and its related entities (collectively “Altus Group”). You should not act upon the information contained in this publication without obtaining specific professional advice.
A number of factors may influence the performance of the commercial real estate market, including regulatory conditions and economic factors such as interest rate fluctuations, inflation, changing investor sentiment, and shifts in tenant demand or occupancy trends. We strongly recommend that you consult with a qualified professional to assess how these and other market dynamics may impact your investment strategy, underwriting assumptions, asset valuations, and overall portfolio performance.
No representation or warranty (express or implied) is given as to the accuracy, completeness or reliability of the information contained in this publication, or the suitability of the information for a particular purpose. To the extent permitted by law, Altus Group does not accept or assume any liability, responsibility or duty of care for any consequences of you or anyone else acting, or refraining to act, in reliance on the information contained in this publication or for any decision based on it. The distribution of this publication to you does not create, extend or revive a client relationship between Altus Group and you or any other person or entity. This publication, or any part thereof, may not be reproduced or distributed in any form for any purpose without the express written consent of Altus Group.
Authors

Jennifer Nhieu
Senior Research Analyst
Authors
Jennifer Nhieu
Senior Research Analyst
Resources
Latest insights