Canadian CRE investment trends - Q4 2025
Our Q4 2025 update examines investment activity and valuation metrics for 32 property types across Canada’s top eight markets.

Key highlights
Altus Group’s latest Canadian CRE Investment Trends Survey (ITS) results indicated that the Overall Capitalization Rate (OCR) for the four benchmark asset classes decreased by a negligible 1 basis point to 5.92% from the previous quarter
Halifax, Vancouver, and Toronto emerged as the leading preferred markets for investors across all primary asset classes in Q4 2025
Food-anchored retail strips remained the most sought-after property type for the eighth consecutive quarter, followed by multi-tenant and single-tenant industrial properties, respectively
Food-anchored retail strip in Toronto was the top product-market combination, followed by food-anchored retail strip in Montreal, Edmonton, and Ottawa
The survey revealed 68 out of 128 product-market combinations reported a positive momentum ratio, down ten from Q3 2025
Monetary policy and interest rate environment
During the final quarter of 2025, the Canadian economy demonstrated an unanticipated level of resilience in the face of escalating US trade protectionism. This stability was largely attributed to the robust legal frameworks provided by the Canadian-United States-Mexico Agreement (CUSMA), which acted as a critical buffer against external shocks. Despite this fortitude, a sense of caution permeated the market as the outlook for 2026 remained clouded by shifting geopolitical tensions and significant revisions to domestic immigration policies.
On December 10, 2025, the Bank of Canada (BoC) elected to maintain the target for the overnight rate at 2.25%, following two consecutive rate cuts at prior meetings. Governing Council signalled a shift in its monetary stance, suggesting that the easing cycle had concluded, contingent upon the absence of further economic turbulence.
This pause was supported by a variety of key indicators, including a Real Gross Domestic Product (GDP) increase of 0.6% in the third quarter of 2025 (an annualized rate of 2.6%). While this headline figure suggested a rebound from the 1.8% contraction in the second quarter, economists characterized the growth as “fragile.” The expansion was driven almost entirely by a favourable trade balance. Specifically, a 2.2% decline in imports and a surge in government defence spending, rather than robust domestic activity.
Labour market conditions showed signs of stabilization as the unemployment rate reached 6.8% in December, continuing a recovery from the September peak of 7.1%. However, this rate followed a 0.3 percentage-point increase from November, as more people searched for work amidst broader economic uncertainty.
However, inflationary pressures remained a primary concern for the BoC. The November 2025 Consumer Price Index (CPI) reported headline inflation at 2.2%, maintaining the upward trajectory observed in October. Food costs largely drove the persistence of inflation. Grocery price inflation reached 4.7% in November, the highest level recorded since late 2023, driven by significant price increases in beef and coffee.
While the labour market showed little change, domestic demand remained constrained. Household consumption declined by 0.1%, and business investment in machinery and equipment fell sharply, as high living costs and trade uncertainty led to a “wait-and-see” approach, stifling overall economic momentum.

Leverage our real estate data and predictive analytics
The performance attribution, predictive analytics and market intelligence you need to explain performance and improve decision making.
Capitalization rate trends and market sentiment
Reflecting the elevated cost of capital and persistent economic uncertainty, Altus Group’s latest Canadian Investment Trends Survey (ITS) results indicated that the Overall Capitalization Rate (OCR) for the four benchmark asset classes flattened at 5.92% (Figure 1). This figure represented a negligible decrease of 1 basis point from the previous quarter, signalling a tentative stabilization in property valuations after nearly two years of upward pressure.
Figure 1: National markets - OCR trends for four benchmark asset classes
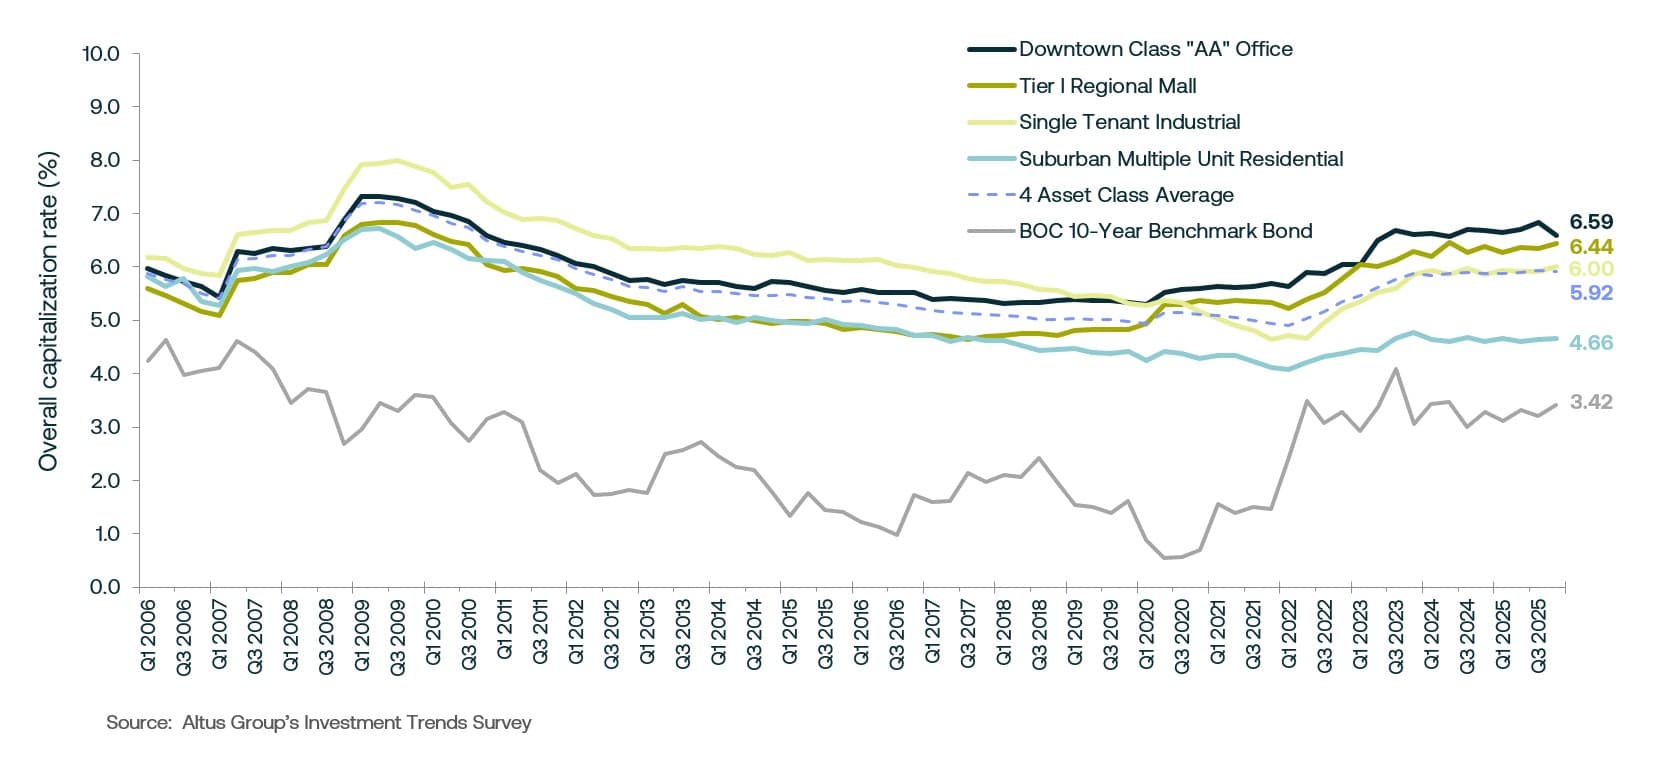
This flattening was largely attributed to a standoff between buyers and sellers. While the BoC had lowered its overnight rate to 2.25% in October 2025 and held it steady through year-end, the 10-year bond yield, a primary benchmark for long-term commercial borrowing, increased by 22 basis points to 3.42% in December. The resulting narrowing of spreads between property yields and the risk-free bond rates influenced a varied response across primary asset classes as investors adjusted to the prevailing economic landscape and sector-specific risks.
Valuation trends in the commercial real estate sector underscore a growing divergence between investor sentiment and property fundamentals. Downtown Class AA office properties saw a notable decrease in cap rates to 6.59%, a 25 basis point contraction quarter-over-quarter. This movement was driven by a robust “flight-to-quality” trend. Data indicated that downtown Class AAA vacancy rates in cities like Toronto had tightened to below 2%, as tenants migrated away from older Class B and C buildings in favour of modern, well-located, amenity-rich spaces. Investors, in turn, prioritized these high-yield, trophy assets for their relative security and potential for rental growth, even as the broader office sector continued to struggle with high overall availability.
Conversely, the single-tenant industrial capitalization rate increased to 6.00%, signalling a shift toward a more cautious pricing in the once-dominant sector. The primary driver for this expansion was a notable softening in demand fundamentals. National industrial availability rose toward 6.3% due to a surge in new supply completions and a pullback in leasing activity. Furthermore, the threat of US trade protectionism has introduced significant volatility, prompting investors to demand higher yields to compensate for the uncertainty surrounding future trade-exposed tenant performance.
Suburban multiple-unit residential capitalization rates edged upward to 4.66%, reflecting the fundamental shift in the sector’s growth narrative as the supply-demand imbalance began to normalize. This yield expansion was primarily driven by a surge in new rental completions, which significantly increased available inventory across major urban centres. Concurrently, demand softened due to slower population growth. With vacancy rates on the rise, the aggressive rent growth that previously justified lower cap rates began to decelerate.
The capitalization rate for Tier I regional malls rose to 6.44%, as the sector faced renewed headwinds from persistent headline inflation and decreased consumer spending. With grocery price inflation reaching levels not seen since 2023, discretionary household spending was significantly constrained, impacting the sales performance of non-essential retail tenants. This yield expansion reflected higher risk premiums for large-format retail, driven by elevated capital costs and structural shifts toward e-commerce.
Consequently, investment remained concentrated in resilient food-anchored retail strips, while secondary regional properties faced a widening bid-ask gap.
Canadian commercial investment activity and market sentiment
In 2025, Canada’s commercial real estate investment activity experienced a modest contraction, with total dollar volume falling to approximately $51 billion. This represented an 8% year-over-year decrease, reflecting a pronounced pullback as investors remained hesitant to deploy capital amidst sustained macroeconomic volatility. However, as the market moved toward 2026 with a more definitive outlook on interest rate stabilization, projections suggested that institutional capital would likely begin to migrate from the sidelines toward defensive, high-quality assets.
Investor preference throughout the year exhibited geographical variation, which was quantified through the “momentum ratio”, a metric derived from the ITS survey that measures respondents’ intention to acquire or divest within specific markets. During the fourth quarter, Halifax surpassed Vancouver to secure the top position in investor interest, with Vancouver and Toronto following as the second and third most sought-after markets, respectively (Figure 2). Overall, five of the eight major markets reported a positive momentum ratio, indicating that collective investor sentiment favoured acquisition over disposition.
Figure 2: Location barometer - All available products (Q4 2025)
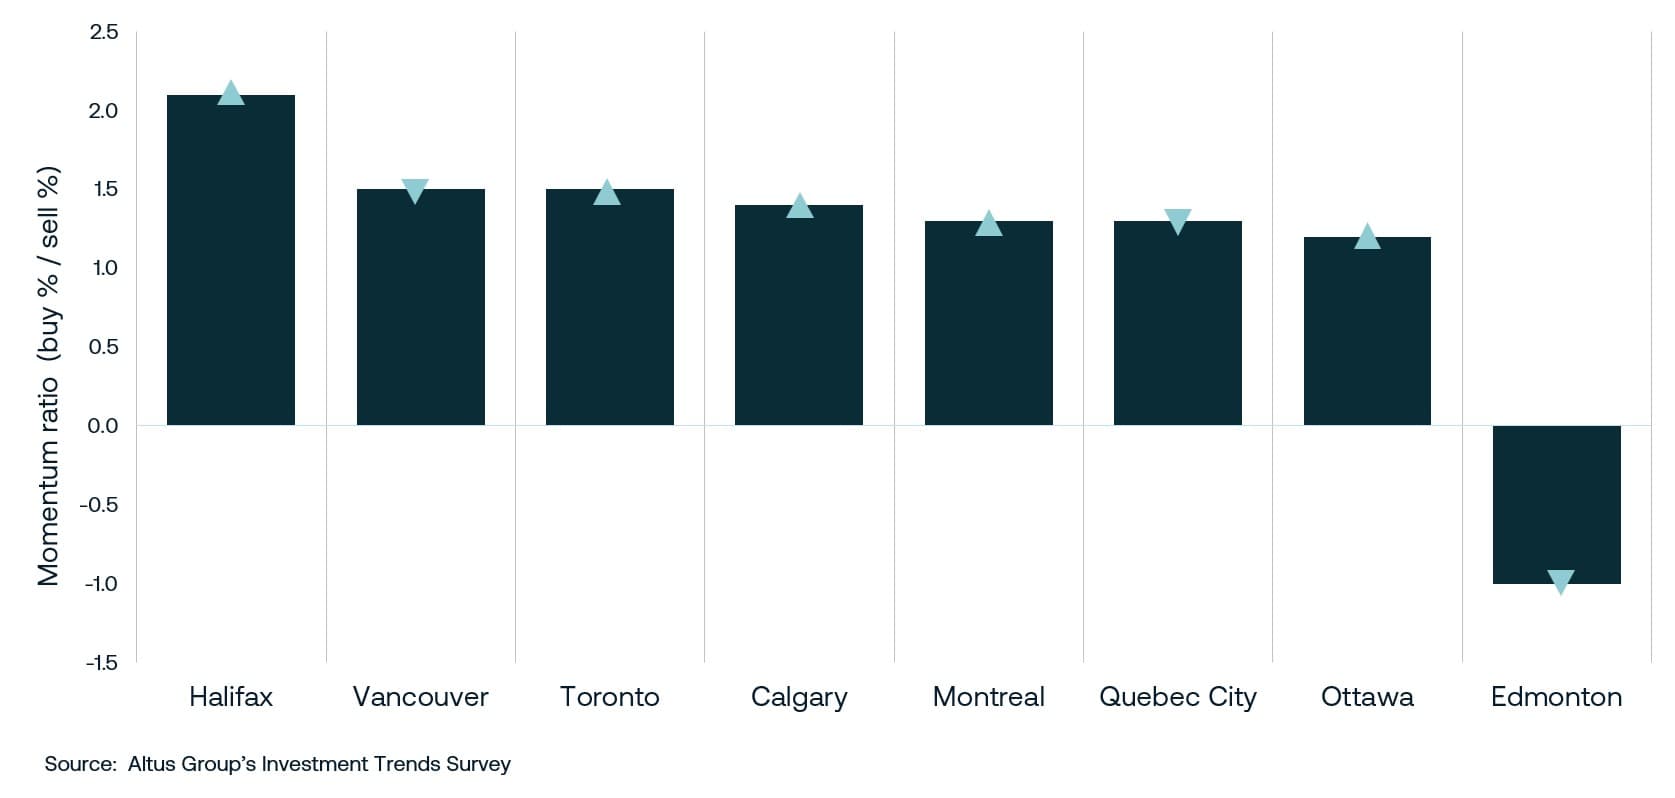
In contrast, Vancouver, Quebec City, and Edmonton reported negative momentum ratios during this period. This shift suggested that dominant investor sentiment in these specific markets had moved toward divestment and portfolio rebalancing rather than new acquisitions. These divergent results highlighted a geographically segmented risk tolerance in the Canadian capital markets, as investors increasingly favoured markets with diverse economic drivers and more resilient underlying fundamentals.
Core asset performance and investor selectivity
Throughout 2025, the Canadian commercial real estate market demonstrated sustained investor preference for stable, lower-risk assets as investors navigated a challenging macroeconomic environment. Capital deployment remained highly selective, resulting in a marked divergence in performance and sentiment across core asset classes.
Food-anchored retail strips maintained their position as the most coveted property type, extending a trend that originated in early 2024 (Figure 3). This enduring appeal reflected a fundamental shift in Canadian consumer behaviour, as persistent economic pressures redirected discretionary spending towards essential goods. Consequently, these assets proved remarkably resilient to broader economic instability. From an investor perspective, food-anchored properties were viewed as highly defensible, characterized by superior occupancy rates, minimal tenant turnover, and consistent cash flows driven by reliable foot traffic. This perceived security led to a chronic shortage of available inventory, as existing property owners remained reluctant to divest. Furthermore, constrained leading environments and elevated construction costs limited new development, intensifying competition for a diminishing pool of existing assets.
Figure 3: Property type barometer - All available products (Q4 2025)
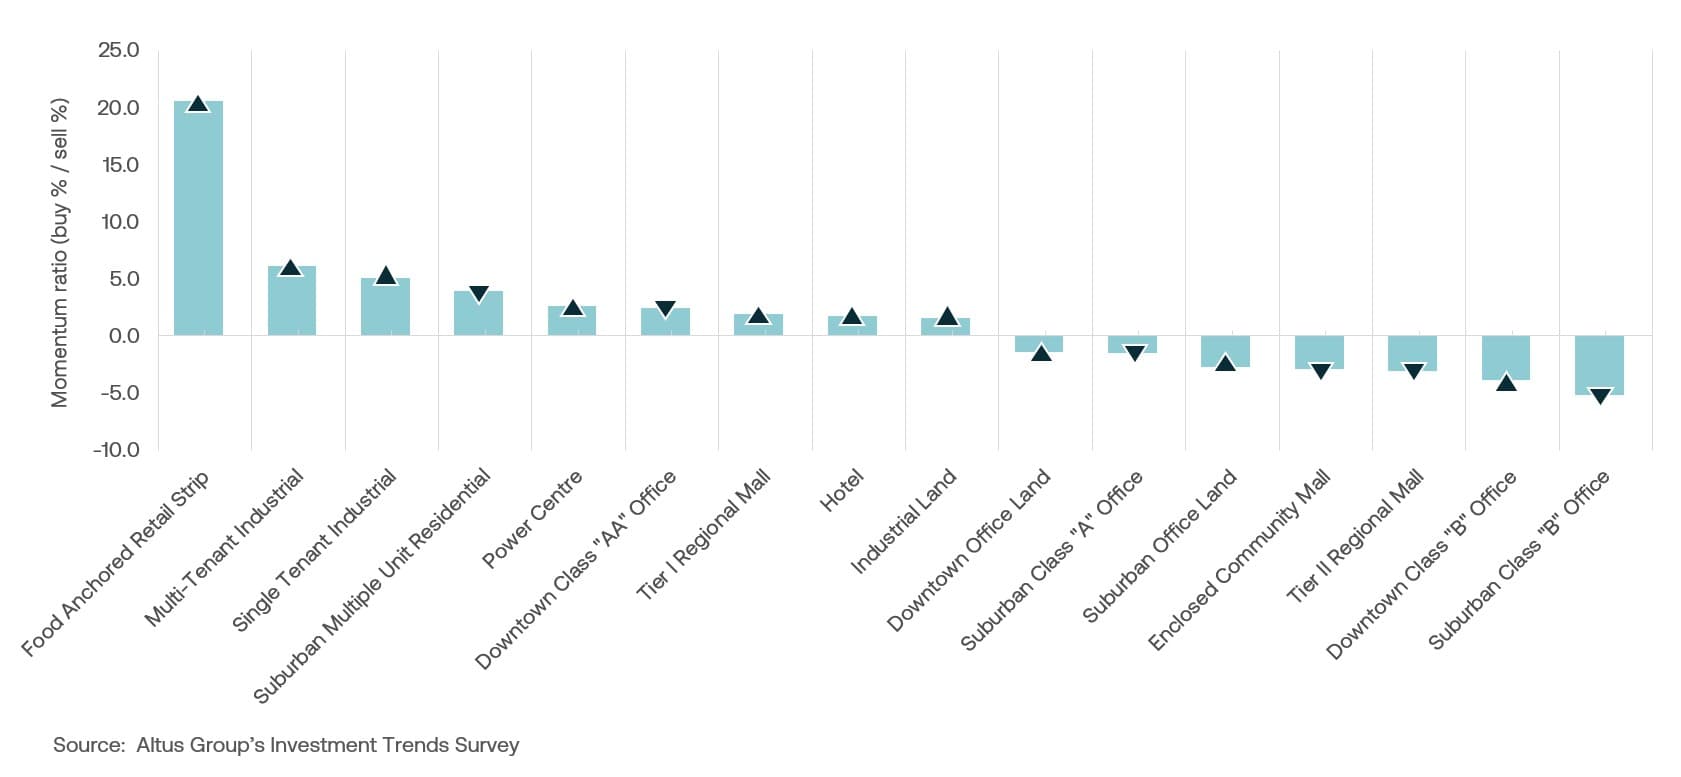
The industrial sector encountered significant headwinds stemming from escalating trade tensions and shifting global supply chain dynamics, which introduced notable volatility into the market. Despite these pressures, multi-tenant and single-tenant industrial assets ranked as the second and third most sought-after property types, respectively. In response to softening market conditions, investors adopted a more discerning approach, prioritizing premium, well-located logistical hubs that maintained robust valuations and credit-worthy occupants.
Suburban multi-unit residential assets ranked fourth in investor preference in the final quarter of 2025, a year characterized by a deepening crisis in affordable housing options. Despite broader economic volatility, the sector demonstrated remarkable resilience, with capital deployment recovering in the latter half of 2025. This persistent demand was fundamentally driven by the widening chasm between homeownership costs and household incomes, which effectively transitioned rental housing from a discretionary choice to a structural necessity for a notable segment of the population.
However, there were significant hurdles in the condominium apartment segment, where elevated inventory levels and stagnant sales led developers to postpone or cancel numerous projects. This lack of new, attainable supply further exacerbated the pressure on the existing rental stock, as the scarcity of viable housing alternatives provided a fundamental cushion for property valuations. While expectations for rapid capital appreciation moderated due to high borrowing costs, the “housing-as-infrastructure” narrative maintained investor confidence in the asset’s long-term stability. Ultimately, the market remained defined by a chronic supply-demand imbalance, with Montreal and Halifax emerging as the primary markets where the investor momentum ratio remained positive for this asset class.
Downtown class “A” office space ranked sixth in investor preference, reflecting a pronounced bifurcation within the sector. A definitive “flight-to-quality” trend persisted, as demand intensified for newer, high-quality, amenity-rich Class AAA spaces while older, secondary assets faced increasing obsolescence. This divergence was driven by corporate tenants seeking premium space to support return-to-office mandates and evolving technological requirements. The scarcity of such prime space was highlighted by Class AAA vacancy rates in Toronto, which fell below 2% by year-end, contrasting sharply with the broader office market’s challenges.
Product/market barometer highlights
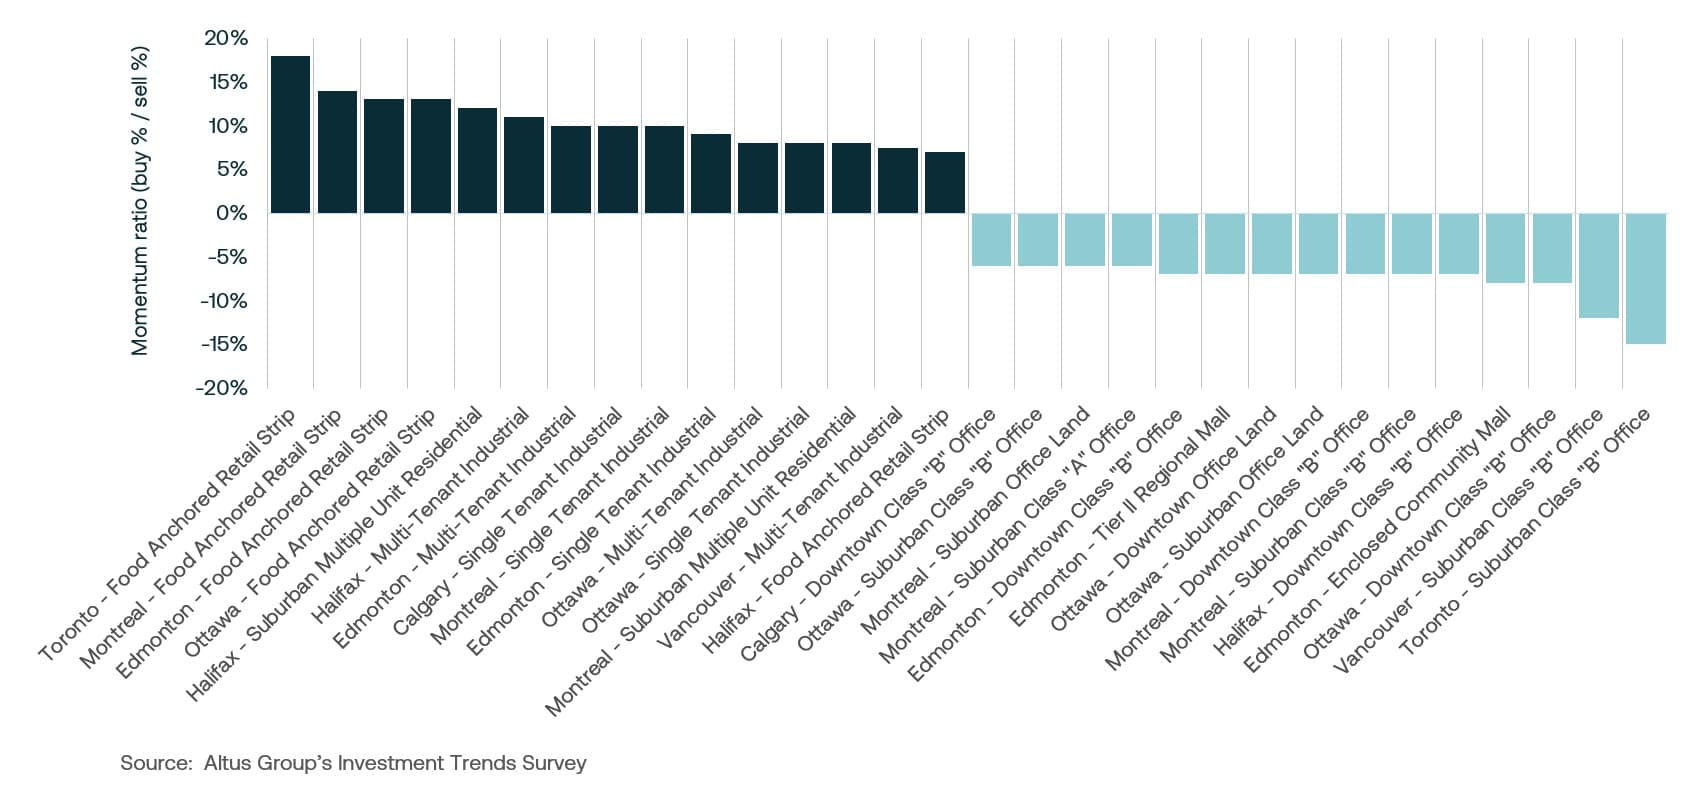
According to the product/market barometer (Figure 4), the top three preferred combinations were:
Food-anchored retail strip in Toronto
Food-anchored retail strip in Montreal
Food-anchored retail strip in Edmonton
Investor disinterest in Class B office and office land assets was evident, as these segments comprised the majority of the 15 least preferred product/market combinations. This trend reflected a clear “flight-to-quality: within the office market, contributing to a widening disparity in value and demand between premium Class A properties and older Class B stock.
Figure 4: Product/market barometer - All available products (Q4 2025) - Top 15 preferred/least preferred
Market highlights for the quarter include:
Cap rates for suburban multiple-unit residential increased to 4.66%. The suburban multiple-unit residential cap rate increased by 2 basis points quarter-over-quarter. Cap rates across all markets were primarily unchanged. Ottawa and Halifax reported increases, while Vancouver reported a decrease.
Cap rates for single-tenant industrial increased to 6.00%. The national industrial availability rate reached 6.3% in the fourth quarter of 2025, a 20 basis point increase year-over-year. Cap rates across all markets were primarily up. Ottawa and Halifax were unchanged, while Montreal reported a decrease.
Downtown Class AA office cap rates decreased to 6.59%. The national office availability rate decreased by 140 basis points to 16.0% year-over-year. Cap rates across all markets were primarily down. Toronto remained unchanged while Halifax reported an increase.
Tier I regional mall cap rates increased to 6.44%. The Tier I regional mall recorded a 9 basis point increase quarter-over-quarter. Cap rates across all markets were primarily up. Quebec City and Halifax reported decreases while Montreal remained unchanged.
Barometer highlights include:
Of the 128 combinations of products and markets covered in the ITS:
68 reported a “positive” momentum ratio, indicating a higher percentage of respondents intended to be buyers rather than sellers in those segments. This represented a decrease of 10 positive segments compared to Q3 2025.
56 reported a “negative” momentum ratio, with respondents leaning towards selling rather than buying, an increase of 6 such segments from Q3 2025.
The top 15 products/markets that showed the most positive momentum were:
Calgary – Single-tenant industrial
Toronto – Food-anchored retail strip
Ottawa – Food-anchored retail strip, multi-tenant and single-tenant industrial
Edmonton – Food-anchored retail strip, multi-tenant and single-tenant industrial
Halifax – Suburban multiple unit residential, multi-tenant industrial, and food-anchored retail strip
Vancouver – Multi-tenant industrial
Montreal – Food-anchored retail strip, single-tenant industrial, and suburban multiple-unit residential
Market outlook
The Canadian commercial real estate market transitioned into 2026 through a phase of strategic recalibration, following a year defined by a contraction in investment volume and a pronounced pricing standoff. While the BoC’s decision to maintain the overnight rate to close out 2025 provided a sense of stability and predictability, elevated long-term bond yields continued to squeeze the risk premiums typically expected from property investments. This environment forced a shift in investor sentiment towards a cautious stance, as capital was no longer deployed broadly, but was instead funneled into “safe-haven” assets with reliable, inflation-protected cash flows.
Heading into 2026, the market is expected to shift from a period of defensive posturing to disciplined growth as the bid-ask spread finally begins to narrow. Strategic focus is expected to remain bifurcated, with a preference for predictable market fundamentals directing capital to regions with diverse economic drivers. While macroeconomic headwinds will persist, notably uncertainty surrounding the 2026 CUSMA joint review and downward revisions to permanent resident targets, the stabilization of monetary policy should provide a more predictable landscape for portfolio rebalancing. Investors who navigate this period by prioritizing best-in-class management practices and creative deal structuring will be best positioned to capitalize on the gradual recovery of Canadian capital markets.
About our Canadian Investment Trends Survey (ITS):
Every quarter, senior Altus Group professionals reach out to over 300 investors, managers, owners, lenders, analysts, and other market stakeholders to survey their opinions on value trends and perspectives. Conducted with the same benchmark properties for over 20 years, the survey provides valuable insights into investor preferences and valuation parameters for 32 asset classes in Canada’s eight largest markets.
Want to be notified of our new and relevant CRE content, articles and events?
Disclaimer
This publication has been prepared for general guidance on matters of interest only and does not constitute professional advice or services of Altus Group, its affiliates and its related entities (collectively “Altus Group”). You should not act upon the information contained in this publication without obtaining specific professional advice.
A number of factors may influence the performance of the commercial real estate market, including regulatory conditions and economic factors such as interest rate fluctuations, inflation, changing investor sentiment, and shifts in tenant demand or occupancy trends. We strongly recommend that you consult with a qualified professional to assess how these and other market dynamics may impact your investment strategy, underwriting assumptions, asset valuations, and overall portfolio performance.
No representation or warranty (express or implied) is given as to the accuracy, completeness or reliability of the information contained in this publication, or the suitability of the information for a particular purpose. To the extent permitted by law, Altus Group does not accept or assume any liability, responsibility or duty of care for any consequences of you or anyone else acting, or refraining to act, in reliance on the information contained in this publication or for any decision based on it. The distribution of this publication to you does not create, extend or revive a client relationship between Altus Group and you or any other person or entity. This publication, or any part thereof, may not be reproduced or distributed in any form for any purpose without the express written consent of Altus Group.
Authors

Jennifer Nhieu
Senior Research Analyst

Ray Wong
Vice President, Research at Newmark
Authors
Jennifer Nhieu
Senior Research Analyst
Ray Wong
Vice President, Research at Newmark
Resources
Latest insights