Australian construction price outlook - Q2 2026
Australia’s construction pipeline appears strong on paper, but feasibility may affect how much will translate into material demand.
Australian construction price outlook - Q2 2026
Australia’s construction pipeline appears strong on paper, but feasibility may affect how much will translate into material demand.
Authors

Niall McSweeney
Head of Development Advisory, Asia-Pacific

Cody Bui
Quantity Surveyor
Key highlights
The pipeline appears stronger on paper than on site; approvals and commencements are rising, but completions are lagging as feasibility may increasingly affect which residential projects proceed
Escalation is easing, but remains elevated; altus has lowered its 2026 and 2027 forecasts across major cities, although cost growth remains well above pre-2021 levels
Material prices are moving to their own beat; fuel costs can switch surcharges on and off rapidly, steel duties are adding structural pressure, and global demand continues to be a factor affecting copper prices
Overview
Australia may not have the housing pipeline its approvals suggest
Approvals and commencements are rising, but completions are not keeping pace. The latest trend data from the Australian Bureau of Statistics shows 51,009 dwellings commenced in the March quarter, up 11.7% over the year, while 44,328 were completed, up just 2.4%. Australia needs 60,000 completions every quarter to deliver 1.2 million homes over five years.
The official forecast is slipping accordingly. The National Housing Supply and Affordability Council originally expected the 1.2 million homes to be delivered by June 2029. In April, it pushed that date to September 2030. It now expects the target will not be reached until the end of 2030.
An approval is permission to build. It is not proof that a project can be financed, sold or delivered.
This distinction matters for material prices, as feasibility is increasingly the sticking point on whether a development moves from approval to actual construction.
Three interest rate rises in 2026 have taken the cash rate to 4.35%, housing tax settings have tightened and residential values are falling. Since the quarter’s end, Cotality’s national Home Value Index fell 0.7% in July, its largest monthly decline since December 2022.
Developers are facing pressure between the cost of delivering a project and the value they can realise at the other end. If fewer approved projects proceed, demand for labour and materials may soften. This is why we expect construction cost escalation to moderate across most Australian markets.
But there is a counterweight. While the broader economy is disinflating, construction is not. The Consumer Price Index (CPI) headline figure eased to 3.8% in the year to June, while building construction output prices rose 4.9% and house construction prices 5.9%.
Some material costs are being pushed by forces largely independent of Australian construction demand. Fuel surcharges are being switched on and off with disruption in the Strait of Hormuz. New anti-dumping duties on Chinese steel have raised the underlying cost base. And demand for copper from data centres, electrification and renewable energy projects continues to support higher prices.
Softer construction activity may take some heat out of escalation, but not all.
For cost planning, watch completions as closely as approvals. Australia has plenty of projects on paper. But paper projects don’t consume concrete, steel or copper.
Outlook on construction cost escalation
| Figure 1 - Altus Group’s outlook on construction cost escalation
Sydney | Brisbane | Melbourne | Perth | |
|---|---|---|---|---|
2019 | 4.0% | 3.0% | 3.5% | 2.5% |
2020 | 3.5% | 2.5% | 3.75% | 3.75% |
2021 | 4.5% | 3.25% | 4.0% | 7.25% |
2022 | 7.5% | 8.5% | 7.5% | 7.5% |
2023 | 5.9% | 9.25% | 6.25% | 6.75% |
2024 | 5.50% | 7.50% | 4.75% | 5.50% |
2025 | 4.50% | 7.00% | 4.50% | 5.75% |
2026 (previous forecast) | 6.00% (6.50%) | 9.00% (9.50%) | 5.50% (6.00%) | 7.00% (7.50%) |
2027 (previous forecast) | 4.50% (4.75%) | 8.00% (8.25%) | 4.00% (4.25%) | 5.25% (5.50%) |
Note: These figures are general, and individual projects and asset classes may have dramatically different spreads of costs. Previous forecasts were made in April 2026.
Source: Altus Group, August 2026.
We have adjusted our forecast this quarter to reflect a diverging outlook across the major cities.
Brisbane is expected to remain the nation’s escalation hotspot through 2027, fuelled by Olympic-related works, persistent labour shortages, and supply chain pressures. Sydney and Melbourne show a cooler trajectory reflecting weaker construction pipelines and fewer major project starts. Perth is also easing after its recent resource-driven spikes.
Although the pace of increases is slowing in most cities, escalation rates are forecast to remain above pre-2021 levels through 2027, given ongoing material, labour and regulatory cost pressures.
Escalation rates are highly variable, depending on project type, size, location and materials. Given these complexities, it is essential to consult professional quantity surveyors to evaluate project-specific costs and escalation factors.
Material price snapshot
Figure 2 - A snapshot of Australian construction material price trends - Q2 2026
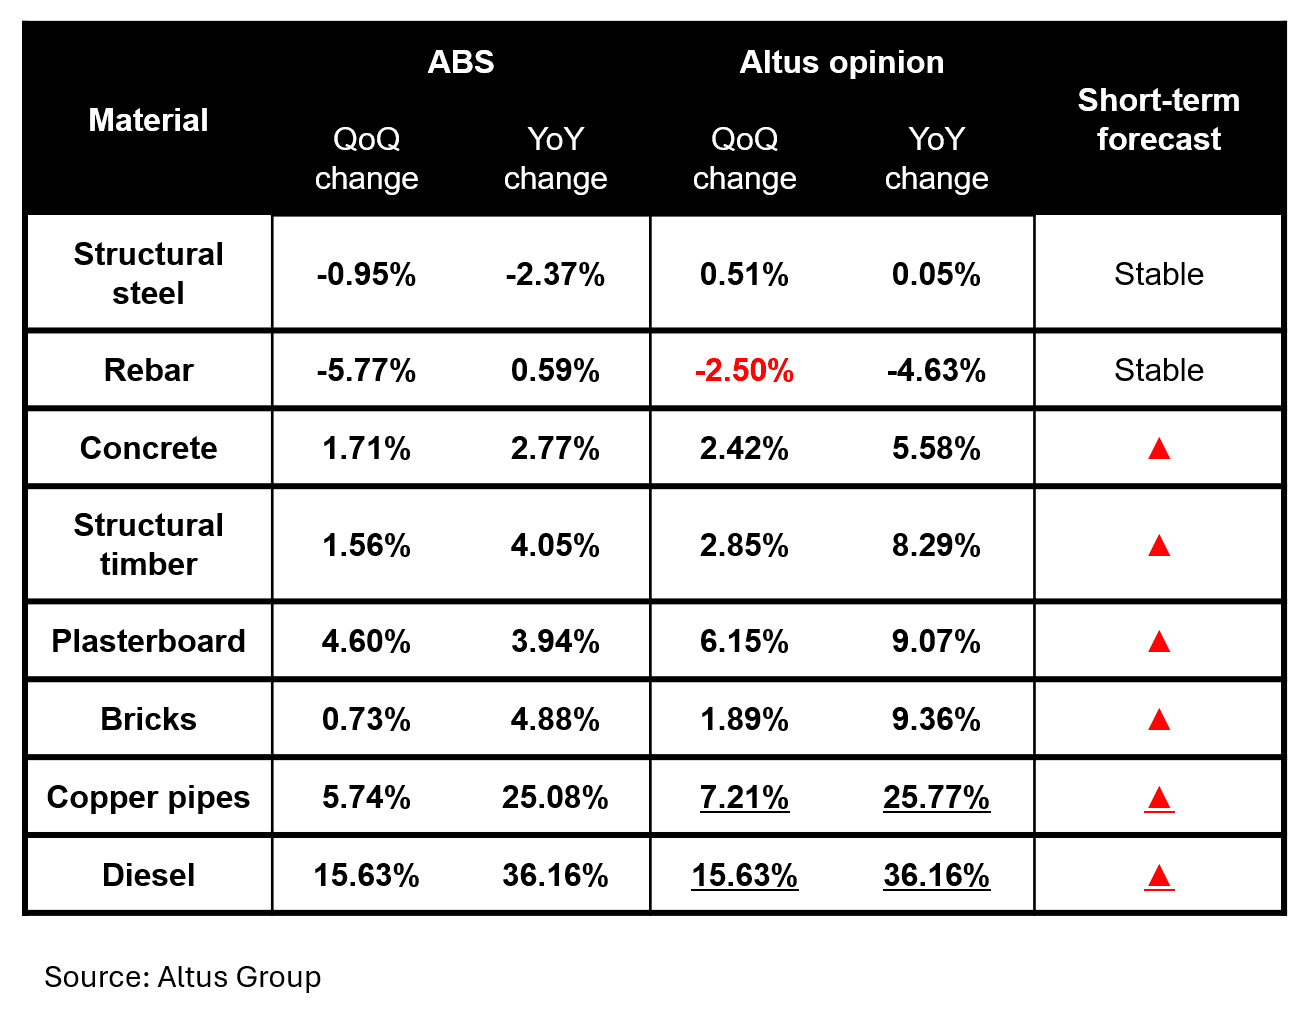
*ABS: ABS figures reflect supply-only prices (PPI). Altus opinion reflects current market pricing, incorporating labour rates where applicable.
| Figure 3 - Altus Materials Escalation Index (Australia)
Altus Materials Escalation Index (Australia)
Download
Source: Altus Group, August 2026
Material price movements
Structural steel and rebar: Prices remained relatively soft this quarter, but that is likely to change. Between April and May, Australia’s Anti-Dumping Commission introduced or increased duties on four Chinese steel product categories: hot rolled coil, rebar, corner beads and angles, and ceiling frames. These duties are substantial; hot-rolled coil tariffs now run as high as 82%. The impact has not yet flowed fully through prices as fabricators work through stock imported before the duties took effect. We expect the impact to become more visible in tenders from Q3. Unlike volatile energy costs, these duties represent a structural addition to the steel cost base.
Concrete: Altus figures show concrete rose 2.42% in the quarter, taking the year-to-date figure to 5.58%. Fuel surcharges introduced by Boral, Heidelberg Materials, and Holcim from mid-April were removed in late June as fuel prices fell, but underlying cost pressures remain. Heavy civil engineering demand has kept batching plants running near capacity, even as housing starts remain soft. Imported cement is up by around 15%, local grinding costs by around 10%, and trucking 12-15%. The key is to treat fuel surcharges as a separate, volatile line item with its own review mechanism rather than folding it into a base rate.
Structural timber: Structural timber rose 2.85% in the quarter and 8.29% year-to-date, according to Altus figures. Strong import volumes are helping to contain price pressure, with annual plywood imports exceeding 500,000 sq m for the first time in January 2026, up 21.8% year-on-year. China supplies 43.8% of Australia’s roughly $3 billion wood products import bill. The supply chain has also been reshaped by the withdrawal of plywood previously sourced from Russian-owned or backed suppliers, increasing reliance on alternative import markets. But this reliance on imports leaves prices exposed to freight, insurance, and global supply costs. With housing starts still soft, we don’t see a supply-driven spike, but the freight component is worth watching into Q3.
Plasterboard: Plasterboard costs rose by 6.15% in the quarter and 9.07% year-to-date. As a later-stage material, the increase may reflect higher manufacturing and transport costs linked to the Middle East conflict, as well as a healthy pipeline of projects reaching fitout stage. We expect the upward trend to continue into Q3. Looking further ahead, European building materials giant Etex has announced a A$44 million investment across four Australian plasterboard plants to increase production capacity, with upgrades expected to come online progressively from Q2 2027.
Bricks: Brick price growth eased this quarter, rising just 0.73% on ABS figures, but Altus supplier data tells a different story, with prices up 9.36% year-to-date. The gap may indicate that cost pressure is still working its way through the market. Energy remains the key exposure: brick manufacturing is gas-intensive, leaving producers sensitive to gas prices as well as higher transport costs. We expect brick prices to continue firming through the remainder of 2026.
Copper: Copper is the largest mover of any material we track, rising 7.21% in the quarter and 25.77% year-to-date. Copper prices reached an all-time high of US$14,500/t in January and remain elevated. The pressure is structural, with demand from data centres, electrification, and grid investment running up against constrained global supply. The impact is already flowing into construction: ABS figures show electrical equipment prices rose 7.4% this quarter, with electric cable and conduit up 11.2%. We expect electrical trades to remain under pricing pressure even if the geopolitical tensions ease.
Diesel: Costs rose 15.63% in the quarter and 36.16% year-to-date, reflecting sharp swings in global oil prices. Australia imports around 90% of its refined oil needs, leaving it exposed to global supply disruption. While prices eased from their March peak, the outlook remains volatile. A further cost pressure arrived in early August when the federal government ended the temporary fuel excise relief, adding 16 cents per litre to wholesale prices. This will flow through in the next quarter.
Macro-economic review
Consumer Price Index
| Figure 4 – All groups CPI, Australia, quarterly and annual movement (%)
All Groups CPI Australia
Quarterly and annual movement (%)
Download
Source: Australian Bureau of Statistics, Consumer Price Index, Australia June 2026
Annual inflation eased in the June quarter, falling to 3.8% from 4.6% in March. Underlying inflation, measured by the trimmed mean, was 3.6% in June. Housing was the largest contributor to annual inflation, with prices up 6.8% over the year.
Producer Price Indices – Input
| Figure 5 – Producer Price Indices (PPI) – Input to house construction prices, quarterly and annual percentage change and index, Australia
Producer Prices Indexes (PPI) - Input, Australia
Download
Source: Australian Bureau of Statistics, Producer Price Indexes, Australia June 2026
Input prices for house construction rose 2.1% in the June quarter and 3.8% over the year, with the quarterly increase the largest since 2022. The rise was led by materials exposed to higher metal, energy, and transport costs, including electrical equipment (+7.4%), plaster products (+4.6%) and aluminium windows and doors (+3.2%). Electric cable and conduit recorded the largest increase, up 11.2%, as higher copper and PVC costs flowed through.
Producer Price Indices – Output
| Figure 6 – Producer Price Indices (PPI) - Output of building construction prices, quarterly and annual percentage change and index, Australia
Producer Prices Indexes (PPI) - Output, Australia
Download
Source: Australian Bureau of Statistics, Producer Price Indexes, Australia June 2026
Building construction output prices rose 4.9% over the year, with cost pressure strengthening in the June quarter. House construction recorded the largest quarterly increase at 2.0%, compared with 1.0% for non-residential construction and 0.8% for other residential buildings. Higher fuel costs contributed to the increase, with builders passing on surcharges and additional fees, while competition for labour, concrete, and copper remained strong.
Wage Price Index
| Figure 7 – Wage Price Index (WPI), quarterly and annual movement (%), sesonally adjusted (a), Australia
Wage Price Index (WPI), Australia
Download
Source: Australian Bureau of Statistics, Wage Price Index, Australia March 2026
*a. See interpretation of index numbers, percentage change and rounding in the methodology section
Wages rose 0.8% nationally in the June quarter and 3.2% over the year. Construction wage growth was broadly in line with the wider economy, at 0.8% for the quarter and 3.3% annually. Construction was the third-largest industry contributor to quarterly wage growth.
Building approvals
| Figure 8 – Building approvals, Australia
Building Activity
Source: Australian Bureau of Statistics | Altus Group
Building approvals and commencements have been trending upwards, but completions have not kept pace.
Building approvals continue to rise. In June, 18,328 dwellings were approved, up 7.2% from May and 8.9% from June 2025.
Commencements are also increasing. The latest available building activity data, for the March quarter, shows 51,009 dwellings commenced, up 11.7% over the year. Non-residential building work rose by 11.4% year-on-year.
Residential completions, however, are not keeping pace: 44,328 dwellings were completed, up just 2.4%. The longer-term trend shows the gap clearly. Before 2020, completions generally followed approvals and commencements after a lag. Since then, the relationship has weakened, with a widening gap between dwellings entering the pipeline and those being completed.
Australia’s target of 1.2 million new homes over five years requires an average of 60,000 completions per quarter. March-quarter completions were around 26% below that pace.
Summary
Australia’s construction pipeline looks strong on paper, but feasibility is clouding how much will translate into material demand.
Residential construction accounts for around one-third of all construction activity nationally, so what happens to the housing pipeline matters for material demand.
Approvals and commencements are rising, but completions are not keeping pace. Higher finance and construction costs, changing tax settings, and weaker end values are increasingly determining which projects move from approval to construction, and what gets built. Social, affordable, and first-home-buyer housing is particularly difficult to stack up.
Housing is also competing with other types of development for scarce land, power, and workforce capability. Australia had 90 data centres in the development pipeline at the end of March 2026, including 47 exceeding 100 MW. Not all will proceed, but those that do will compete with housing and other sectors for finite development capacity.
The quarter also showed that material prices can move faster than underlying construction cycles. The rapid introduction and withdrawal of fuel surcharges during the June quarter showed how quickly global energy costs can flow through to Australian construction. Suppliers now effectively have an on/off switch for passing through fuel costs.
Other pressures are less reversible. New anti-dumping duties on Chinese steel represent a structural addition to the cost base, while copper prices remain elevated on strong global demand for data centres, electrification and renewable energy projects.
The implications for cost planning are clear. Domestic construction cycles move slowly; global commodity, energy and trade shocks can reprice materials quickly. Feasibility needs to account not just for where material prices are today, but how quickly they can move.
Methodology
Market research into the supply cost of core materials is conducted on a quarterly basis with manufacturers and suppliers. Our market assessment also involves a thorough analysis of secondary sources of market data on materials and labour prices.
These sources include the Australian Bureau of Statistics (ABS), the Australian Institute of Quantity Surveyors (AIQS), Fuel Price Index, Metal and Raw Material Price, and proprietary cost data from Altus Group.
Disclaimer
This publication has been prepared for general guidance on matters of interest only and does not constitute professional advice or services of Altus Group, its affiliates and its related entities (collectively “Altus Group”). You should not act upon the information contained in this publication without obtaining specific professional advice.
No representation or warranty (express or implied) is given as to the accuracy, completeness or reliability of the information contained in this publication, or the suitability of the information for a particular purpose. To the extent permitted by law, Altus Group does not accept or assume any liability, responsibility or duty of care for any consequences of you or anyone else acting, or refraining to act, in reliance on the information contained in this publication or for any decision based on it.
The distribution of this publication to you does not create, extend or revive a client relationship between Altus Group and you or any other person or entity. This publication, or any part thereof, may not be reproduced or distributed in any form for any purpose without the express written consent of Altus Group.

Make informed decisions on your projects
Expert construction cost advice to effectively manage your large residential, commercial and infrastructure development projects throughout Australia.
Want to be notified of our new and relevant CRE content, articles and events?
Authors
Niall McSweeney
Head of Development Advisory, Asia-Pacific
Cody Bui
Quantity Surveyor
Resources
Latest insights