Under the hood of niche valuations: The income side of the story
New data reveals evolving underwriting assumptions behind niche property valuations, with rent gaps, expense ratios, and NOI growth all in motion.

Key highlights:
Niche property contract rents sit 10% below market as of Q4 2025, representing the widest under-rent gap of any group, though the gap has narrowed by roughly three percentage points since its Q3 2024 peak
Niche operating expense ratios have risen from 26.6% in 2018 to 32.5% in Q4 2025, closing the cost advantage niche once held over traditional and mainstream sectors
Implied near-term NOI growth for niche properties has fallen to 4.9% by Q4 2025, slipping below traditional for the first time after running above it for most of the preceding period
Niche valuations lean most heavily on terminal value, with 63.7% of concluded value attributed to reversion, and niche remains the only group still embedding cap rate compression at exit
Taken together, three of the four underwriting assumption series have moved over the last five quarters in directions that reduce the cushion supporting niche's aggressive pricing stance
A companion to our PERE Trend Watch article on the narrowing ‘alternative’ premium in niche property sectors
In a recent PERE Trend Watch article (“The narrowing ‘alternative’ premium in niche property sectors”), we explored the pricing signals coming out of the niche property sector:
The 87 basis point (bps) inversion of cap rates below traditional
The compression of appraiser discount rate dispersion
The 45 bps of tightening still embedded in niche exit assumptions
The persistence of negative leverage even as traditional and mainstream crossed into positive territory.
Those signals describe how niche is being priced relative to the rest of the market. They don’t, on their own, speak to what sits beneath those prices. Altus Group’s asset-level valuation data offers a complementary view into the assumptions that build up the valuations. Four of these assumption data series are worth looking at together. None is conclusive on its own, and there are multiple ways to interpret any combination of them; that said, the recent direction on several of these assumptions has turned and is worth noting.
Sector classifications used in this analysis
Traditional | Mainstream | Niche |
Industrial (including: flex, manufacturing, warehouse) | Hotel (full service, limited service) | Data center |
Office (including: CBD, suburban) | Life science & medical office | Parking |
Residential (apartment) | Self-storage | SFR & manufactured housing |
Retail (mall, street, strip) | Senior's housing & student housing | Other / specialized |
Series 1 - Contract-to-market rent: Wide but narrowing
Contract-to-market rent ratio measures how a property’s in-place rents compare to current market rents. A more negative number means greater upside from rent resets. As of Q4 2025, niche contract rents sit 10.0% below market, the widest gap of the three groups, and nearly 10 points below mainstream, which sits at -0.8%.
Chart 1: Contract-to-market rent ratio by group (%), Q1 2018 – Q4 2025
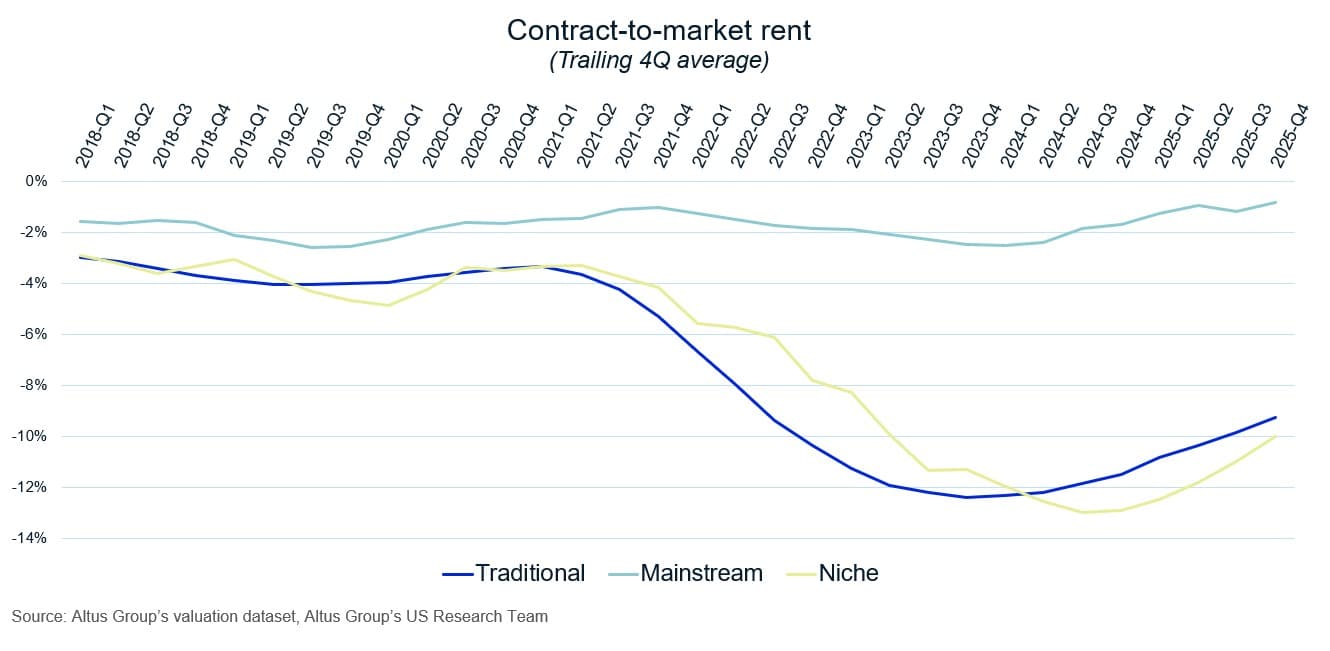
While the mark-to-market rent opportunity for niche remains wide, the trajectory shows narrowing. Niche’s under-rent gap widened steadily through the rate cycle, peaking at -13.0% in Q3 2024. It has since closed by roughly three percentage points. Whether that narrowing reflects rent resets working through leases, softening market rents, or some combination of the two is something this data can’t answer alone, but is worth exploring more. Traditional shows a similar pattern over the same period. Mainstream has moved far less.
Series 2 - Operating expense ratio: Niche rises, mainstream drifts, and traditional remains stable
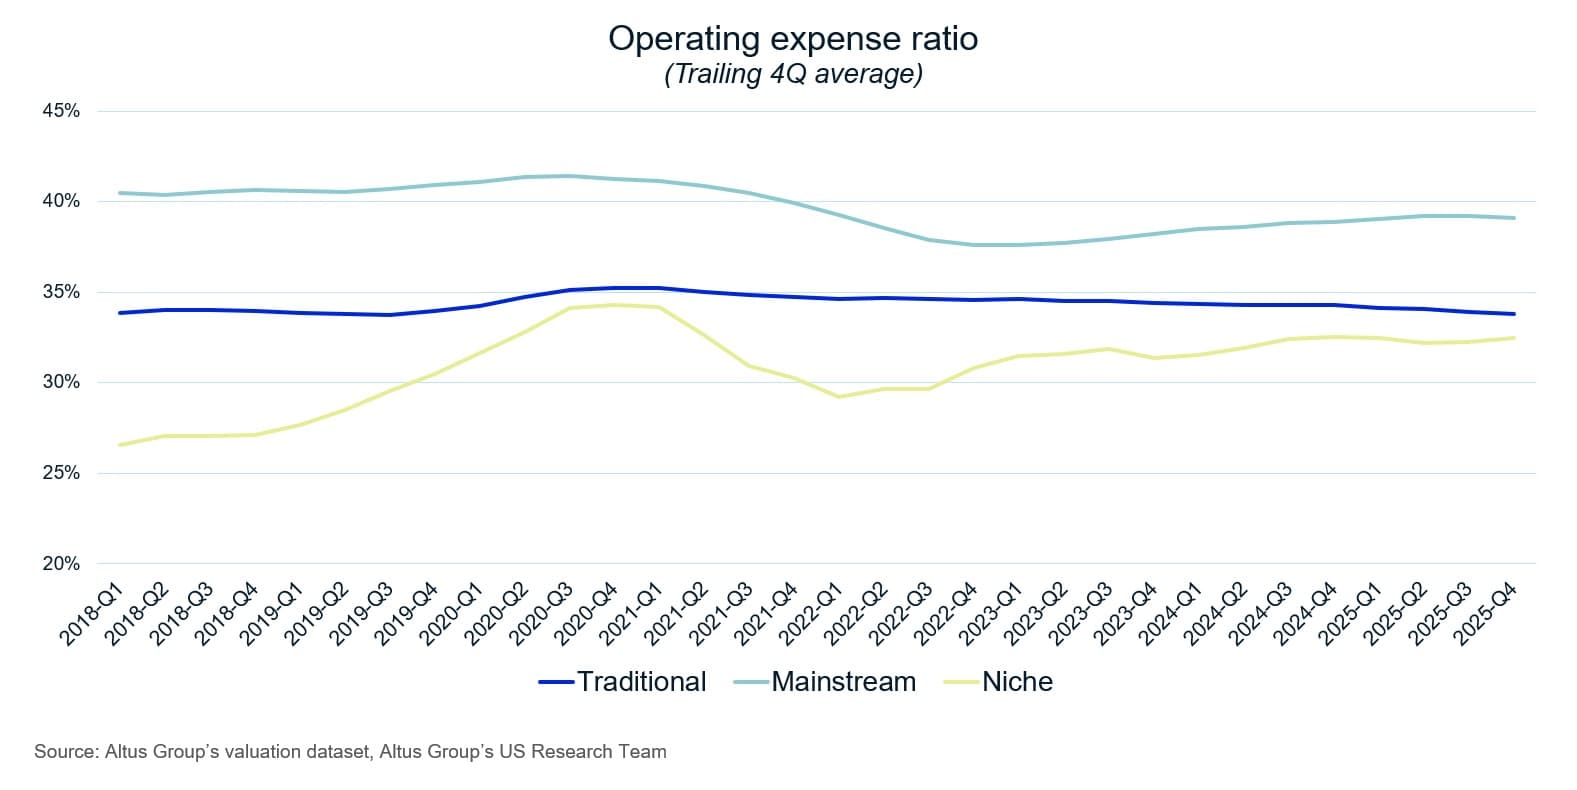
Operating expense ratio (OER), calculated as total operating expenses divided by effective gross income, has moved differently across the three groups since 2018. Niche OER was 26.6% in Q1 2018, below both traditional (33.8%) and mainstream (40.5%). By Q4 2025, niche OER has risen to 32.5%. Traditional has been essentially flat over the full period, and mainstream has drifted slightly lower.
Niche is still the lowest-cost group in absolute terms. The shape of the change depends heavily on the sub-sector mix inside the niche property sector. Data centers, for example, carry meaningful power and operating costs that have risen in recent years, and a shift in the composition of transactions or appraisals within the niche bucket can move a group-level average even if individual sub-sectors are stable.
Chart 2: Operating expense ratio by group (%), Q1 2018 – Q4 2025
Series 3 - NOI growth: A recent crossover, still within a narrow band
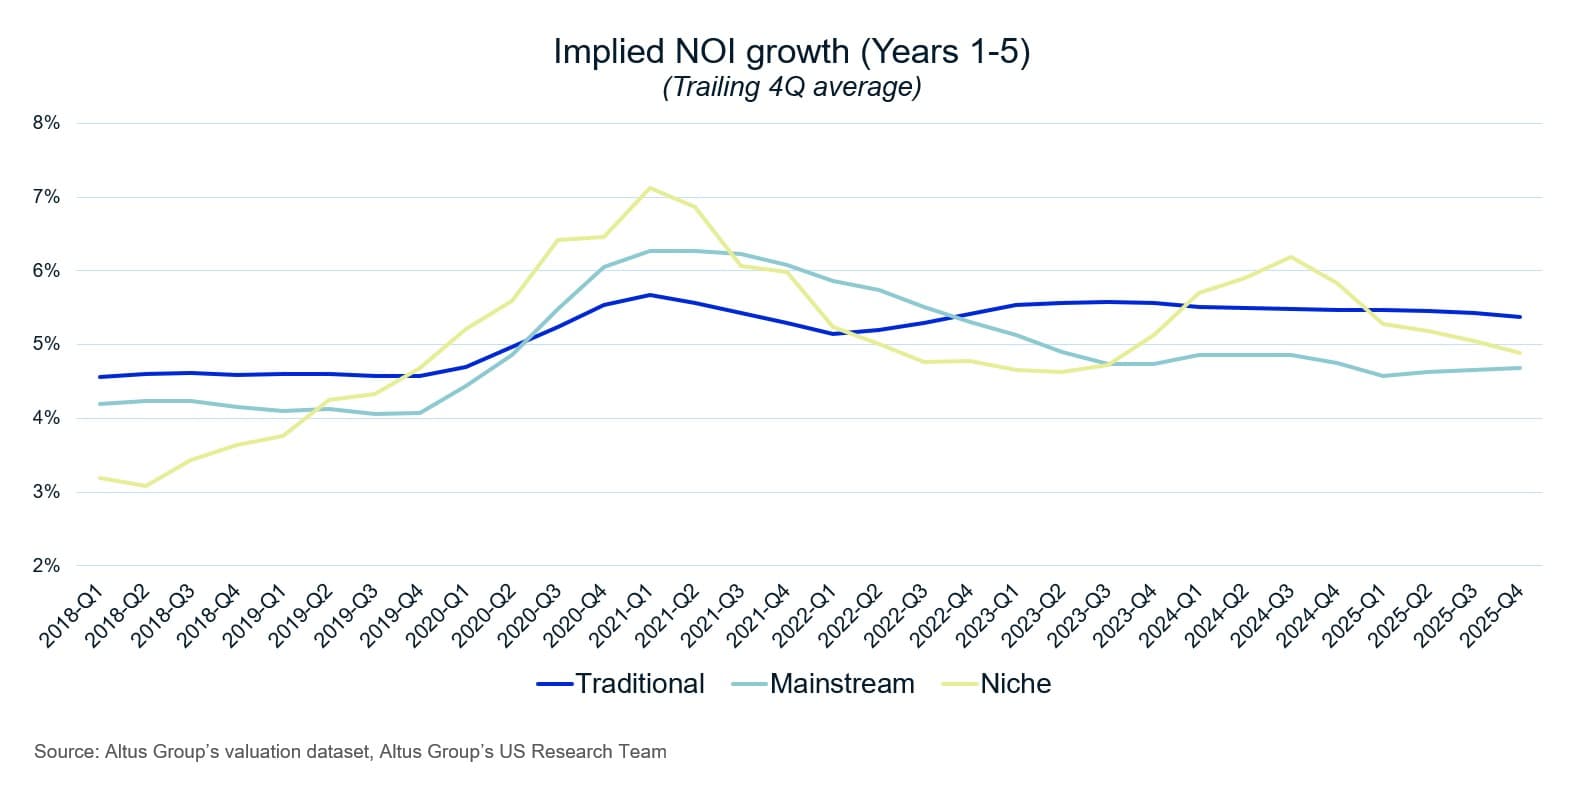
The compound annual NOI growth rates embedded in DCF valuations (years 1 to 5) reached their highest levels in Q1 2021 across all three groups, with niche peaking at 7.1%. Through most of the subsequent period, niche ran above traditional, reaching 6.2% in Q3 2024 versus 5.5% for traditional.
Over the last five quarters the two have converged and crossed. Niche fell to 4.9% by Q4 2025, while traditional moved only modestly, from 5.5% to 5.4%. The absolute gap today is small, roughly 50 bps, and the series have crossed each other more than once over the eight-year history. Again, what this represents is a question the data alone doesn’t settle: a mean-reversion after a period of elevated niche growth assumptions, a more fundamental revision of the growth thesis, or some combination of these? The direction over the last year, however, is hard to dispute.
Chart 3: Implied NOI growth, Year 1–5 CAGR (%), Q1 2018 – Q4 2025
Series 4 - Niche valuations lean hardest on the reversion
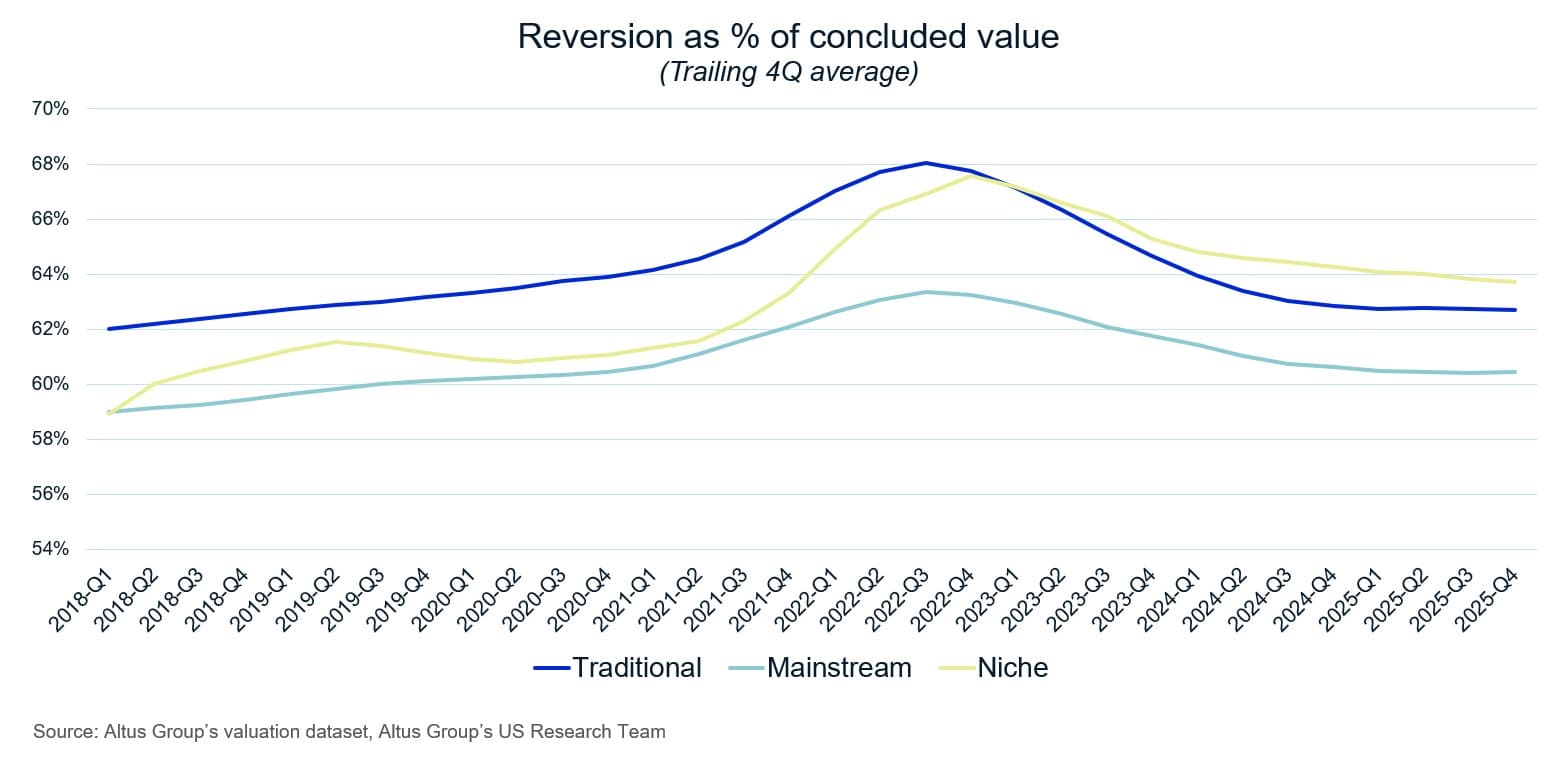
Every DCF valuation breaks down into two components: the present value of cash flows during the hold period, and the present value of the terminal (reversion) value at exit. The split is a useful lens on which assumptions drive the valuation, though any interpretation needs to account for the fact that hold periods, growth profiles, and discount rates all feed into the ratio in ways that legitimately differ by sector.
By Q4 2025, the average reversion accounts for 63.7% of concluded value for niche, 62.7% for traditional, and 60.4% for mainstream. The gap across these groupings is modest. Niche has sat at or near the top of the three groups for most of the period, which is consistent with the longer-duration growth profiles typically assumed for some niche sub-sectors. It is worth noting in combination with the PERE article’s observation, that niche is the only group still embedding cap rate compression at exit, since both features place relatively more weight on what happens at the end of the hold. That is an observation about DCF structure rather than a judgment about whether the underlying assumptions are reasonable, though.
Chart 4: Share of concluded value attributed to reversion (%), Q4 2025
Reading the four together
Each of these four data series moves in its own way, and each admits several reasonable interpretations:
Contract-to-market gaps close through lease rolls or market rent softening, and the series can’t distinguish which
Operating expense ratios are sensitive to sub-sector composition
NOI growth assumptions move with the macro environment and with appraisers’ specific sector views, and they have crossed each other more than once over the observed period
Reversion shares reflect hold-period assumptions that vary legitimately across property types.
At the same time, the PERE article highlighted that niche currently carries the tightest cap rates, the only remaining compression assumption at exit, and persistent negative leverage. Three of the four series we’ve looked at here have moved in directions over the last five quarters that reduce, at least at the margin, some of the cushion an aggressive pricing stance might otherwise draw on: the rent-reset gap has narrowed, the operating expense gap has narrowed, and implied near-term NOI growth has slipped below traditional.
Whether any of this translates into repricing, and on what timeline, will depend on how the assumptions and the transaction environment develop from here. The point of this piece is narrower: the pricing story in the PERE article is one view of the sector, and the underwriting assumptions that sit behind those prices tell a story of their own. Both are worth watching, and the interaction between them is where the most interesting questions for investors, appraisers, and lenders will likely emerge over the next several quarters.
For more information, the full analysis and sector definitions, read the original Trend Watch article in PERE: “The narrowing ‘alternative’ premium in niche property sectors” (April 2026)
Want to be notified of our new and relevant CRE content, articles and events?
Disclaimer
This publication has been prepared for general guidance on matters of interest only and does not constitute professional advice or services of Altus Group, its affiliates and its related entities (collectively “Altus Group”). You should not act upon the information contained in this publication without obtaining specific professional advice.
A number of factors may influence the performance of the commercial real estate market, including regulatory conditions and economic factors such as interest rate fluctuations, inflation, changing investor sentiment, and shifts in tenant demand or occupancy trends. We strongly recommend that you consult with a qualified professional to assess how these and other market dynamics may impact your investment strategy, underwriting assumptions, asset valuations, and overall portfolio performance.
No representation or warranty (express or implied) is given as to the accuracy, completeness or reliability of the information contained in this publication, or the suitability of the information for a particular purpose. To the extent permitted by law, Altus Group does not accept or assume any liability, responsibility or duty of care for any consequences of you or anyone else acting, or refraining to act, in reliance on the information contained in this publication or for any decision based on it. The distribution of this publication to you does not create, extend or revive a client relationship between Altus Group and you or any other person or entity. This publication, or any part thereof, may not be reproduced or distributed in any form for any purpose without the express written consent of Altus Group.
Author

Omar Eltorai
Senior Director of Research, Altus Group
Author
Omar Eltorai
Senior Director of Research, Altus Group
Resources
Latest insights