Canadian office market update – Q3 2024
For the latest Canadian office market update, click here.

Key highlights
The bifurcation in the market continues to widen as Class-A office space saw increased demand and rent boosts, while Class-B and Class-C offices continue to see lower demand and vacancy problems
Quebec City reported the lowest office availability rate at 12.3%, while Calgary, despite efforts to reduce unused space, reported the highest at 22.6%
Nationally led by projects in Toronto and Vancouver, 36 office builds were under construction in Q3 2024, totalling 5.8 million square feet, with 38% of the space available
The increased popularity of hybrid work models has left businesses to grapple with the decision of whether to downsize their current footprint, renegotiate leases, or move to new space altogether
Overall office performance continues to lag with record-high office availability in Q3 2024
In the third quarter of 2024, the national office availability rate increased by 50 basis points to a record high of 18.2%, while sublet space continued to decrease.
The office market continued to be challenged by shifting workplace preferences (i.e., hybrid work model and return-to-office mandates) and ongoing rightsizing efforts. While the aggregate leasing activity in the office sector has slowed, demand for newer, select Class-A office space continued to see increased demand and higher net effective rents as bifurcation in the office market persisted. Meanwhile, older Class-B and -C buildings, especially in urban areas have experienced diminishing demand, contributing to rising vacancy rates. As such, landlords will need to invest in their outdated buildings to remain competitive in the space.
According to Statistics Canada’s Labour Force Survey (LFS), as of August 2024, employment remained virtually unchanged (+22,000, +0.1%), and the unemployment rate increased by 0.2 percentage points to 6.6% as population growth continued to outpace employment growth and as more people experienced difficulties finding employment in the current labour market. Gains in employment were noted primarily in educational services, healthcare and social assistance, finance, insurance, real estate, and rental and leasing. Meanwhile, losses in employment were noted in “other services”, professional, scientific and technical services, utilities, and natural resources.
The job market in the summer of 2024 was especially difficult for those seeking employment. In August, 1.5 million people were unemployed, a nearly 23% increase year-over-year. Moreover, of those unemployed in July, only 16.7% found employment in August, a 6.5 percentage point decrease compared to the share observed in the same period last year. The number of job vacancies has also continued to trend downward, an indication of weakened labour market conditions.
Figure 1 - Office availability rates
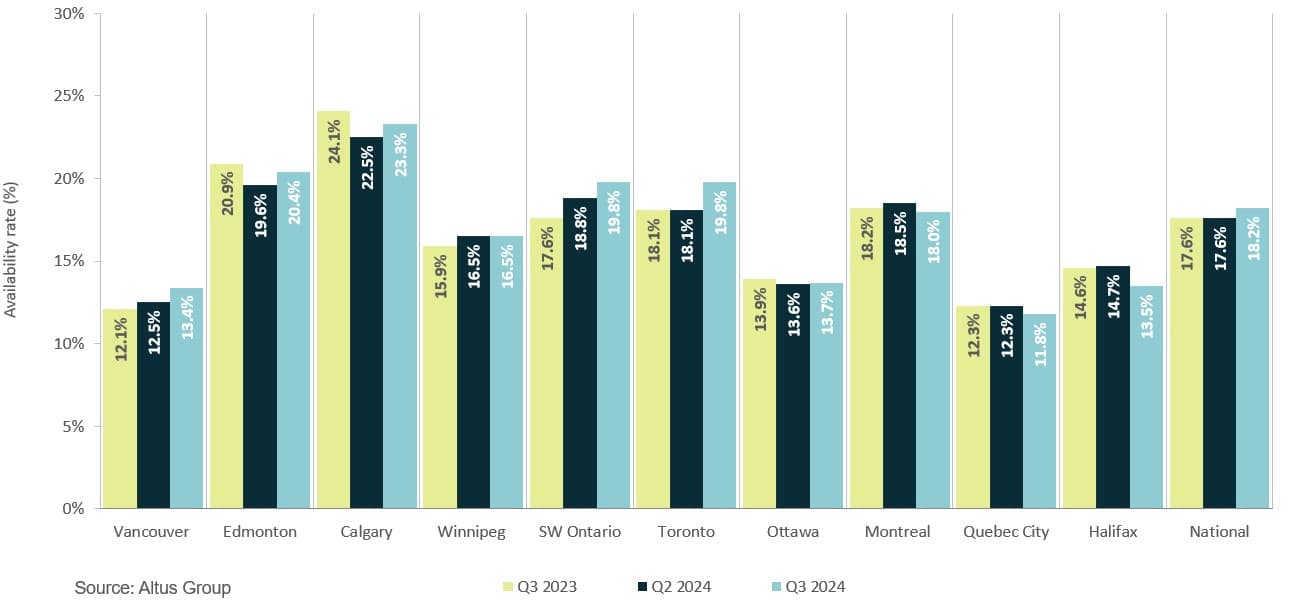
Across the major markets, Quebec City reported the lowest office availability rate at 12.3%, followed by Vancouver and Ottawa, respectively (Figure 1). Meanwhile, Calgary recorded the highest office availability rate at 22.6%, but it is important to note, Calgary also reported the highest year-over-year decline of 230 basis points (bps), since its peak in Q3 2021 when a 300 bps drop from 26.3% was observed.

Leverage our real estate data and predictive analytics
The performance attribution, predictive analytics and market intelligence you need to explain performance and improve decision making.
The Downtown Calgary Development Incentive Program has assisted in gradually removing underutilized and vacant office space from the market’s inventory, either through adaptive reuse or demolition, and thus far contributed to the city’s housing supply and hotel space. Edmonton, Kitchener-Waterloo, London, and Toronto, to name a few, have reported a few conversions slated for completion in the near future.
Figure 2 - Office completions and availability (Q3 2024)
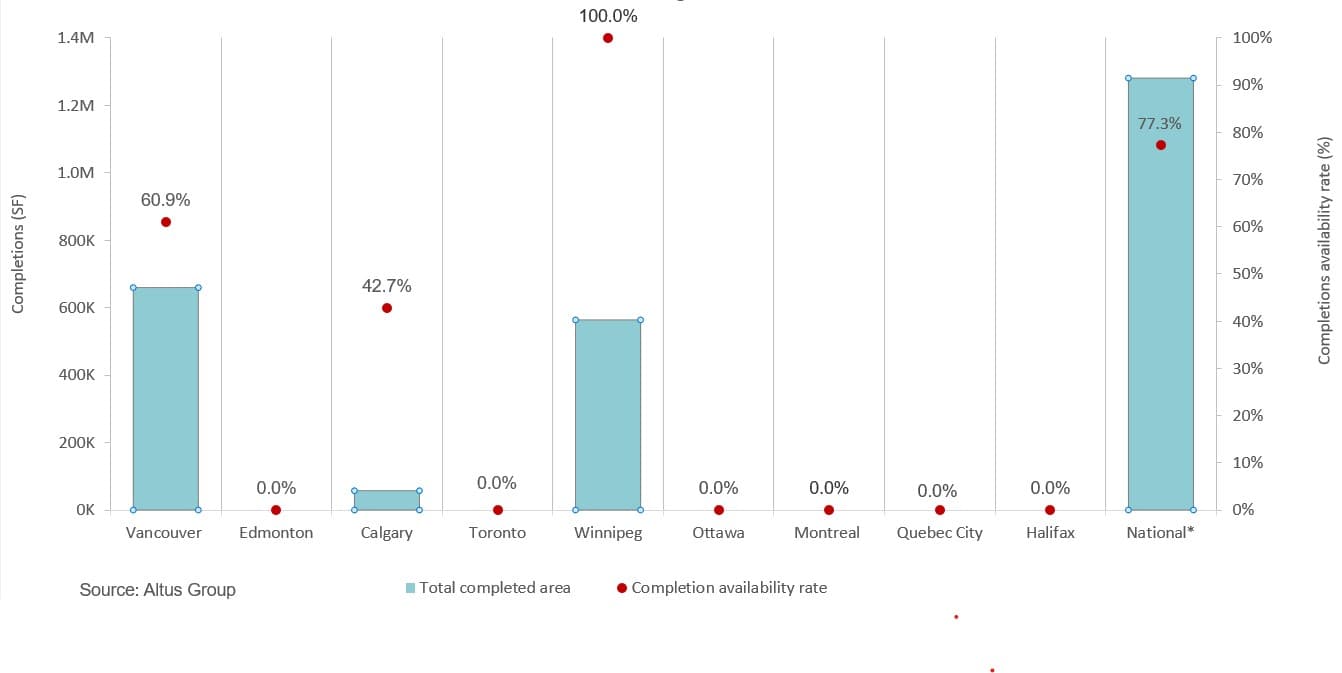
As of the third quarter of 2024, eight office buildings were completed, totalling 1.28 million square feet, with 77.3% of the space available (Figure 2). Vancouver, Toronto, and Calgary were the only markets to record office completions. Some of the notable completions include Portland Commons in Toronto, Ontario, and the Discovery Campus in Burnaby, British Columbia.
Figure 3: Office under construction and availability (Q3 2024)
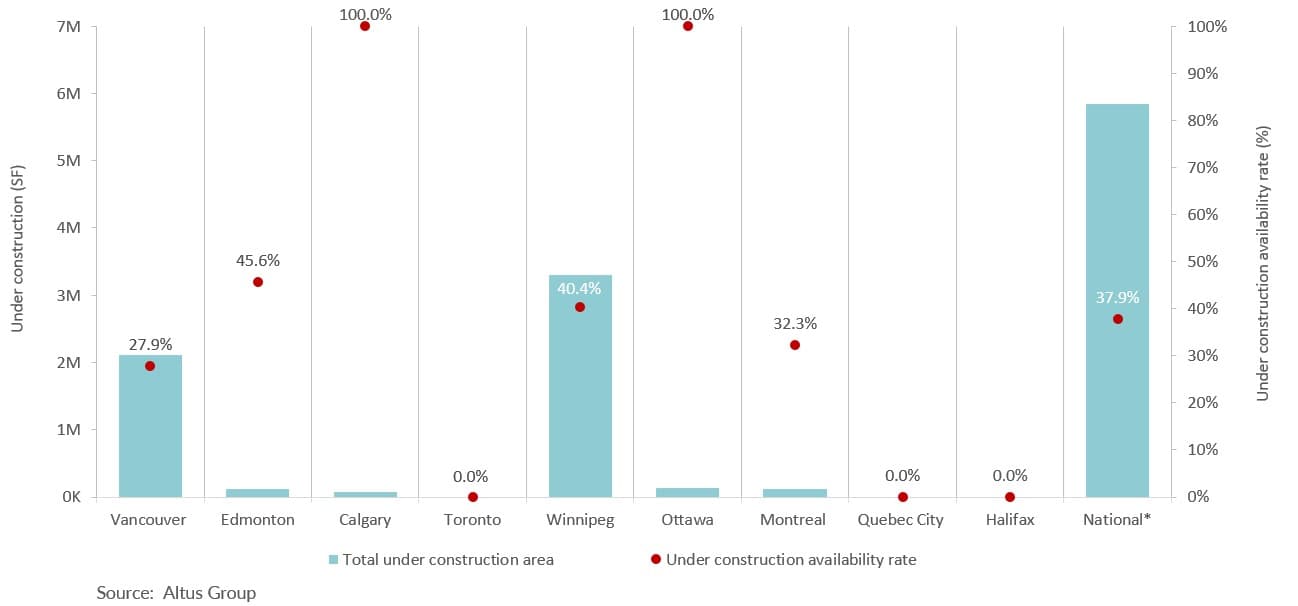
Nationally, 36 office projects were under construction in the third quarter of 2024, totalling 5.8 million square feet, with 38% of the space available (Figure 3). Vancouver and Toronto led the country with the highest number of office projects under construction, 17 and 13 buildings totalling 2.1 and 3.3 million square feet, respectively.
Conclusion
With weakened labour market conditions and lower GDP per capita, many companies were expected to shelve expansion plans. Furthermore, with the increased popularity of hybrid work and return-to-work mandates, some companies have continued downsizing efforts. In contrast, others have reversed their decisions to downsize, either renegotiating their leases while remaining in the same space or opting for the costly decision of relocating to a better space. The future of work is nuanced, with varied needs across the major markets.
Want to be notified of our new and relevant CRE content, articles and events?
Authors

Jennifer Nhieu
Senior Research Analyst

Ray Wong
Vice President, Data Solutions
Authors
Jennifer Nhieu
Senior Research Analyst
Ray Wong
Vice President, Data Solutions
Resources
Latest insights