Canadian CRE valuation analysis – Q4 2025
Canada’s office sector surprises to the upside with welcome improvement in valuation in Q4 2025.

Key Highlights
Office market posts its first value gains in four years with a 0.48% rise in Q4 values
Retail is following a slow and steady course, with values rising 0.45% quarter-over-quarter and 1.60% year-over-year
Residential values remain flat due to pressures from slowing population growth and competition from recent condo completions
Softening industrial fundamentals are creating a drag on values
Although bifurcation themes remain prevalent across property types and geographies, investor appetite to do deals could drive higher transaction volume in 2026
CRE property values continue to withstand pressure from tariffs and geopolitical events
Stability remained a key theme across Canada’s commercial real estate market in Q4. However, the latest data also reveals some notable shifts in how different property sectors are faring against a variety of market forces.
Despite ongoing headlines ranging from new global trade agreements to a battle over Greenland, values across the four major property types – office, industrial, retail, and residential – are holding relatively steady. According to the latest research from Altus Group, the Q4 consolidated average rose a slight 0.09% on a quarter-over-quarter basis, while dipping -0.22% compared to one year ago.
Figure 1 - All assets value change, 2019-2025
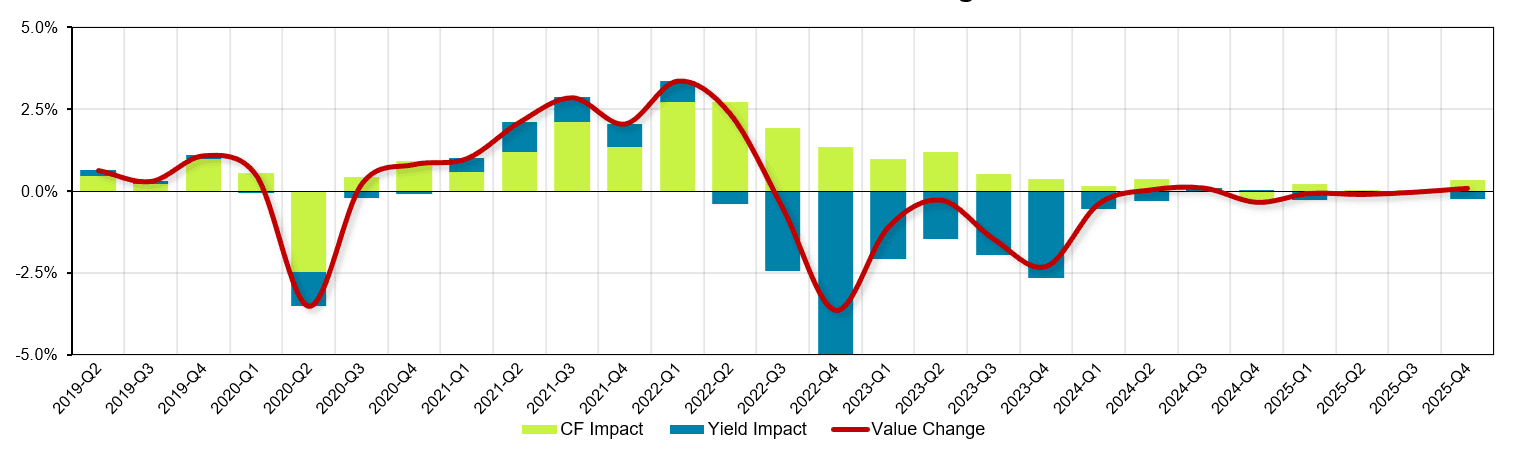
Source: Altus Group
“We’re still in this holding pattern where appraisers are looking for sales transaction data to confirm trends. The trades that are happening are confirming current pricing levels, which is why values remained relatively flat for the quarter,” says Robert Santilli, Altus Group’s Director of Valuation Advisory, Canada. Although 2025 sales came in higher than 2024, transaction activity remains low on a historical basis.
Figure 2 - Total transaction volume, 2023 vs. 2024 vs. 2025
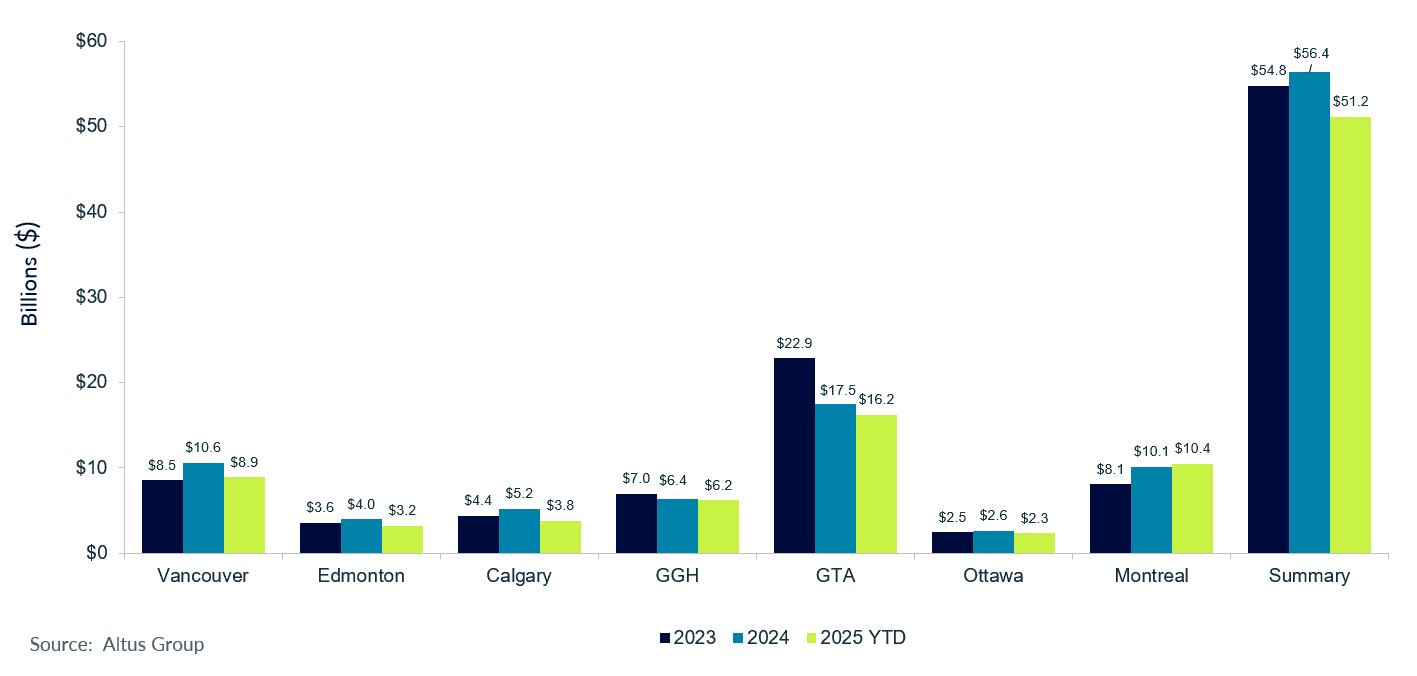
Source: Altus Group
“One positive going into 2026 is that we’re more certain of more uncertainty going forward,” says Ray Wong, Altus Group’s Vice President of Data Solutions. Last year, there was more volatility created by big policy moves, statements, and social media posts coming out of the of the US. “Every week there was something new. Now it seems as though people expect there to be surprises and noise and uncertainty,” adds Wong. “So, there’s less likely to be a market shock that rocks the market.”
Analyzing CRE valuation trends across property types
The big story for the quarter is that office values are up, which represents the first quarterly increase in four years. Retail also posted value gains, whereas residential was relatively flat. Softening fundamentals in the industrial market resulted in a slight dip in Q4 values. However, the pullback in industrial values is minimal when considering the surge in values that have occurred since the pandemic, with property values 61.1% higher compared to Q1 2020.
Figure 3 - Canada value change, total 12-month vs. peak vs. pre-pandemic
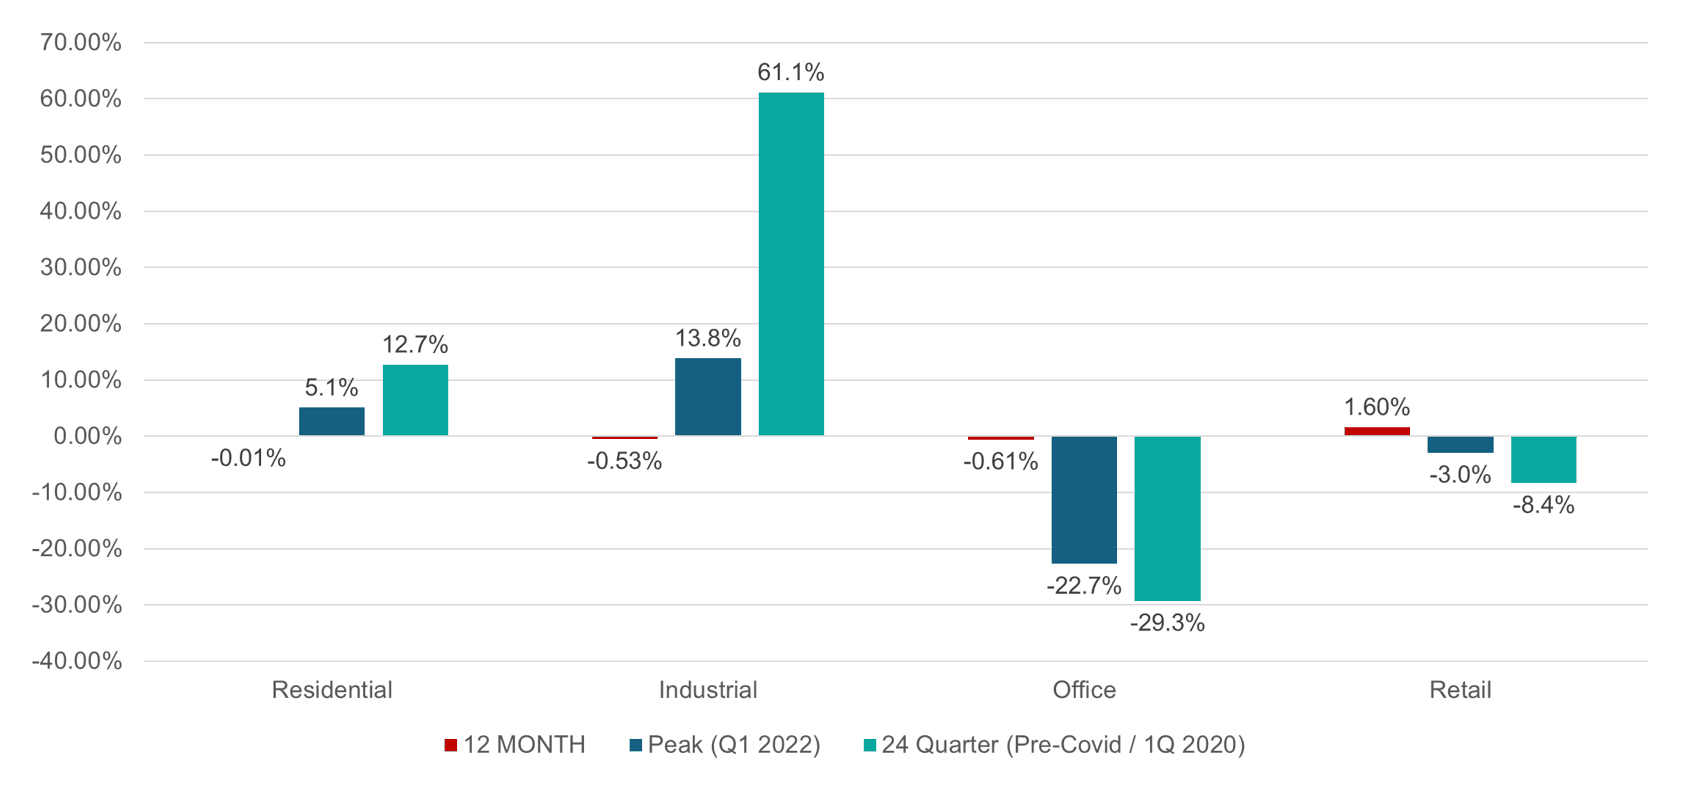
Source: Altus Group
Office
Office sector values rose 0.48% in Q4 – marking a long-awaited move out of the red. However, the improvement is by no means universal. Valuations reflect the weighted average. In this case, the larger best-in-class assets are showing improvement and lifting overall office values. On an equal-weight basis, the average office asset saw value decline by 44 basis points.
“That really shows the bifurcation in the market that is coming through in the data,” says Santilli. “Valuations on A+ assets are moving higher, whereas the lower quality assets are treading water or continuing to see values decline.”
Figure 4 - Sector quarterly value change, office
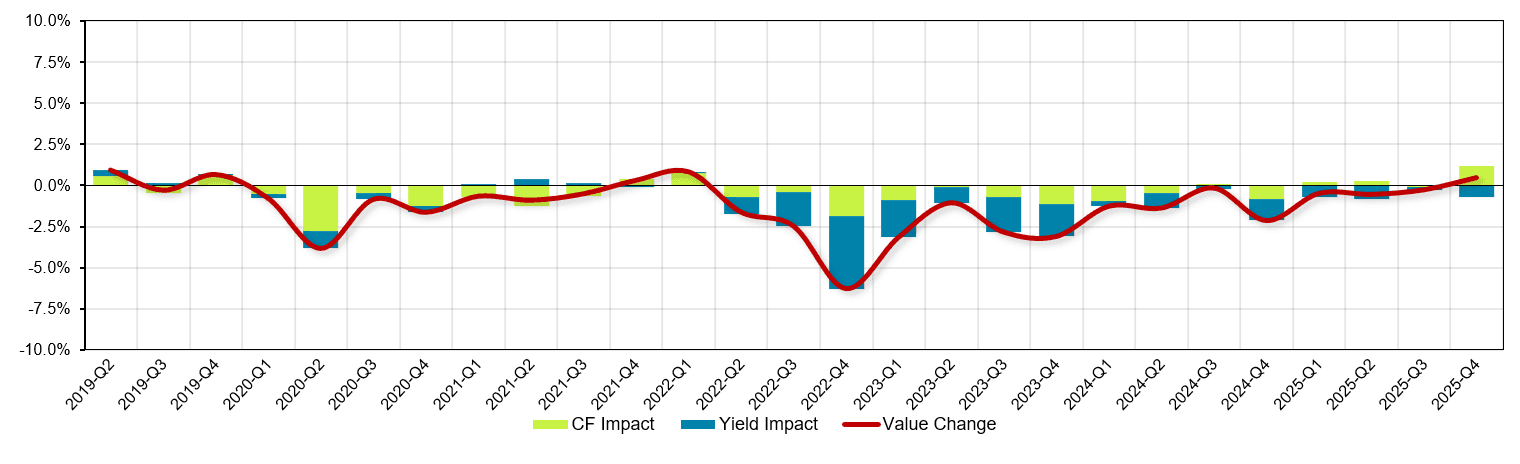
Source: Altus Group
The bifurcation is also evident when looking at data across major geographic markets. The Greater Toronto Area (GTA) led in value gains at 2.29%, primarily due to its larger concentration of trophy assets. Those properties are benefiting from increased leasing activity, particularly from financial services firms that are seeking best-in-class space for employees. The shrinking availability of A+ space is creating a landlord’s market, which should result in continued rent growth and higher NOI.
“The trend that has yet to play out, but is logical, is the trickle-down effect. As AAA space becomes scarce, demand will spill over to benefit AA and A assets,” says Wong. For example, 320 Bay Street in Downtown Toronto is a renovated asset that is now almost fully leased.
Overall, Canada’s office leasing market hit bottom in Q4 2022 and has been steadily improving since Q4 2024. In addition to the flight to quality, leasing activity is being driven by return-to-office requirements. Although the Toronto office market is showing the strongest momentum, A+ assets in other city centres are also experiencing strong leasing. “Leasing will flow through to values, and as investors accept office as an investable asset class, we'll see what investors will pay for increased leasing. So, I think we'll see the broader trend of values for A+ assets move steadily higher in major markets,” says Santilli.
Retail
Retail posted QoQ value gains that were nearly on par with office at 0.45%. Retail also stands out as the strongest performer on a year-over-year (YoY) basis, with values that are up 1.60% compared to a year ago. Open format grocery-anchored retail remains the top performing sector – and most sought after by investors. According to Altus Group’s Canada Investment Trends Survey, food-anchored retail strip centres remained the most coveted property type for an eighth consecutive quarter. The challenge for retail investors is that few properties are coming to the for-sale market.
Figure 5 - Property type barometer – All available products, Q4 2025
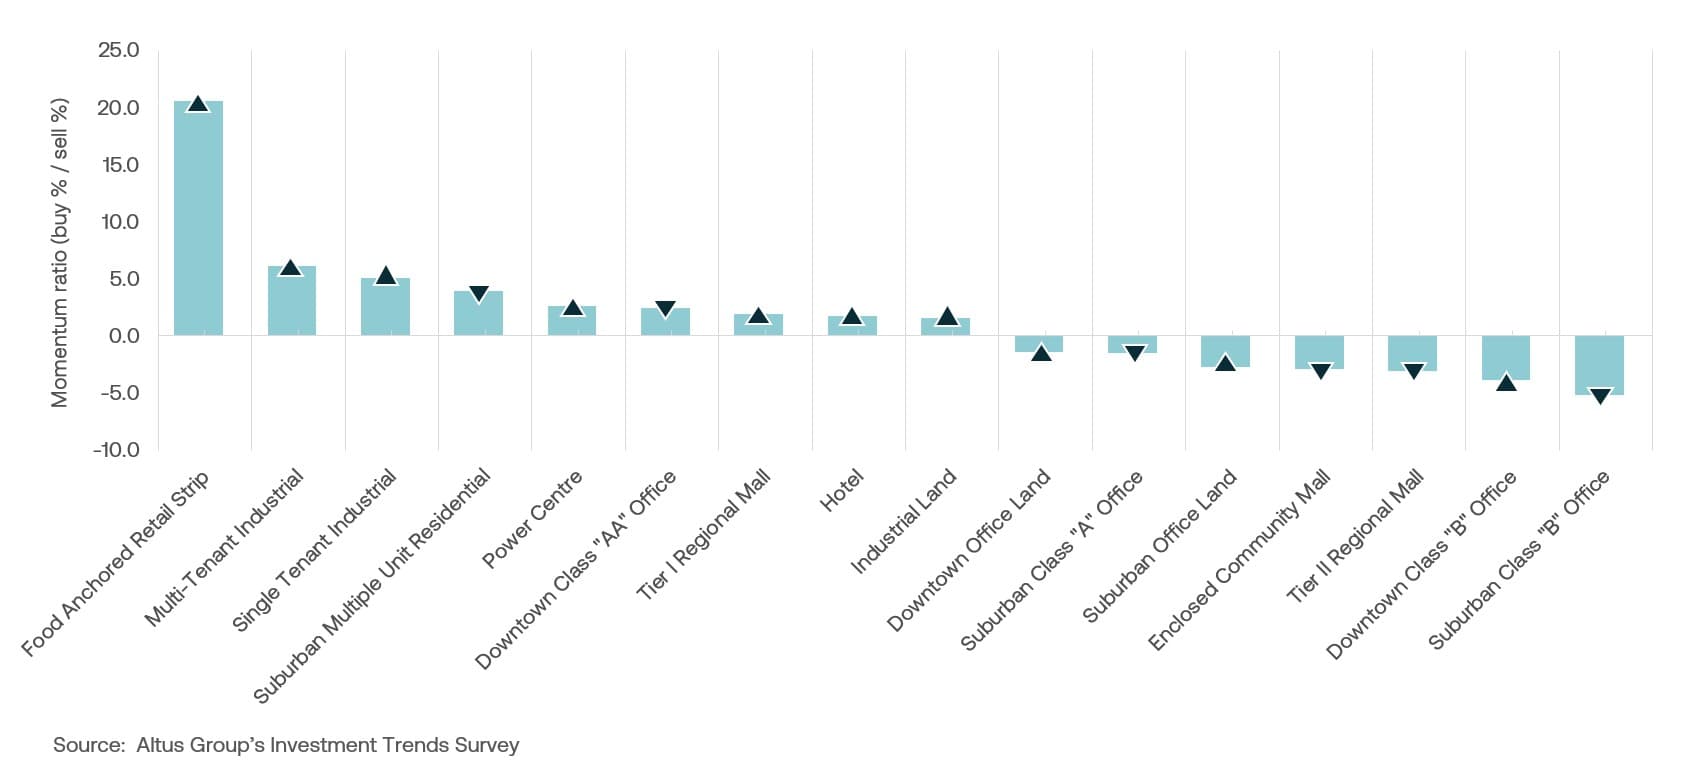
Source: Altus Group’s Investment Trends Survey
Another notable positive for the retail sector is, with the exception of Greater Ottawa, all major markets posted value gains on both a QoQ and YoY basis. Greater Edmonton generated the biggest Q4 value gains at 2.58%, followed by Calgary at 1.31%. However, some landlords are facing limits on how much further they can raise rents. Some tenants are approaching a ceiling on how much they can afford to pay, which could constrain NOI. Another challenge for retail is that inflation is still elevated, particularly for food. The impact of inflation on consumers is something that investors are continuing to watch closely.
Figure 6 - Sector quarterly value change, retail
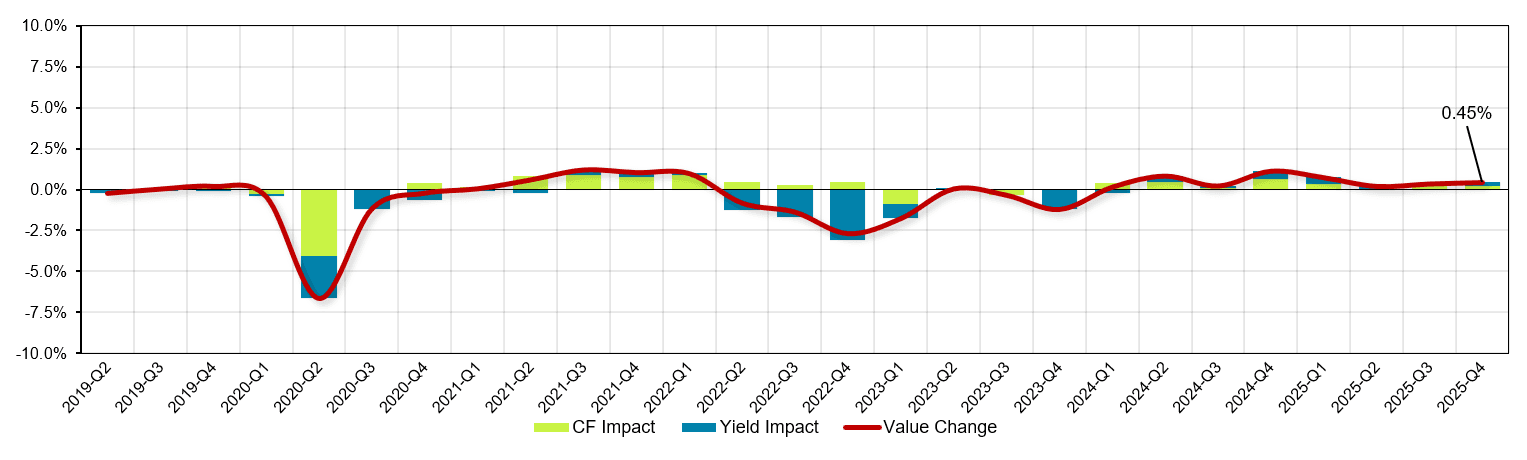
Source: Altus Group
Residential
Residential values remained relatively flat in Q4, rising a slight 0.19% and -0.01% on a YOY basis. Apartments are facing headwinds from a combination of excess supply and diminished demand in the wake of a new immigration policy that is slowing population growth. One exception is Alberta, which is benefiting from people moving to the area from other parts of Canada. Montreal is also continuing to outperform, with values that rose 0.70% in Q4.
Figure 7 - Sector quarterly value change, residential
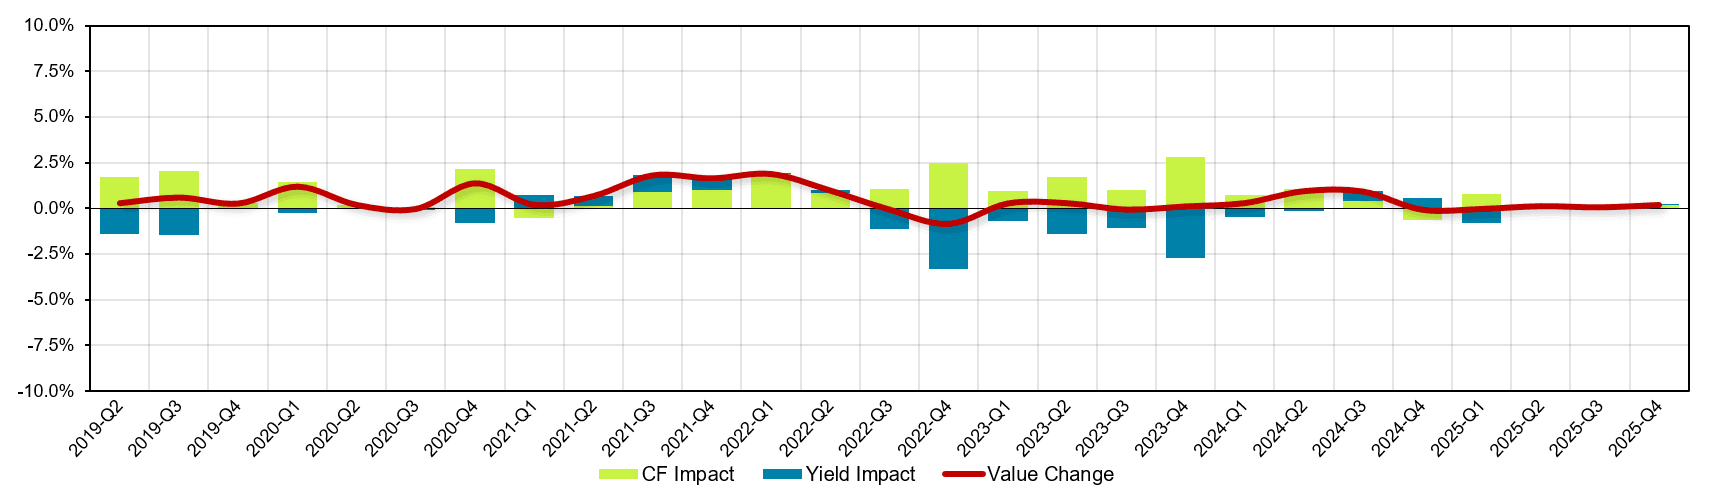
Source: Altus Group
A common problem in Greater Toronto and Vancouver is increased competition from the condo market. A significant number of condo projects that started construction two and three years ago are now just coming to completion. A slump in condo sales has resulted in unsold units coming to the rental market, which is putting competitive pressure on apartment rents.
With the exception of Alberta and Montreal, rents are rolling backwards and owners are introducing free rent and other tenant inducements.
However, the challenges in the apartment sector are viewed as a short-term problem. Construction starts have declined, and it could be another 24 months before developers put shovels in the ground given current fundamentals. So, markets are unlikely to see much in the way of new supply coming online until 2029. “Once we move through the supply issue and population growth resumes, which will be towards the latter part of the decade, I think we will again see tightness in the residential market,” says Santilli.
One recent transaction that shows how residential values are holding up is the sale of Minto Apartment REIT’s 28-property portfolio. The transaction was reportedly valued at $2.3 billion or $18.00 per trust unit, which represents a 32% premium over the Jan 2, 2026, closing price. “That reaffirms the interest in quality multi-family assets and also the level of private market values,” notes Wong.
Industrial
Industrial was the only sector that saw values pull back in Q4, with a slight -0.35% correction. Values are also down -0.53% on a YoY basis. The industrial sector is still working to absorb the supply boom, with absorption hampered by a slowdown in leasing activity. Tenants have been more cautious in decision-making due to uncertainty related to the potential ripple effects of tariffs on supply chains, consumer demand, and economic growth.
Figure 8 - Sector quarterly value change, industrial
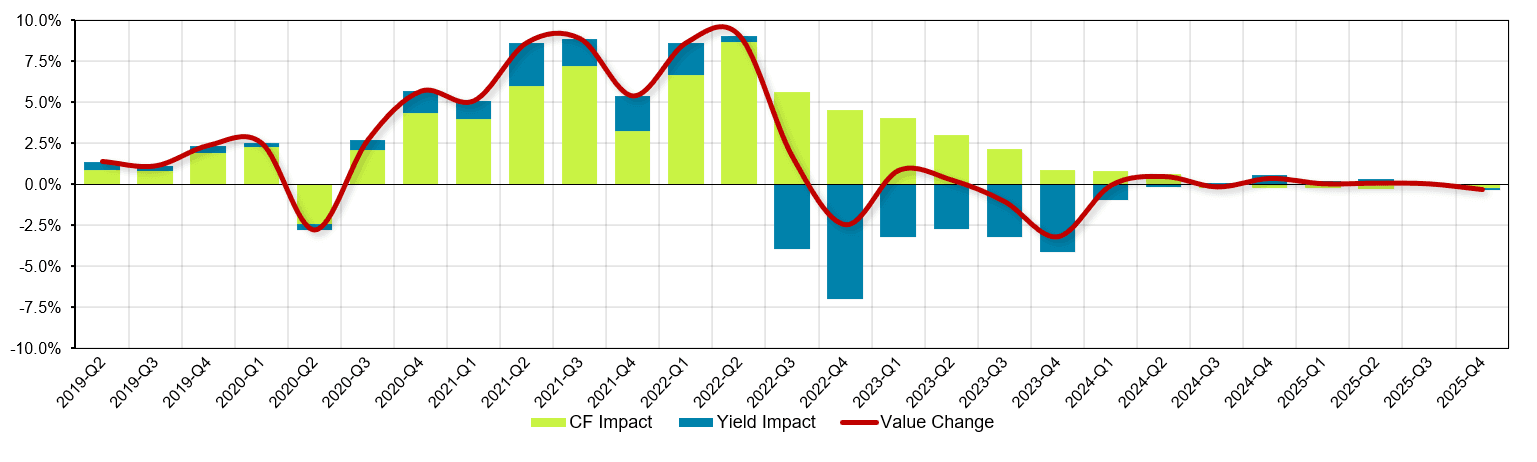
Source: Altus Group
Tariffs have not had the severe negative impact that some had anticipated, and recession fears have also not materialized. However, logistics companies are still cautious in taking on new space, which is slowing absorption of new supply, particularly in large bay warehouses. Industrial has also seen a big run-up in rents over the past four years. Now that tenants have more options, those rental rates are starting to soften. “Investors are wary of buying into an asset class where rents might be moving backwards. So, the multiple or cap rate that investors are willing to pay for industrial is moving higher,” adds Santilli.
Although industrial values are down overall, performance is a bit of a mixed bag when looking at individual markets. As the two largest markets, Montreal and the GTA are experiencing the biggest challenges. The GTA posted a -0.95% dip in values in Q4, whereas Montreal values declined -0.39%. All other major markets are weathering headwinds with stable or slightly positive gains in valuation due to their continued strength in cash flows.
Property valuation outlook
The investment sales market showed improvement in 2025, and the expectation is that activity will gain more traction in the coming year. “We see a little bit brighter outlook for the investment market compared to 2025,” says Wong. “We may not be seeing an increase in transactions yet, but there is increasing investor interest that could result in increasing sales, particularly in the second half of 2026.”
Fundamentals across most sectors are relatively solid. However, economic growth will be somewhat slower with Canada’s GDP forecast for 2026 now at between 1% and 1.5%. Generally, property values across most sectors will hold relatively steady in the first quarter. Retail and A+ office valuations are a notable bright spot. Class A office in particular is expected to continue on its path of slow and steady improvement in 2026, with leasing velocity that will flow through to valuations. “I think quality office will be an outperformer in 2026 relative to other sectors,” says Santilli.
Those sectors that are likely to face near-term challenges are residential and industrial. The larger industrial markets, the GTA and Montreal, could see some additional softening in values, whereas values in other major markets will remain stable. A positive that will help support values across all sectors is that construction activity has slowed, which should result in positive absorption. Yet a persistent theme across property types and geographies is bifurcation, which requires investors to look at the different nuances and dynamics driving values within specific markets and submarkets.
Want to be notified of our new and relevant CRE content, articles and events?
Disclaimer
This publication has been prepared for general guidance on matters of interest only and does not constitute professional advice or services of Altus Group, its affiliates and its related entities (collectively “Altus Group”). You should not act upon the information contained in this publication without obtaining specific professional advice.
A number of factors may influence the performance of the commercial real estate market, including regulatory conditions and economic factors such as interest rate fluctuations, inflation, changing investor sentiment, and shifts in tenant demand or occupancy trends. We strongly recommend that you consult with a qualified professional to assess how these and other market dynamics may impact your investment strategy, underwriting assumptions, asset valuations, and overall portfolio performance.
No representation or warranty (express or implied) is given as to the accuracy, completeness or reliability of the information contained in this publication, or the suitability of the information for a particular purpose. To the extent permitted by law, Altus Group does not accept or assume any liability, responsibility or duty of care for any consequences of you or anyone else acting, or refraining to act, in reliance on the information contained in this publication or for any decision based on it. The distribution of this publication to you does not create, extend or revive a client relationship between Altus Group and you or any other person or entity. This publication, or any part thereof, may not be reproduced or distributed in any form for any purpose without the express written consent of Altus Group.
Authors

Ray Wong
Vice President, Data Solutions

Robert Santilli
Director, Valuation Advisory - Canada
Authors
Ray Wong
Vice President, Data Solutions
Robert Santilli
Director, Valuation Advisory - Canada
Resources
Latest insights