Large US CRE deals made a comeback in Q3 2025
Large CRE deals roared back in Q3 2025, with $76B in single-asset trades and the strongest growth rates in a decade, signaling rising investor conviction.

Key highlights
Reonomy data indicates that the number of large US commercial real estate deals rose 48% from the prior quarter and 41% from a year earlier, reaching the highest count since 2022
After a quiet start to the year, Q3 2025 saw a sharp rebound in transactions over $10 million
Large transactions totaled 76.4 billion dollars and accounted for nearly 68% of all investment dollars, the largest share since mid-2022
Despite the surge, the median large-deal size remains around $2 million below 2021 levels
Among large deals, pricing is starting to firm for industrial, retail, and multifamily assets, while office continues to lag
But the key question heading into Q4 is whether this resurgence marks a lasting market recovery or a short-term burst of activity
This analysis of large deal trends is based on our Q3 2025 US commercial real estate investment and transaction quarterly report
The return of the large deal
After a slower-than-expected start to 2025, third quarter figures from Altus Group’s Research Team’s Q3 2025 US CRE investments and transactions quarterly report showed a meaningful shift in commercial real estate (CRE) investment activity. For the first time in several quarters, the total number of traded properties increased both quarterly and annually. The more telling signal, however, may be in the composition of that activity: large single-asset transactions, those valued at $10 million and above, returned in force.
The scale of the rebound
Following the Global Financial Crisis, the number of large transactions rose steadily as property values recovered. From roughly 500 per quarter in 2011, the count climbed above 1,500 by 2015 and held near that level through the late-cycle expansion. In the immediate post-pandemic period, activity briefly surged to more than 4,000 such deals in Q4 2021. But that momentum faded after interest rates began rising in 2022. Between early 2023 and mid-2025, the 1,500-deal mark was surpassed only once.
Count of single-asset large deals (>$10M) by sector
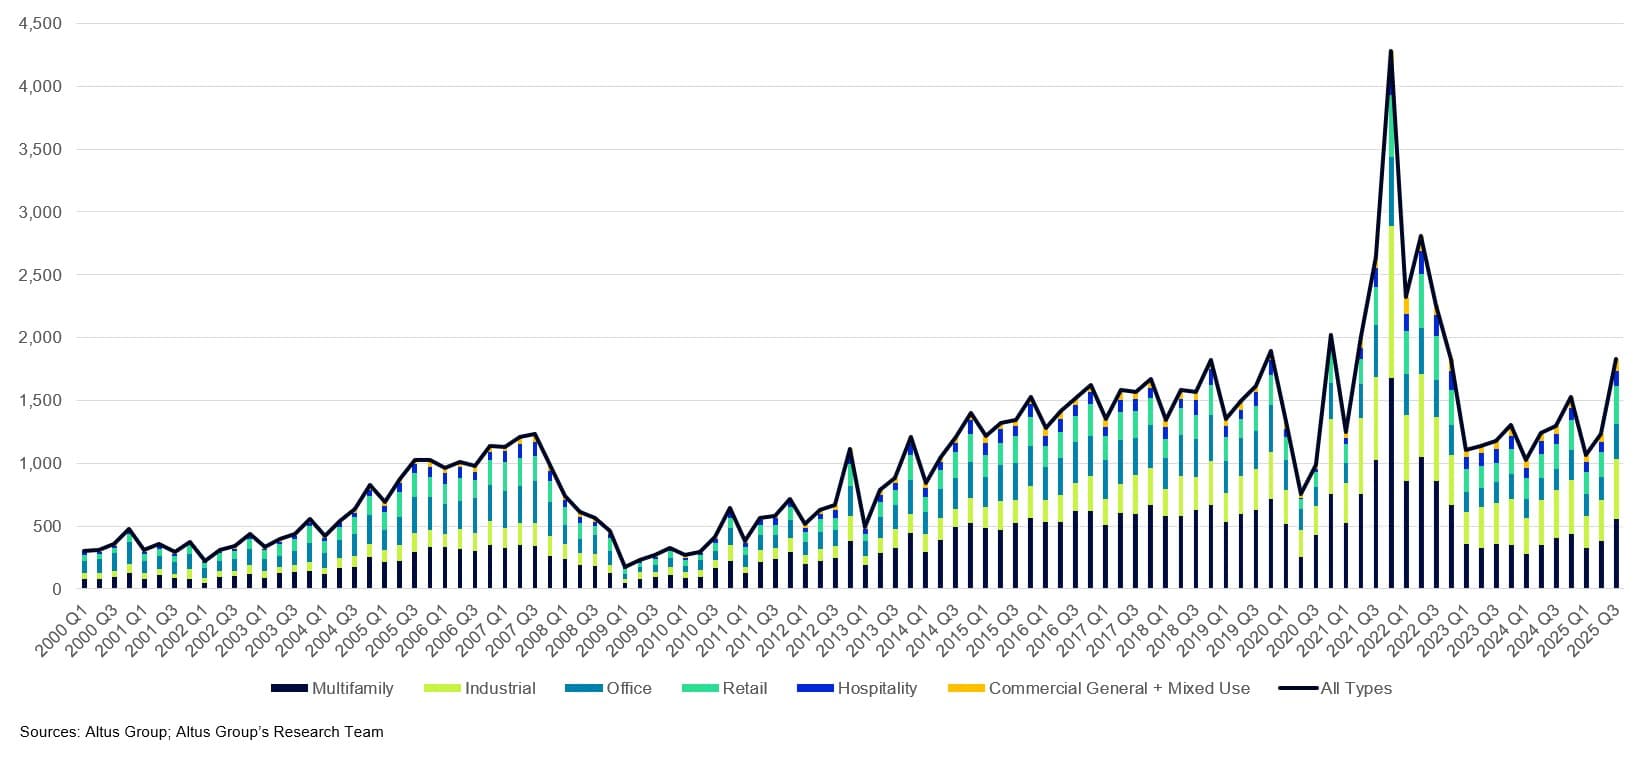
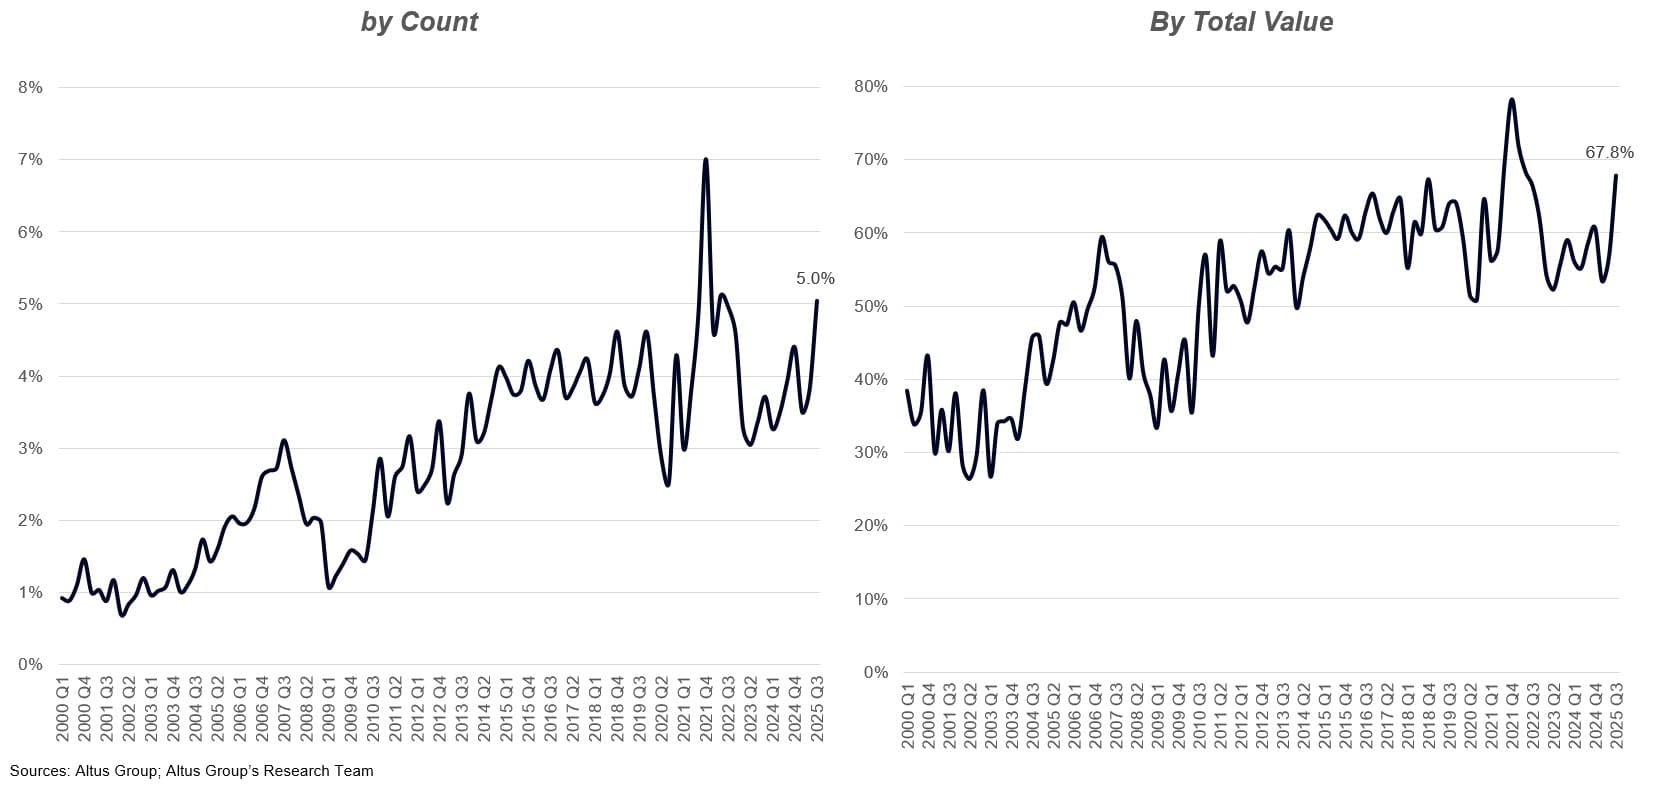
But Q3 2025 marked a clear break in that pattern, signaling renewed conviction among investors. A total of 1,826 single-asset transactions exceeded $10 million in Q3 2025, the most since Q3 2022, equal to 5% of all single-asset trades. The value of those transactions surpassed $76 billion, the highest since Q3 2022, and a total that has only been seen twice before the pandemic. Large deals accounted for 67.8% of all single-asset dollars, a level last seen in mid-2022 and slightly above the pre-pandemic high of 67.2% in late 2018.
Percent share of single-asset large deals (>$10M)
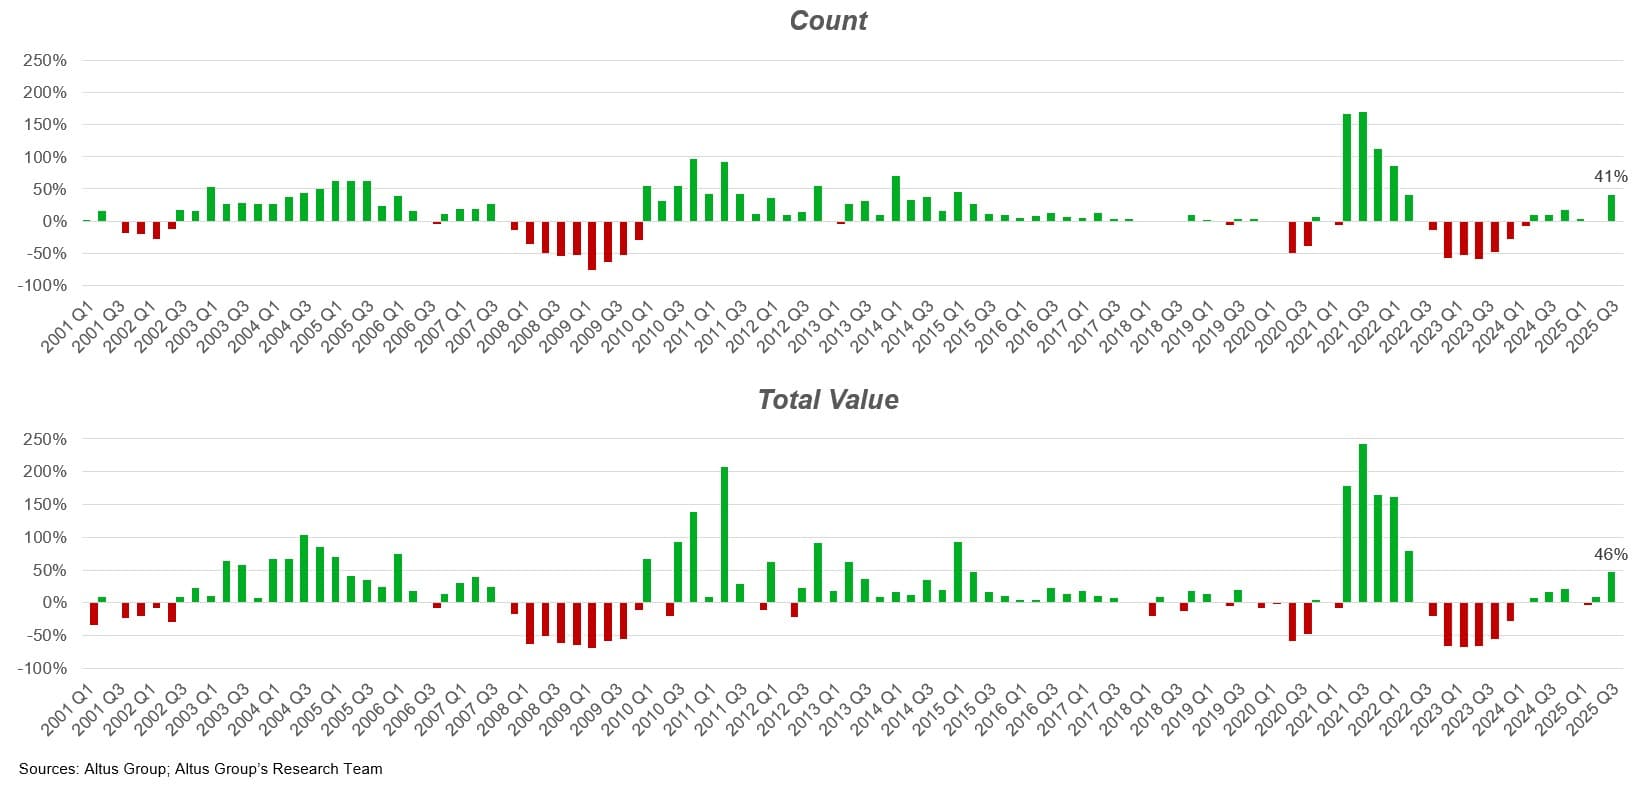
Overall, the large deal count rose 48% quarter-over-quarter, 41% year-over-year, and 15.9% on a trailing four-quarter basis. Total value rose 48% from Q2, 46% from a year ago, and 19.3% on a trailing four-quarter basis. Excluding the immediate post-pandemic boom period, this was the largest growth rate for such deals in more than a decade: by count since Q1 2015 and by total value since Q2 2015.
Annual change in large deal (>$10M) transaction volume

Why total transaction volume remains below peak levels
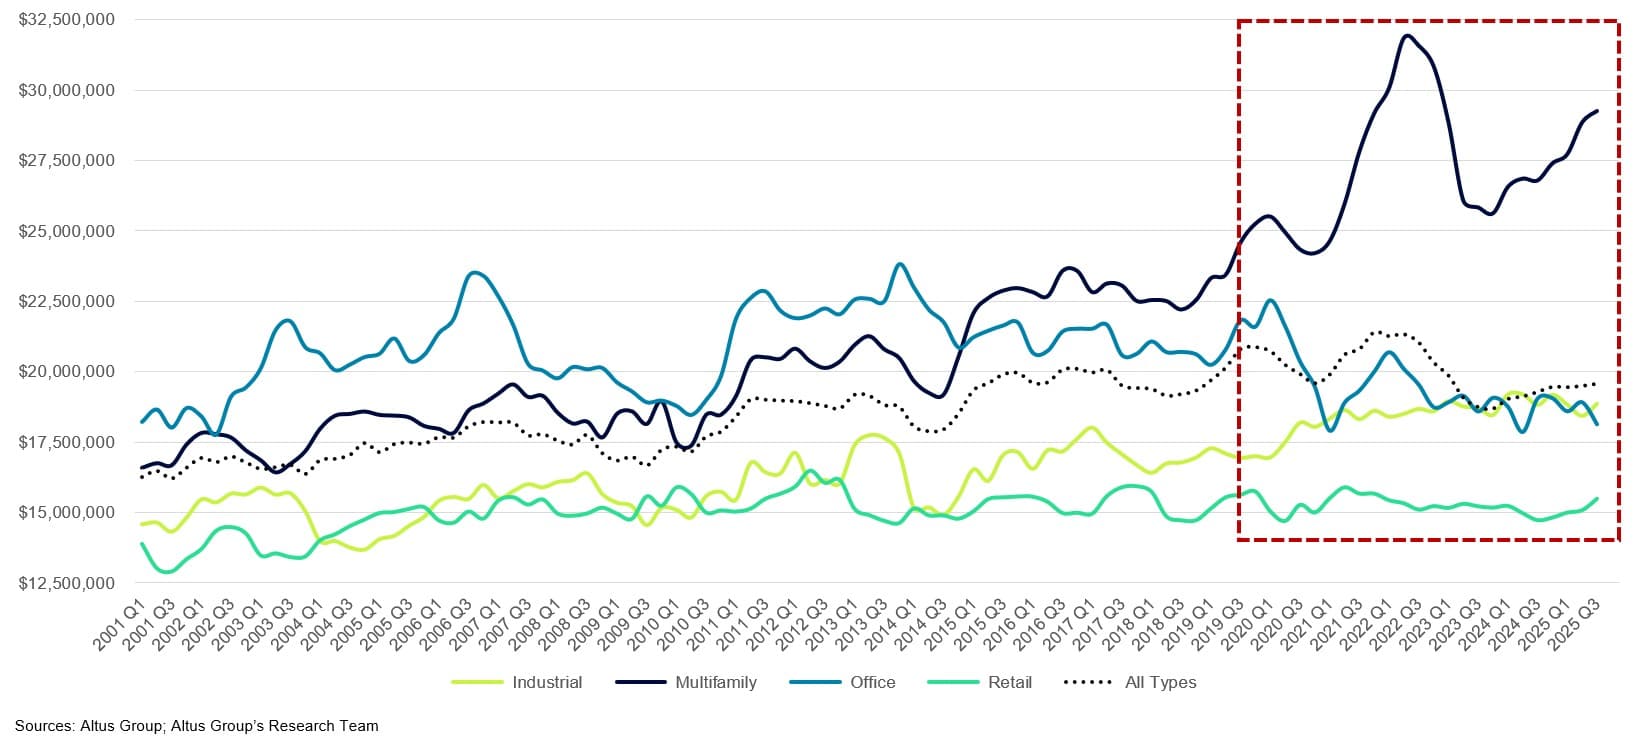
Despite the rebound in deal activity, total transaction volume remains below 2021 and the highs of 2022. The shortfall is largely a function of deal size. The median large-deal value across all property types in Q3 2025 was $19.6 million, about 9% lower than the $21.4 million peak reached in late 2021.
In fact, every major property type was below its historical high point in Q3 2025:
Sector | Median large deal size (Q3 2025, $M) | Peak ($M) | Peak period | % change from peak |
|---|---|---|---|---|
Industrial | 18.9 | 19.2 | Q1 2024 | -1.7% |
Multifamily | 29.3 | 31.8 | Q2 2022 | -8.2% |
Office | 18.1 | 23.8 | Q4 2013 | -23.8% |
Retail | 15.5 | 16.5 | Q2 2012 | -6.1% |
All types | 19.6 | 21.4 | Q4 2021 | -8.6% |
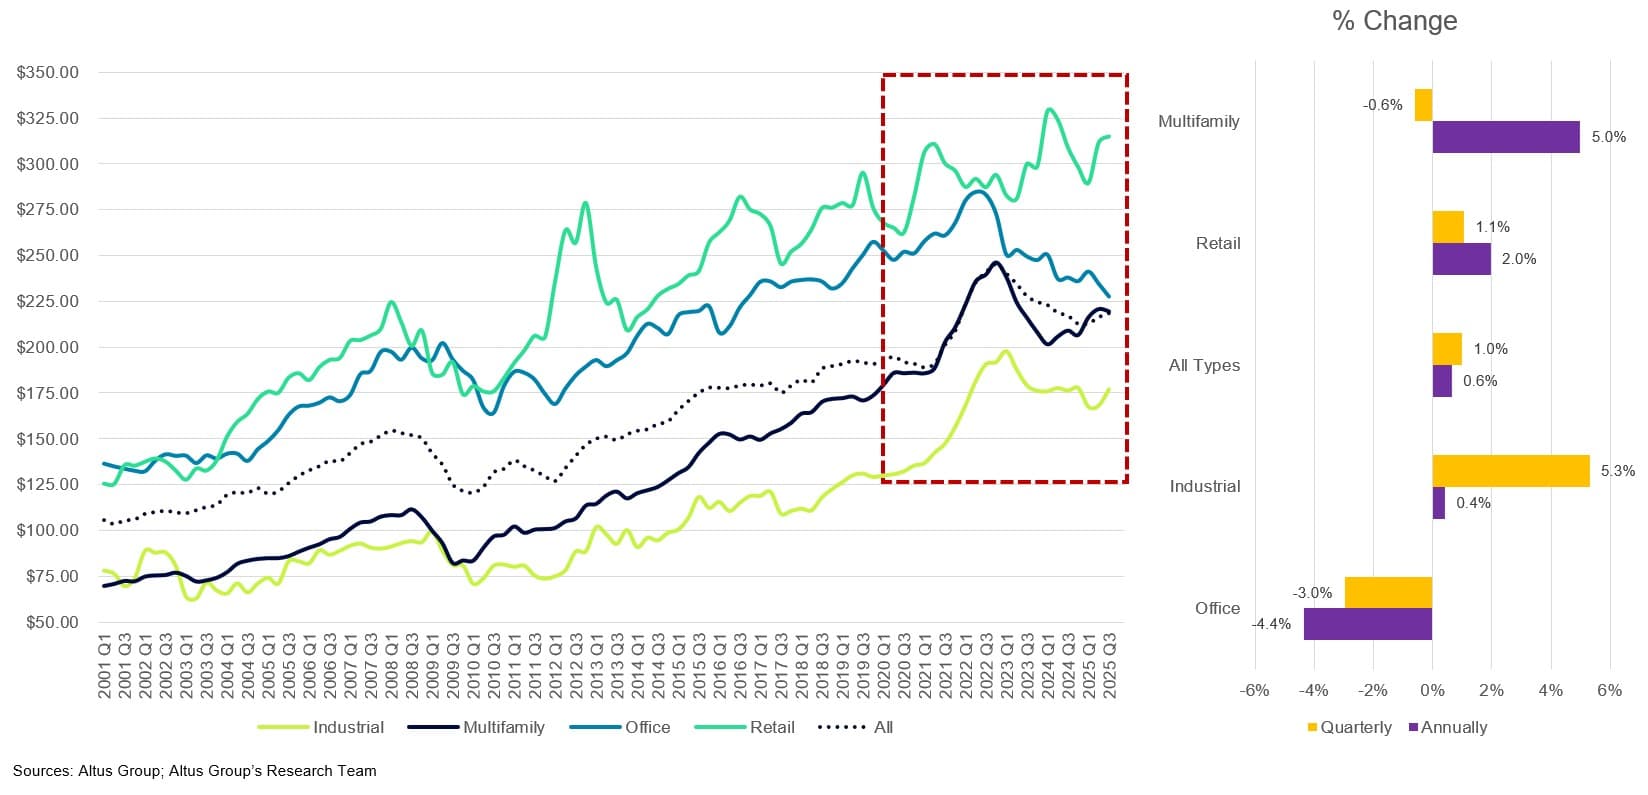
Multifamily’s decline from its Q2 2022 peak roughly mirrors the overall trend, down 8.2%from late 2024. Industrial reached its high point more recently in Q1 2024 and remains only 1.7% below that level. The office sector stands out as the clear laggard, with the median office transaction size falling 23.8% since Q4 2013, marking a sustained slide spanning more than a decade. Retail deal size has held remarkably steady, hovering near $15 million for years and sitting just 6.1% below its 2012 peak.
But some recent growth is evident, with the median size of large CRE transactions having increased 4.7% from the post-pandemic trough in Q4 2023, driven primarily by a 14.2% rise in median multifamily deal size.
Median large deal (>$10M) transaction size by sector
Pricing trends provide additional context. Across all property types, median price per square foot rose 0.6% quarter-over-quarter and year-over-year, suggesting some stabilization. However, office pricing declined 3.0% on the quarter and 4.4% on the year, while multifamily pricing slipped 0.6% quarterly (but rose 5.0% annually).
Median large deal (>$10M) price per square foot
A step toward normalization
The reappearance of large single-asset transactions, even at smaller deal sizes than the 2021-2022 boom period, marks an important step toward market normalization. Investors are again demonstrating a willingness to commit meaningful capital to individual properties, reflecting improved price discovery and a modest increase in risk appetite.
Heading into year-end, the key question is whether this momentum can be sustained. Will large-deal activity continue to accelerate as borrowing costs stabilize, or will the market pause again before a broader recovery takes hold?
Either way, Q3 2025 provided the clearest evidence in several years that liquidity is returning to the upper tier of the CRE market. Find more information about CRE trends in Q3 2025 in the latest edition of the US CRE investment and transactions quarterly report.
Disclaimer
This publication has been prepared for general guidance on matters of interest only and does not constitute professional advice or services of Altus Group, its affiliates and its related entities (collectively “Altus Group”). You should not act upon the information contained in this publication without obtaining specific professional advice.
A number of factors may influence the performance of the commercial real estate market, including regulatory conditions and economic factors such as interest rate fluctuations, inflation, changing investor sentiment, and shifts in tenant demand or occupancy trends. We strongly recommend that you consult with a qualified professional to assess how these and other market dynamics may impact your investment strategy, underwriting assumptions, asset valuations, and overall portfolio performance.
No representation or warranty (express or implied) is given as to the accuracy, completeness or reliability of the information contained in this publication, or the suitability of the information for a particular purpose. To the extent permitted by law, Altus Group does not accept or assume any liability, responsibility or duty of care for any consequences of you or anyone else acting, or refraining to act, in reliance on the information contained in this publication or for any decision based on it. The distribution of this publication to you does not create, extend or revive a client relationship between Altus Group and you or any other person or entity. This publication, or any part thereof, may not be reproduced or distributed in any form for any purpose without the express written consent of Altus Group.
Author

Cole Perry
Associate Director of Research, Altus Group
Author
Cole Perry
Associate Director of Research, Altus Group
Resources
Latest insights