Canadian industrial market update – Q3 2023
Industrial availability rate continues to increase

Key highlights
Even in a volatile market, the Canadian industrial sector outperformed all the other asset classes and remained favoured for its minimal risk and stable returns
The industrial sector reported $16.0 billion transacted year-to-date
Tenants have been more proactive in seeking out suitable spaces ahead of their lease’s expiration, and in response, landlords are listing their spaces before they are vacated
There were 185 industrial projects underway in the third quarter of 2023, totalling 38.6 million square feet, with 38.6% pre-leased
There were 35 industrial building completions in the third quarter of 2023, totalling 6.7 million square feet, with 53.5% pre-leased
Canadian industrial cap rates have increased to 6.95% from 5.53% in the previous quarter, mainly due to elevated interest rates and higher borrowing costs
Industrial availability rate continues to increase
Despite elevated interest rates and inflationary pressures, the industrial sector outperformed all the other asset classes and continued to be favoured for its minimal risk and stable returns. The industrial sector reported $16.0 billion transacted year-to-date, a slight decline of 3.3% year-over-year. In the third quarter of 2023, the national availability rate increased by 0.3% to 3.6%, with increases observed in seven of the eight major markets (Figure 1).
Furthermore, as many markets are challenged by aging and limited industrial infrastructure, the demand for industrial supply has not waned despite elevated interest rates, labour shortages and increased construction and material costs. Additionally, the shift towards e-commerce, changing consumer behaviour, and supply chain woes have necessitated the demand for modern warehousing and distribution centres in the outer areas of major urban markets.
Overall, market conditions remain tight. Tenants have been more proactive in seeking out suitable spaces ahead of their lease’s expiration, and in response, landlords are listing their spaces before they are vacated. Along with the new supply introduced this quarter, the increased prevalence of this practice has contributed to a rise in availability.
Figure 1 - Industrial availability Q3 2022 vs. Q2 2023 vs. Q3 2023
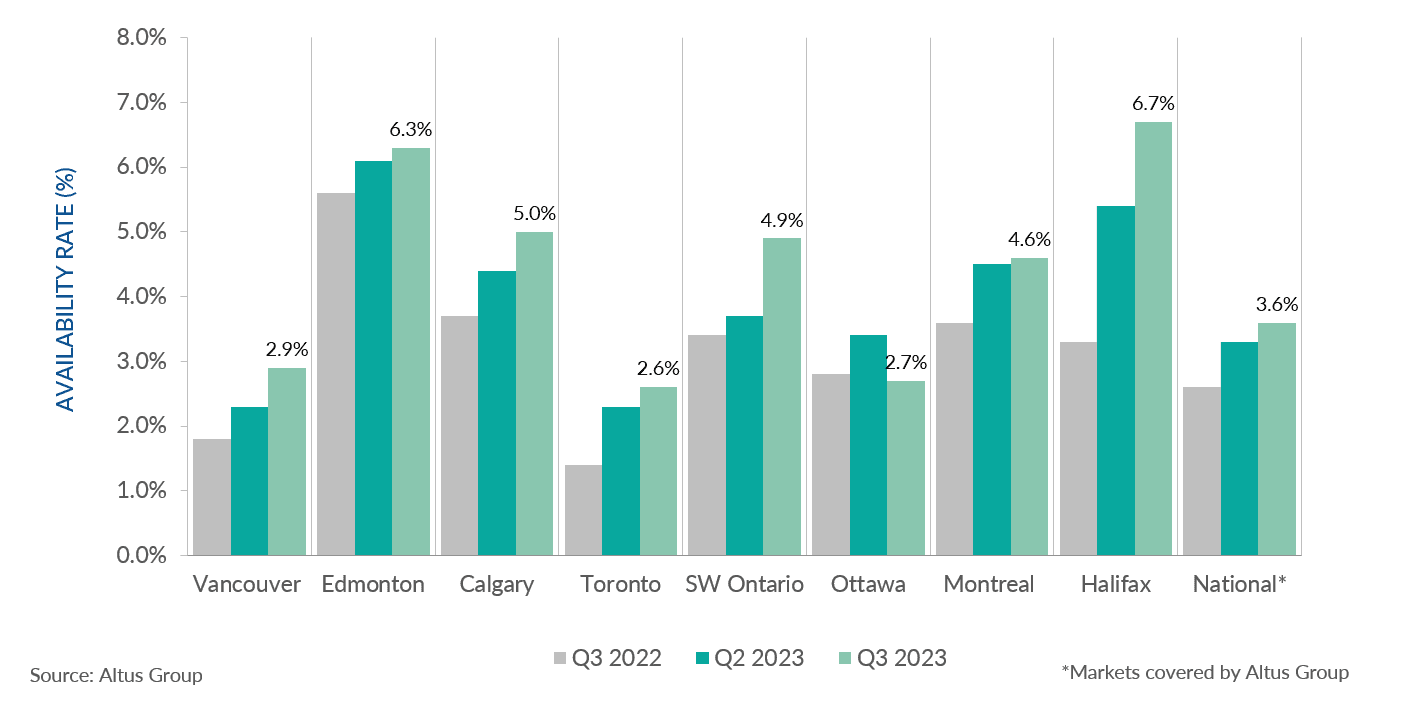
Figure 2 - Industrial completions and availability – Q3 2023
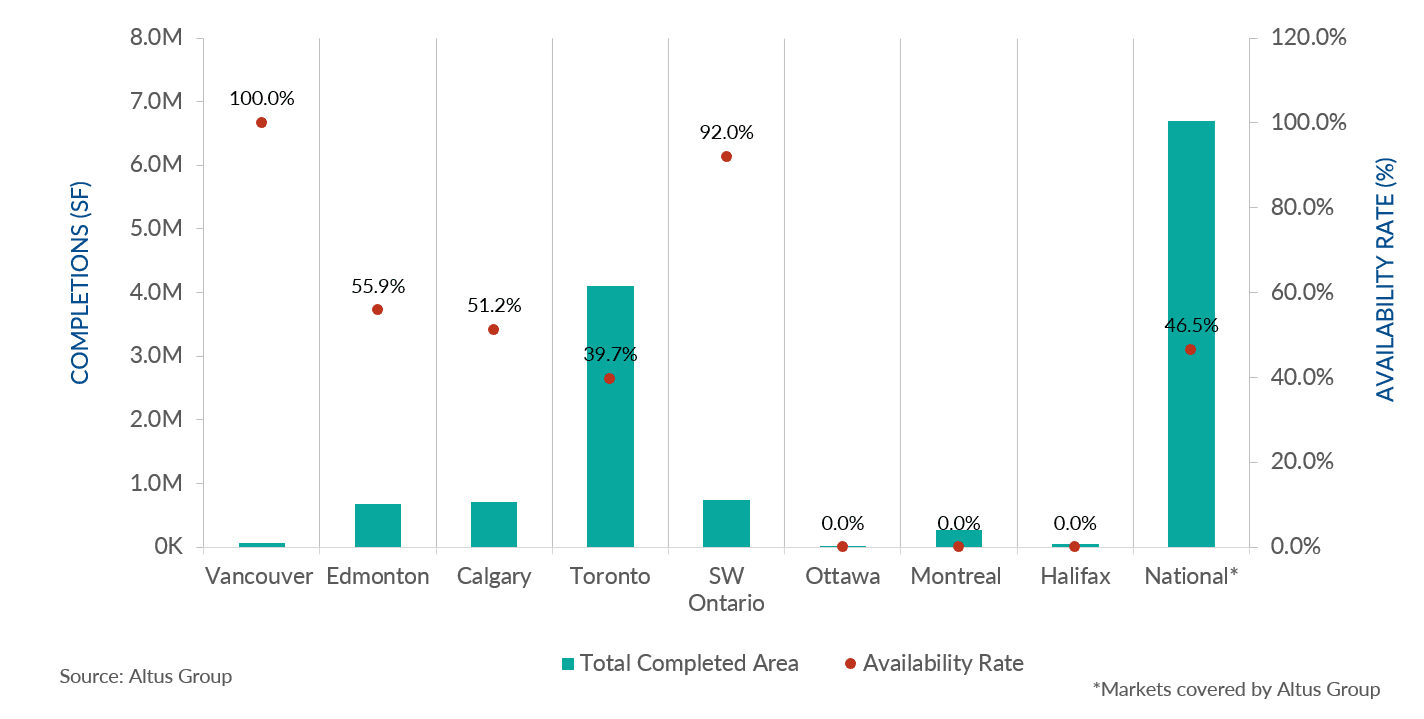
There were 35 industrial building completions in the third quarter of 2023, totalling 6.7 million square feet, with 53.5% pre-leased. Toronto and Southwestern Ontario comprised the majority of the new supply in terms of total square feet, at 4.1 million and 743,844, respectively (Figure 2).
Figure 3 - Industrial under construction and availability – Q3 2023
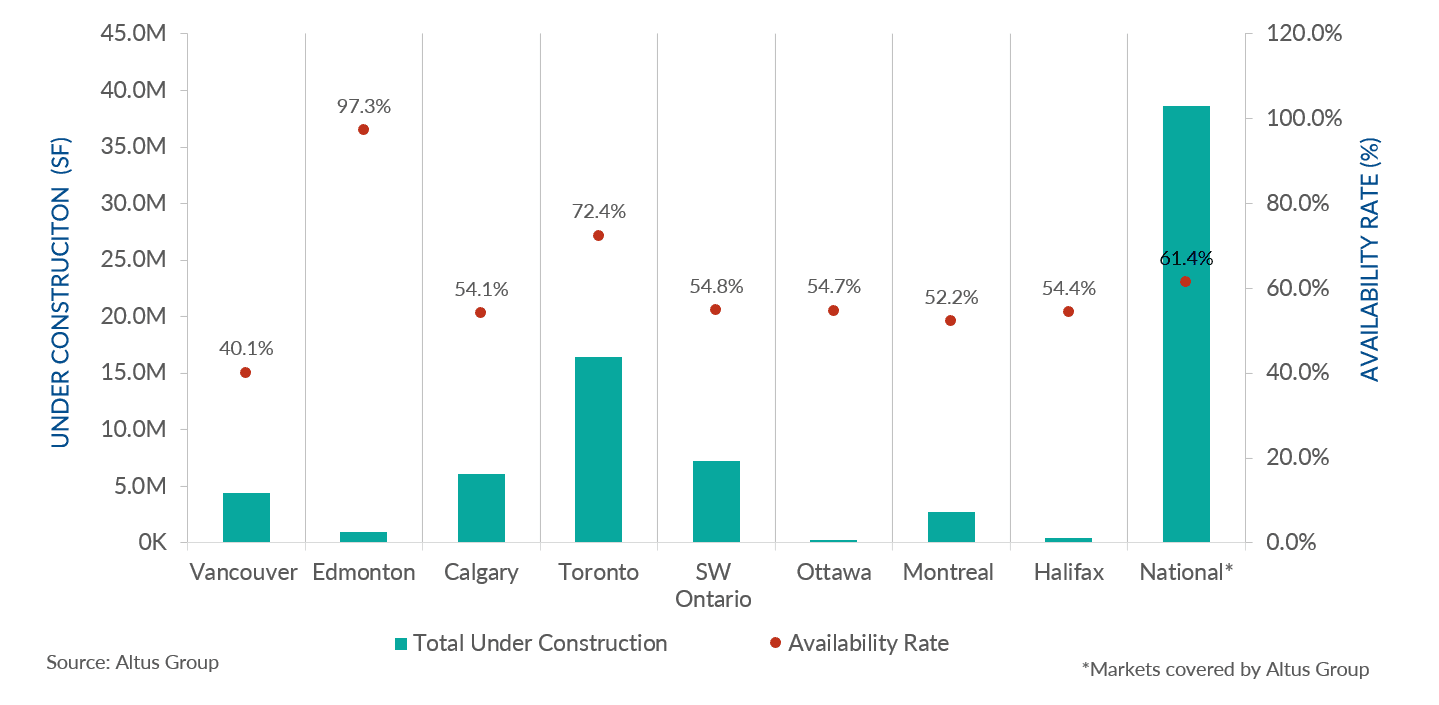
In the third quarter of 2023, there were 185 projects underway, totalling 38.6 million square feet, with 38.6% pre-leased (Figure 3). Toronto, Southwestern Ontario, and Calgary accounted for the majority of the projects in terms of total square feet, at 16.4 million, 7.2 million and 6.1 million, respectively. Industrial cap rates have increased to 6.95% from 5.53% in the previous quarter, mainly due to elevated interest rates and higher borrowing costs. However, investors continued to be optimistic about the industrial sector, supported by strong underlying economic and demographic fundamentals. Furthermore, despite these challenging market conditions, market conditions remained tight and new supply continued to be delivered in the market at a steady pace.
Author

Jennifer Nhieu
Senior Research Analyst
Author
Jennifer Nhieu
Senior Research Analyst
Resources
Latest insights