Canadian CRE investment trends
Q2 2023: Rising interest rates and inflation during the first half of 2023 prompt investors to remain cautious with their investment decisions.

Key highlights
Investment transaction activity remained slow for the first half of 2023
The demand for single-tenant industrial and suburban multiple unit residential remains stable amidst rising cap rates and decreasing availability rates
For three consecutive quarters, the top three preferred markets for investors across all asset classes were Toronto, Ottawa, and Vancouver, respectively, with Ottawa overtaking Toronto in Q2 2023
The top three preferred property types by investors in the second quarter of 2023 were suburban multiple unit residential, food anchored retail strip and single tenant industrial assets, respectively
Q2 2023 investment transaction activity favoured residential and industrial real estate
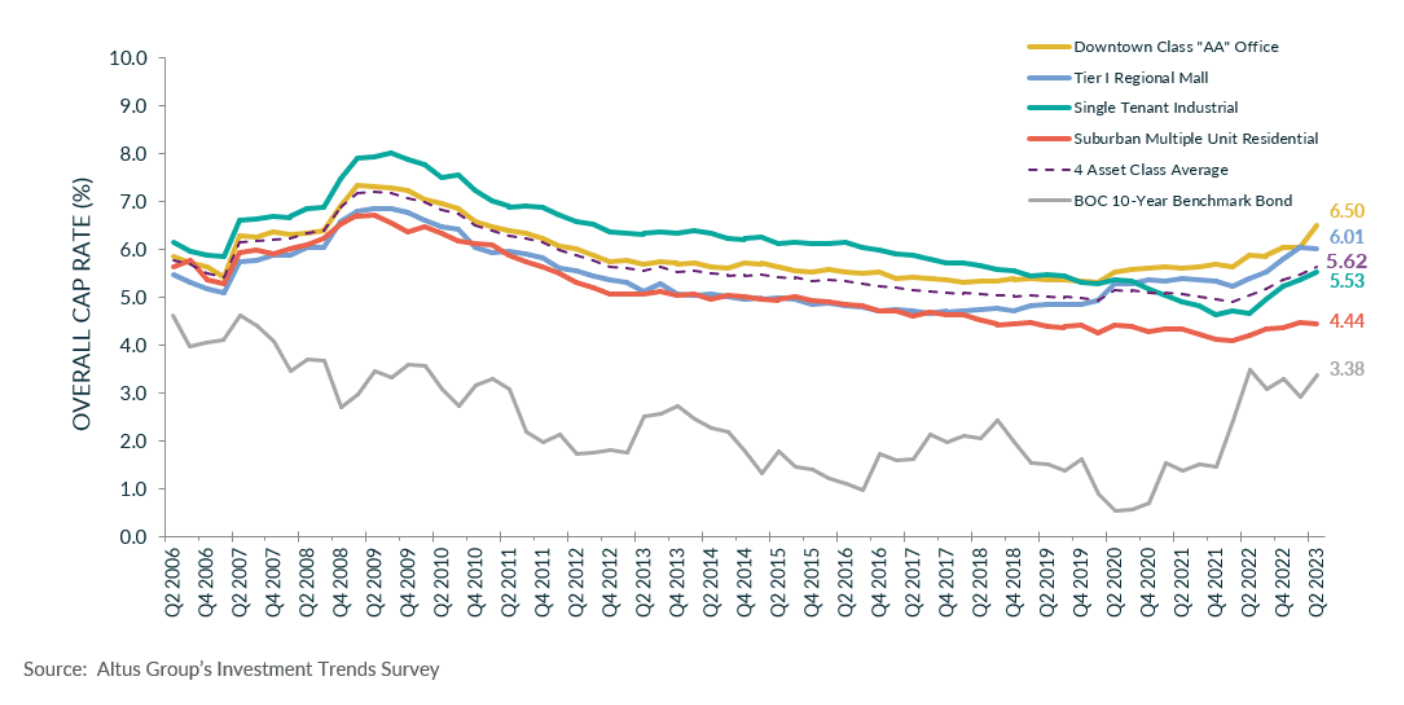
The latest results from Altus Group’s Canadian Investment Trends Survey (ITS) for the four benchmark asset classes reveal that the Overall Capitalization Rate (OCR) rose to 5.62% in Q2 2023 compared to the previous quarter at 5.47% (Figure 1). With rising interest rates and inflation, investment transaction activity remained slow for the first half of 2023 as investors continued to be cautious with their investment decisions.
According to Statistics Canada, the labour market remained unchanged for the most part. As of May 2023, employment decreased slightly by 17,000 (-0.1%). Youth-aged employment fell by 77,000 (-2.8%), while it increased by 63,000 (0.5%) for people aged 25 to 54. Moreover, gains in employment were noted in manufacturing, utilities, and other services (i.e., personal care, repair, and maintenance). While these industries saw gains, losses in employment were noted in business, building and other support service sectors.
The Bank of Canada bond rate, as of June 30th, 2023, was recorded at 3.22%, increasing by 29 bps since Q1 2023. As the Bank of Canada focuses on inflationary control measures, the average OCR rates in single-tenant industrial and suburban multiple unit residential continued to increase quarter-over-quarter. The demand for these two asset classes remains stable amidst rising cap rates and decreasing availability rates.
Figure 1 - National markets - OCR trends for four benchmark asset classes
Commercial investment activity
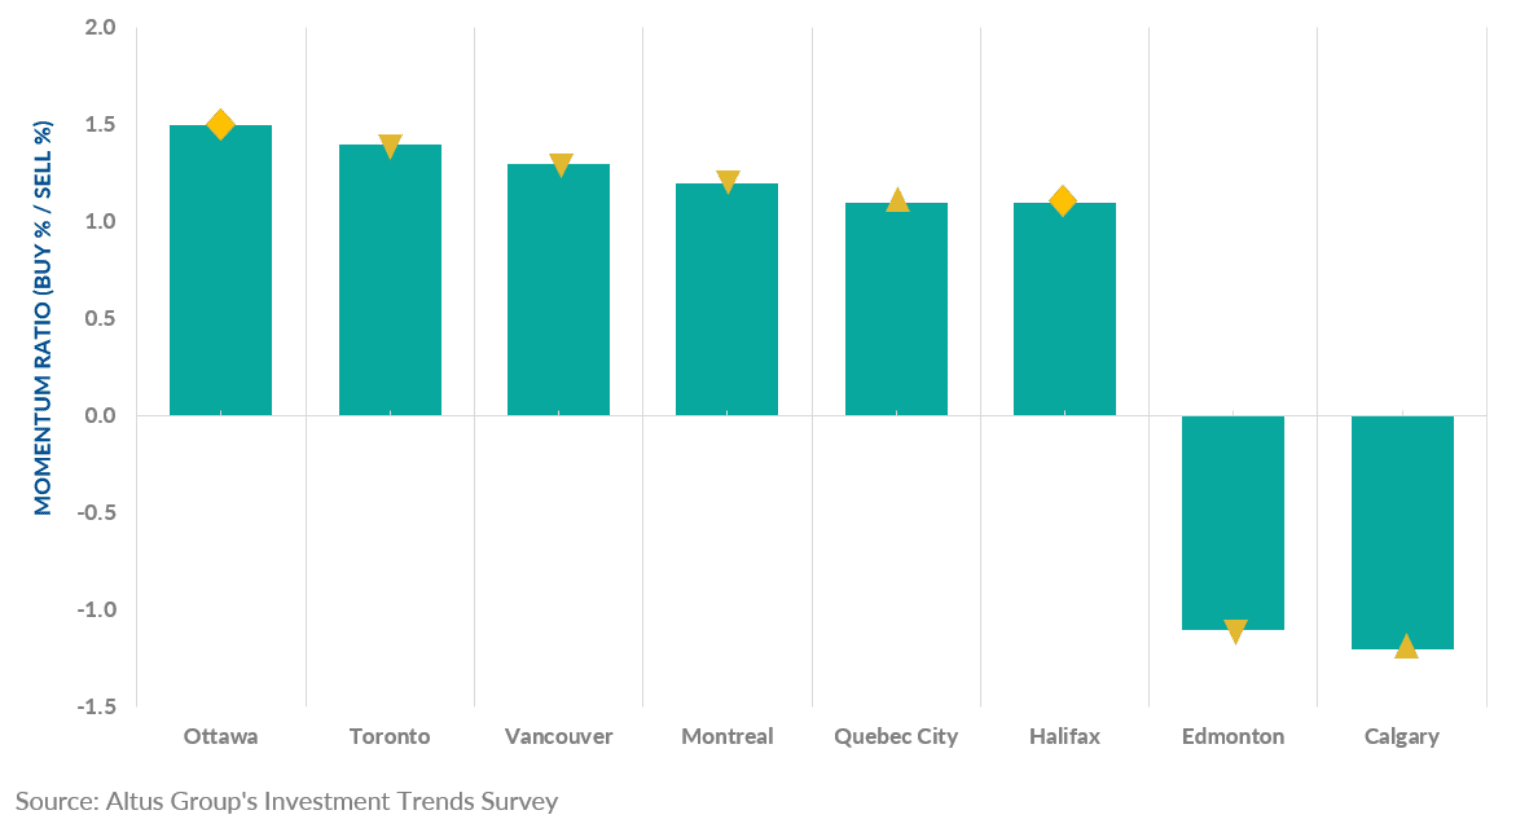
For three consecutive quarters, the top three preferred markets for investors across all asset classes were Toronto, Ottawa, and Vancouver, respectively, with Ottawa overtaking Toronto in Q2 2023 (Figure 2).
The location barometer reported a downward trend in the momentum ratio (percentage of investors looking to buy/percentage of investors looking to sell) across most markets compared to the previous quarter. However, Ottawa – the most preferred location – bucked the trend with a positive momentum ratio which was unchanged from the previous quarter.
The next three most preferred markets, representing Canada’s largest cities, have begun to slow but maintained a positive momentum ratio, indicating that more investors prefer to buy versus sell in these markets.
Figure 2 - Location barometer - All available products (Q2 2023)
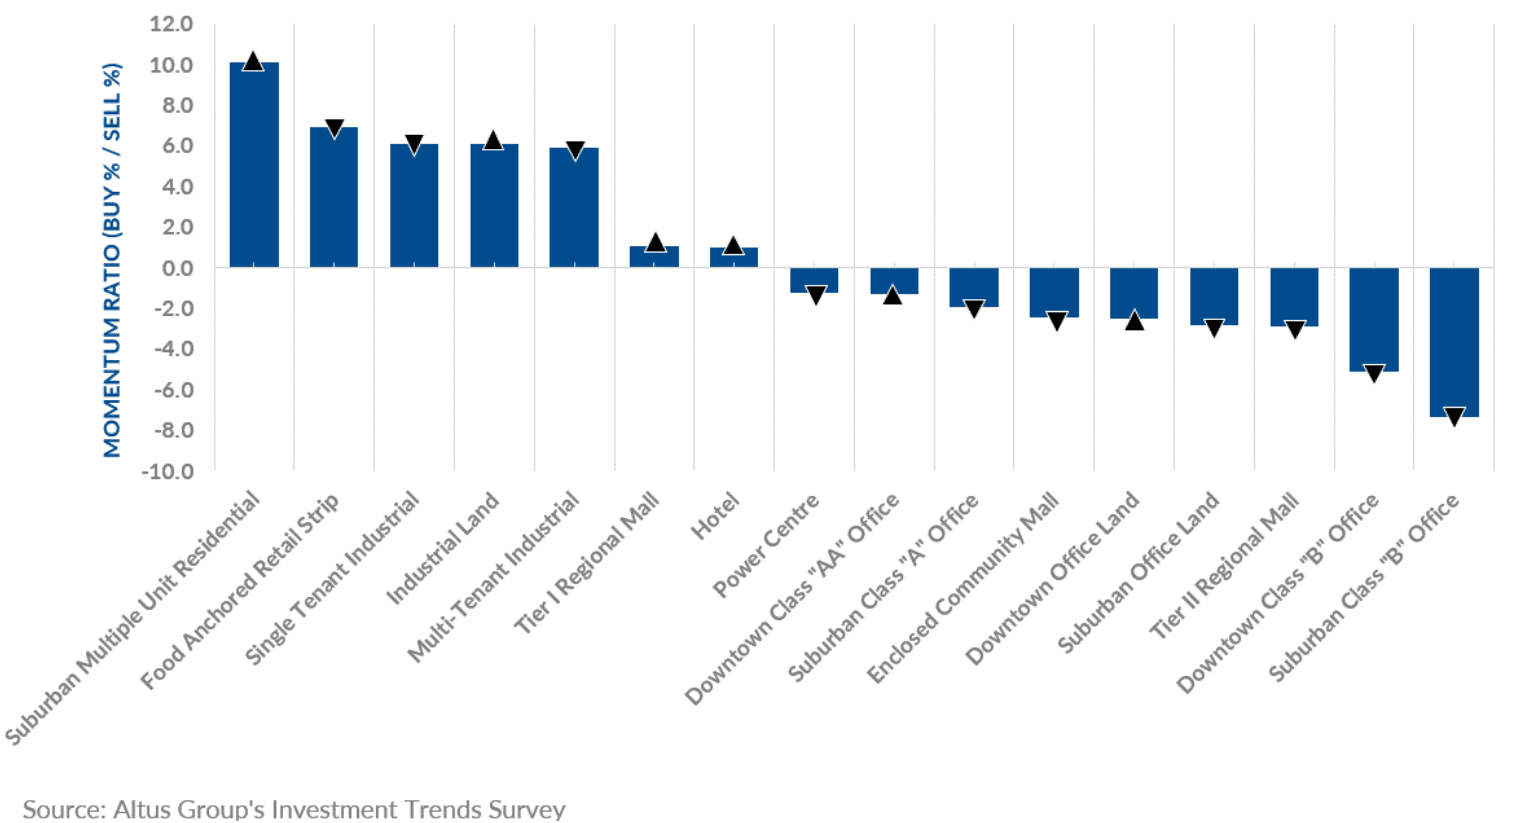
The top three preferred property types by investors in the second quarter of 2023 were suburban multiple unit residential, food anchored retail strip and single tenant industrial assets, respectively (Figure 3). The most favoured asset reported an upturn in its momentum ratio, while the other assets reported a downturn. Interestingly, suburban multiple unit residential reported a significant increase in its momentum ratio. Additionally, food anchored retail strip has remained in the top three despite the momentum ratio falling in each of the past three quarters. Moreover, all office-type assets had a negative momentum ratio with continued concerns around rising availability rates.
Figure 3 - Property type barometer - All available products (Q2 2023)
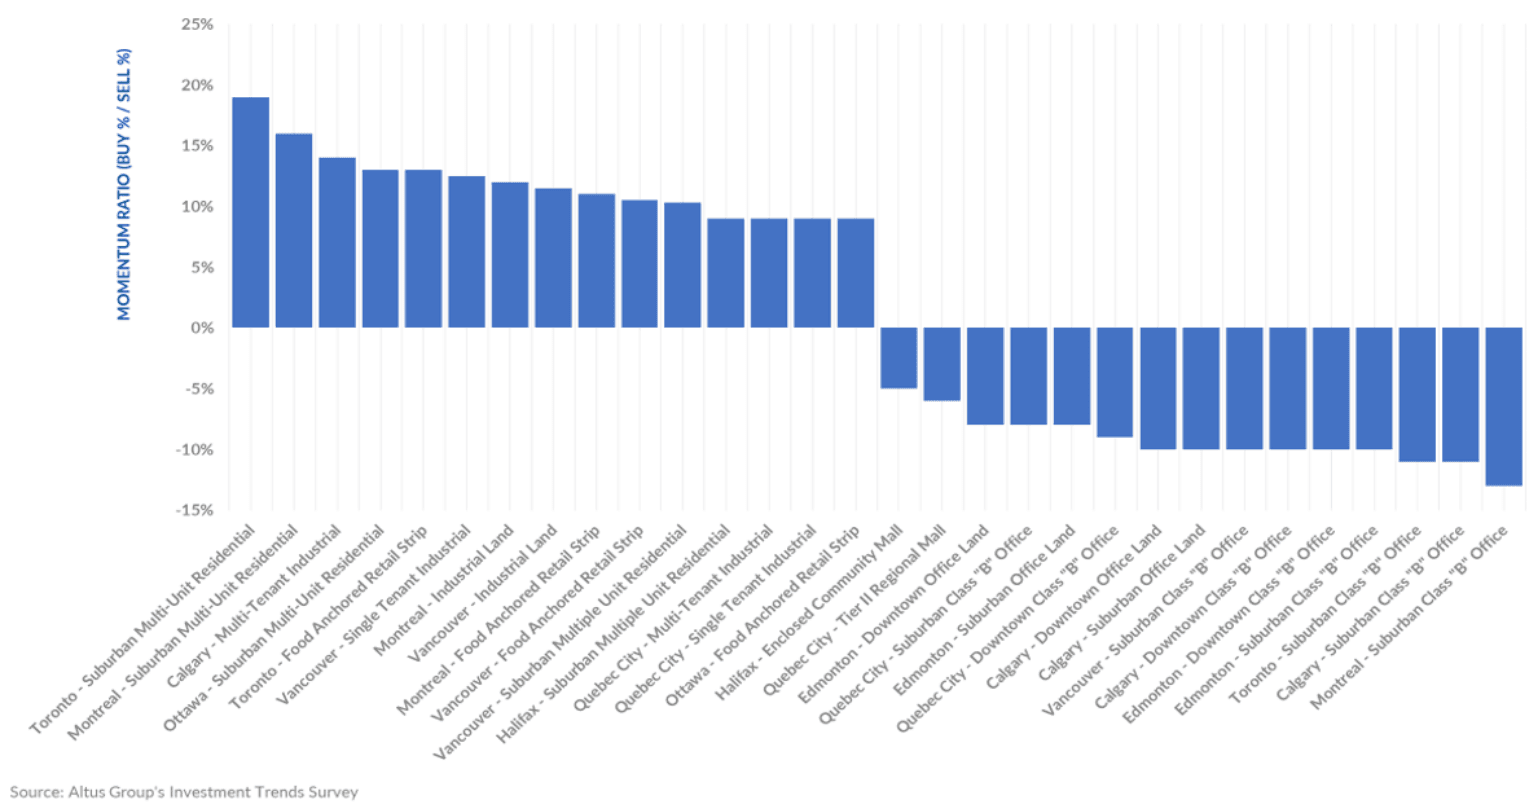
According to the product/market barometer, the top three preferred combinations (Figure 4) were suburban multiple unit residential in Toronto and Montreal and multi-tenant industrial in Calgary. The 13 least preferred combinations all revolve around the office asset – from office land in Calgary and Edmonton to Suburban and Downtown class “B” office buildings around the country. Macroeconomic headwinds have led investors to invest in assets with minimal risk and stable returns; therefore, investment transaction activity favoured residential and industrial real estate.
Figure 4 - Product/Market barometer - All available products (Q2 2023) – Top 15 preferred/least preferred
Market highlights for the quarter
Cap rates for suburban multiple unit residential decreased slightly to 4.44%. The suburban multiple-unit residential cap rate remains virtually unchanged, decreasing by 0.02% from 4.46% in Q1 2023. Vancouver quarter-over-quarter experienced an increase to 4.0%, while Toronto decreased to 3.8%.
Demand for industrial assets continues to outweigh supply. Cap rates for single-tenant industrial increased to 5.53%. Cap rates across all markets apart from Quebec City experienced an increase quarter-over-quarter. As supply remains constricted, rising interest rates and high construction costs have led investors to be more cautious.
Downtown class “AA” office cap rates increase from the previous quarter to 6.50% as of Q2 2023. The national office availability rate increased by 0.4% from the previous quarter to 17.6%. This also marks the second consecutive quarter of negative net absorption. All markets experienced an increase in cap rates quarter-over-quarter.
Tier 1 regional mall cap rates increased slightly to 6.01%. Cap rates were mixed across the major markets – Vancouver, Edmonton, Ottawa, and Montreal experienced upward pressure. At the same time, compression occurred in Calgary and Quebec City, and Toronto experienced no change.
Barometer highlights
Of the 128 combinations of products and markets covered in the Investment Trends survey:
55 had a “positive” momentum ratio (i.e., a higher percentage of respondents said they were more likely to be a buyer than a seller in that particular segment), a decrease compared to 59 in Q1 2023; and 73 had a “negative” momentum ratio, an increase from 69 in the previous quarter.
The top 15 products/markets which showed the most positive momentum were:
Vancouver: Single tenant industrial, industrial land, food-anchored retail strip and suburban multiple unit residential
Calgary: Multi-tenant industrial
Toronto: Suburban multiple unit residential and food-anchored retail strip
Ottawa: Suburban multiple unit residential and food-anchored retail strip
Montreal: Suburban multiple unit residential, industrial land and food-anchored retail strip
Quebec City: Multi-tenant and single-tenant industrial
Halifax: Suburban multiple unit residential
Authors

Ray Wong
Vice President, Data Solutions

Jennifer Nhieu
Senior Research Analyst
Authors
Ray Wong
Vice President, Data Solutions
Jennifer Nhieu
Senior Research Analyst
Resources
Latest insights