Parsing the data: Altus Group's Q2 2023 NCREIF ODCE index analysis
Our NCREIF ODCE index analysis reveals the latest market trends and breaks down market results by both sub-property type classification and geography. Click here to read the latest update.

Key highlights
The unlevered commercial real estate total return declined 1.9% in Q2 2023, marking the third consecutive quarter-on-quarter decline
The return variance between the top-performing property sector (industrial, 0.2%) and the bottom-performing sector (office, -7.3%) widened to 750 basis points (bps)
The return variance between these sectors is up from 550 bps in Q2 2022, and demonstrates the increasing disparity in returns across property types and markets
The largest property sector return declines for the quarter were all in markets west of the Mississippi River
The NCREIF ODCE index is one of the most referenced commercial real estate price indexes in the market.
Each quarter, our performance analytics team and senior advisory leaders identify main themes in the latest market results, provide a breakdown of the most recent quarterly returns, and cover property value variances across the major metropolitan markets.
Through the second quarter of 2023, unleveraged commercial real estate (CRE) declined 1.9% compared to the first quarter. The quarterly decline was more moderate than the declines experienced in the two preceding quarters, but marked the third consecutive quarter-on-quarter decline.
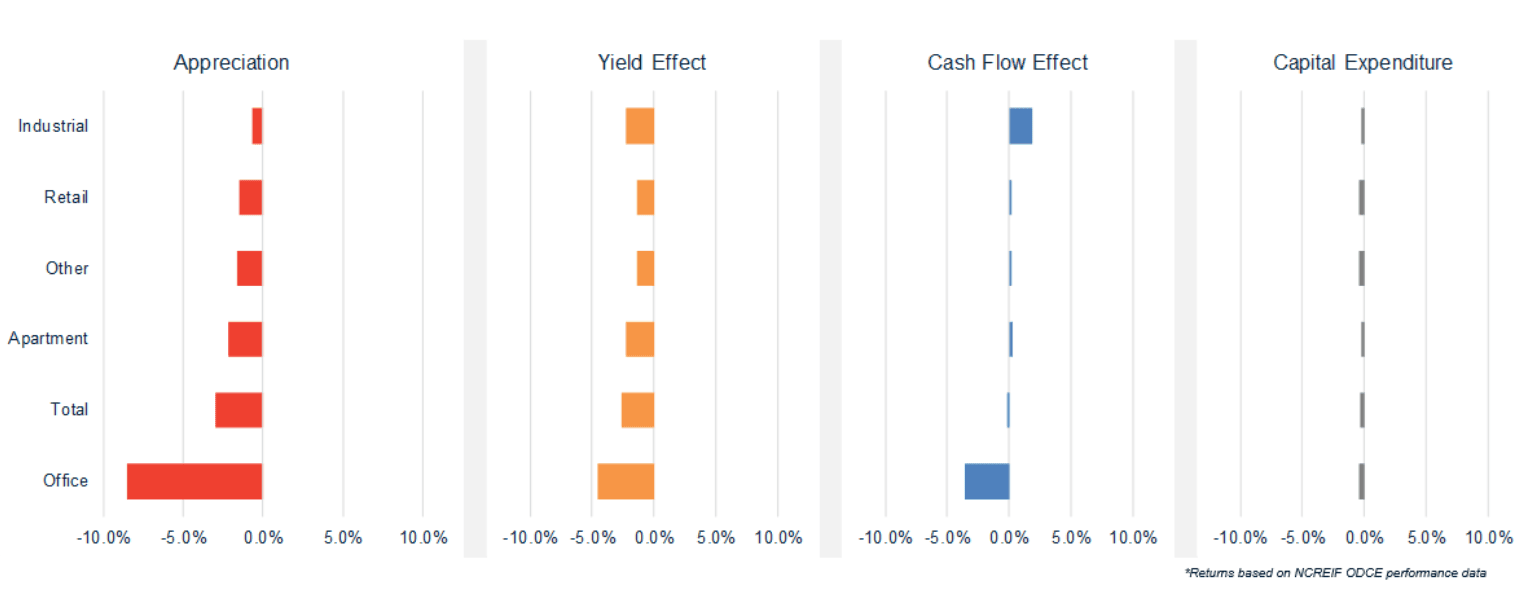
Dissecting the total return, property cash flows for the quarter were positive for all property types except office, but the cash flow effect was not enough to offset the negative appreciation effect. While there was variation by property type and geography, the higher cost of capital and market expectation for “higher rates for longer” continued to push cap rates up, which lead to negative appreciation effect across all property types.
Figure 1 - Headline returns – Quarterly to Q2 2023
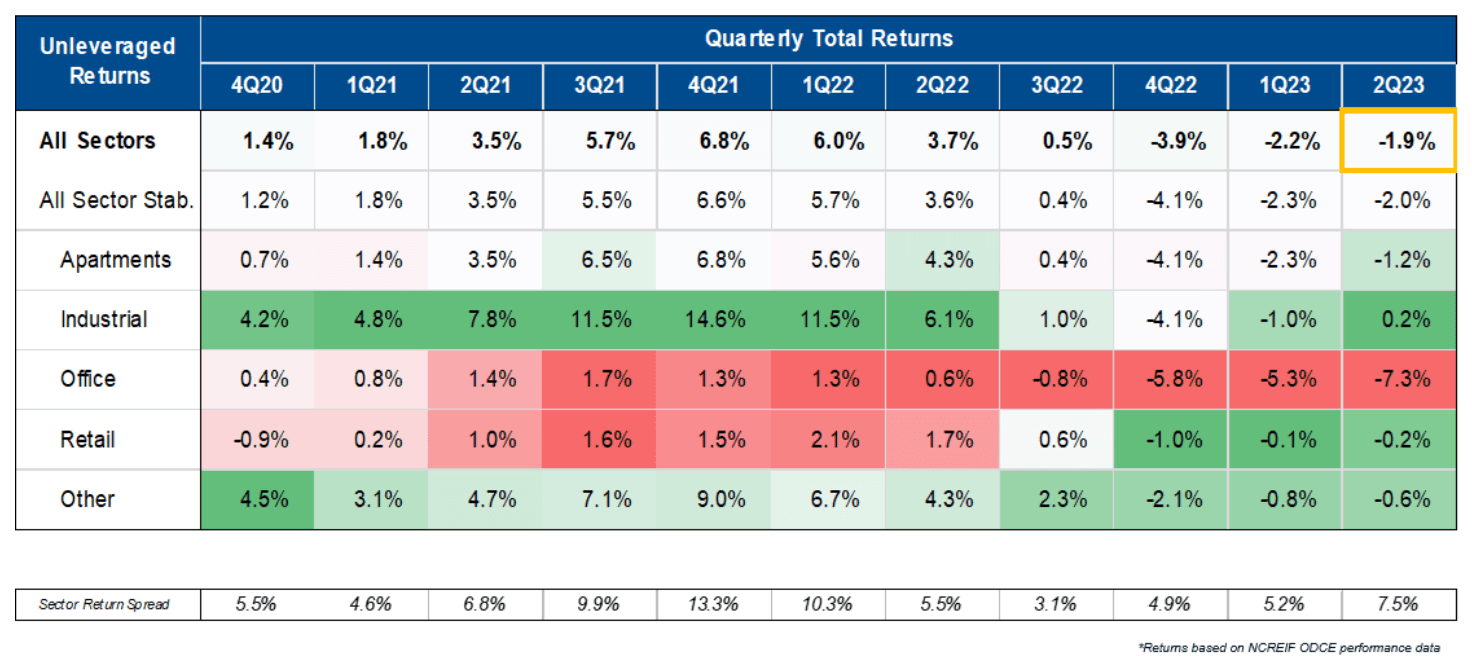
One-size fits none
Despite all CRE property types being negatively impacted by the higher rate environment, the quarterly total return variance between the top performing type (industrial, 0.2%) and the bottom performing type (office, -7.3%) widened to 750 bps. This variance is up from the 520 bps in Q1 2023 and 550 bps in Q2 2022, which demonstrates the growing dispersion of returns by property types and markets.
Figure 2 - Yield and cash flow effect – Q1 2023 to Q2 2023
Industrial: After two consecutive quarters of negative returns, the industrial sector posted a positive return of 0.2% in Q2 2023. While a much smaller return than its 14.6% return in Q4 2021 (and below the 6.1% quarterly return one year ago), the modest 20 bps total return earned the industrial sector the top-rank for CRE property types in Q2 2023. In terms of repricing, the industrial sector appears to be finding solid ground, as cash flows see positive quarterly growth, driven by strong demand across most markets
Multifamily: Similar to industrial, the multifamily sector experienced moderating returns in the second quarter, albeit negative – the quarterly total return for the sector was -1.2%. However, unlike the industrial sector, multifamily returns did not benefit from a positive cash flow effect. Rents for multifamily have seemingly come to a standstill, meanwhile operating expenses continue to grow
Office: The sector is still suffering from heightened uncertainty surrounding demand, with some employers scaling back amidst recessionary concerns and longer-term return-to-office trends. The office sector was, again, the worst performing in Q2 2023, with an overall return falling 7.3% - the only sector to fall below the “All Sector” quarterly return of -1.9%. The sector also experienced a negative cash flow effect on its return, driven by lower market rent growth, increased operating costs and concessions, and a significant rise in budgeted capital costs. While owners seek to invest more into offices to ensure they remain competitive, the recent trend has increased the capital intensity of owning office, which is eating into returns
Retail: The retail sector posted a quarterly total return of -0.2%, a moderate decline from -0.1% in Q1 2023 and notably down from 1.7% return in Q2 one year prior. While the sector did not see a significant quarter-on-quarter change, the modest decline put it as second-best performing, behind industrial for the quarter. The sector’s negative yield effect, which drove price depreciation, cancelled out the minor gains the sector saw in terms of cash flow effect
Get the latest valuation benchmarks by market and asset class
Join this webinar as we analyze the latest performance results and insights of the NCREIF ODCE index - one of the most referenced commercial real estate price indexes in the market.
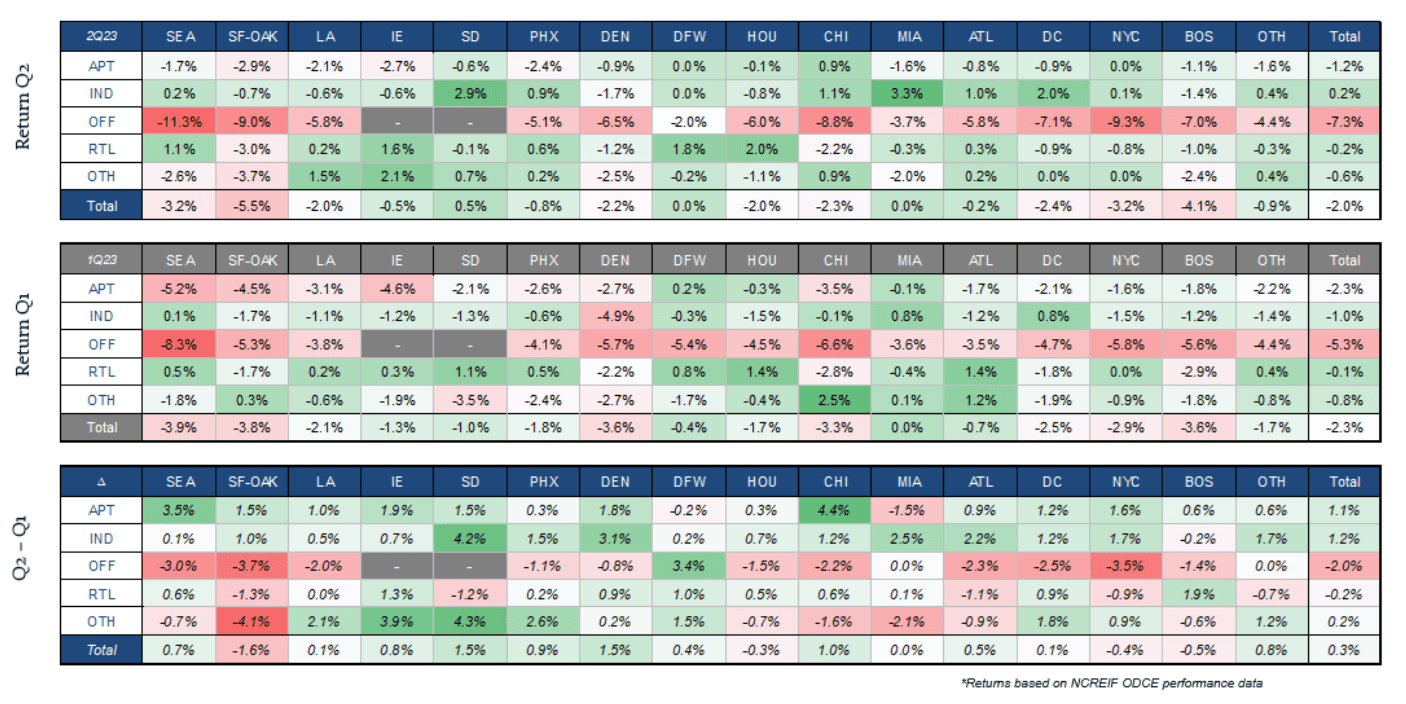
West-coast woes
In addition to the widening variance of returns explained by property sector, the trend of West-coast market underperformance is emerging. Many of the major western markets experienced the largest declines over the second quarter. While East-coast markets, such as Boston and NYC, experienced total all-sector total returns less than the national average in 2Q 2023, the largest declines by sector were seen in CBSAs west of the Mississippi River. Notable large declines in total returns for the quarter included:
Industrial: Denver, -1.7% vs 0.2% nationally
Multifamily: San Francisco-Oakland, -2.9% vs -1.2% nationally
Office: Seattle, -11.3% vs -7.3% nationally
Retail: San Francisco-Oakland, -3.0% vs -0.2% nationally
Figure 3 - Sector CBSA – Total Q2 return and quarterly difference
Authors

Omar Eltorai
Senior Director of Research, Altus Group

Robby Tandjung
Executive Vice President, Valuation Advisory

Phil Tily
Senior Vice President, Performance Analytics
Authors
Omar Eltorai
Senior Director of Research, Altus Group
Robby Tandjung
Executive Vice President, Valuation Advisory
Phil Tily
Senior Vice President, Performance Analytics
Resources
Latest insights