Parsing the data: Altus Group’s Q1 2024 NCREIF ODCE index analysis
Our Q1 2024 NCREIF ODCE index analysis reveals the latest market trends and breaks down market results by both sub-property type classification and geography.

Key highlights
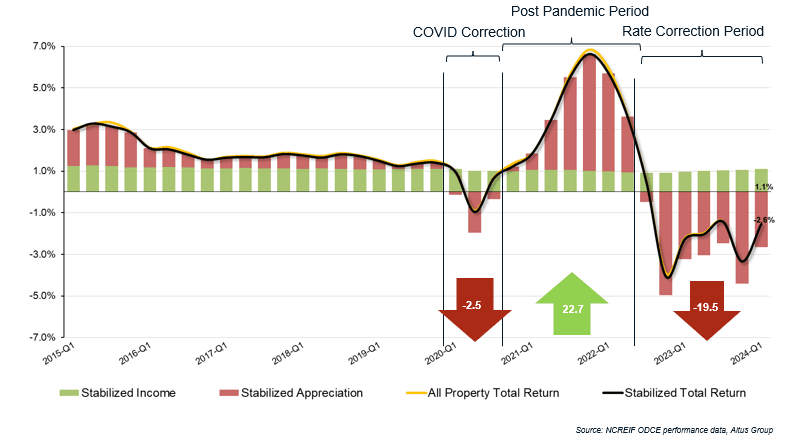
Unleveraged total returns for commercial real estate (CRE) declined 1.5% in Q1 2024 over Q4 2023, the sixth consecutive quarter of negative returns
Declining values, negative appreciation, accounted for the majority of this overall quarterly return decline. Appreciation return was -2.6%, more than offsetting the +1.1% income return
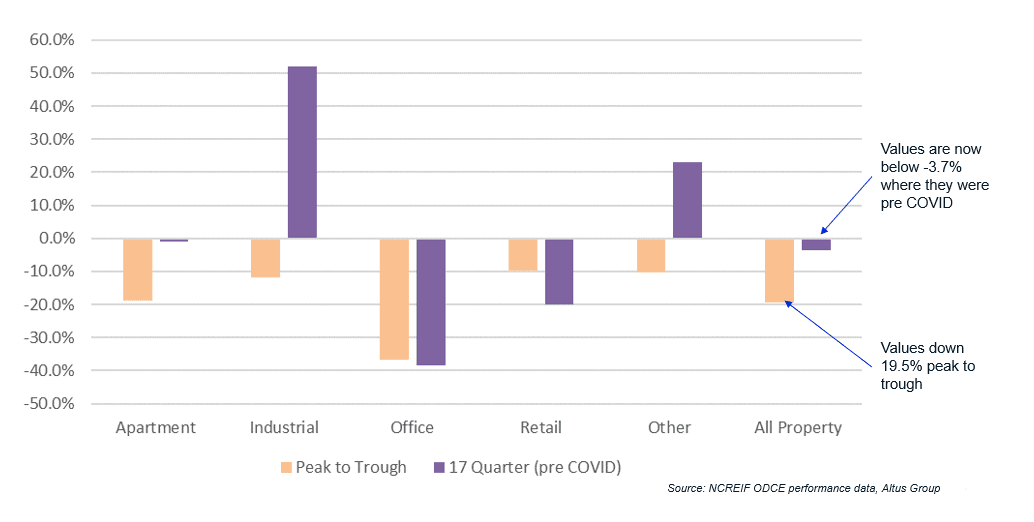
Q1 2024 values across all the property sectors are 19.5% lower than their recent post-pandemic peaks and currently sit 3.7% below their pre-pandemic levels
The NCREIF ODCE index is one of the most referenced commercial real estate price indexes in the market.
Each quarter, our performance analytics team and senior advisory leaders identify main themes in the latest market results, provide a breakdown of the most recent quarterly returns, and cover property value variances across the major metropolitan markets.
Through the first quarter of 2024, unleveraged commercial real estate (CRE) declined 1.5% compared to the fourth quarter of 2023
The Q1 2024 decline marked the sixth consecutive quarter of negative returns, although this quarterly decline was less severe than the prior quarterly decline, suggesting that these quarterly declines may be moderating. The CRE asset class declined by 8.1% since Q1 2023 and 13.6% when compared to the Q3 2022 peak.
The primary driver of the consecutive negative quarterly returns continues to be negative appreciation – declining valuations. The Q1 2024 results marked the seventh consecutive quarter of negative appreciation. Since turning negative in Q3 2022, property values across all sectors have declined by 19.5%. This valuation change nearly reverses +22.7% of valuation increases that followed in the low-interest rate post-pandemic period (illustrated in the chart below).
Figure 1 - All property quarterly returns
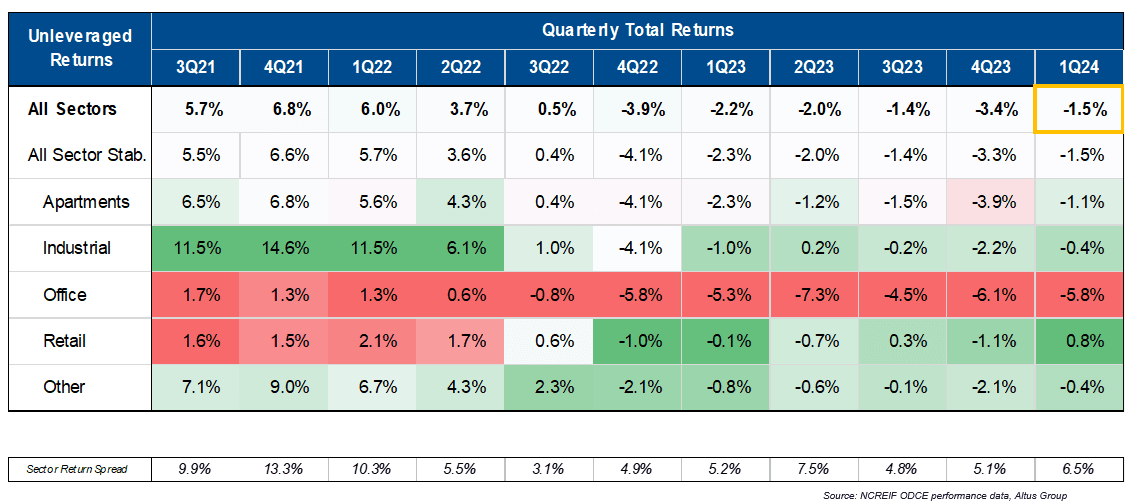
Retail was the only major property sector that did not record a negative total return in the first quarter, with an unlevered quarterly total return of 0.8%. The second best Q1 2024 quarterly total return was shared by the industrial and other (predominantly self-storage) sectors, which both had headline total returns of -0.4%.
Apartments notched a -1.1% quarterly total return, and the worst-off sector was office, which recorded a -5.8% quarterly total return. The spread between best and worst performing sectors increased to 6.5 percentage points, up from 5.1 percentage points last quarter.
Figure 2 - Headline returns – Quarterly to Q1 2024
Diving into the declining values
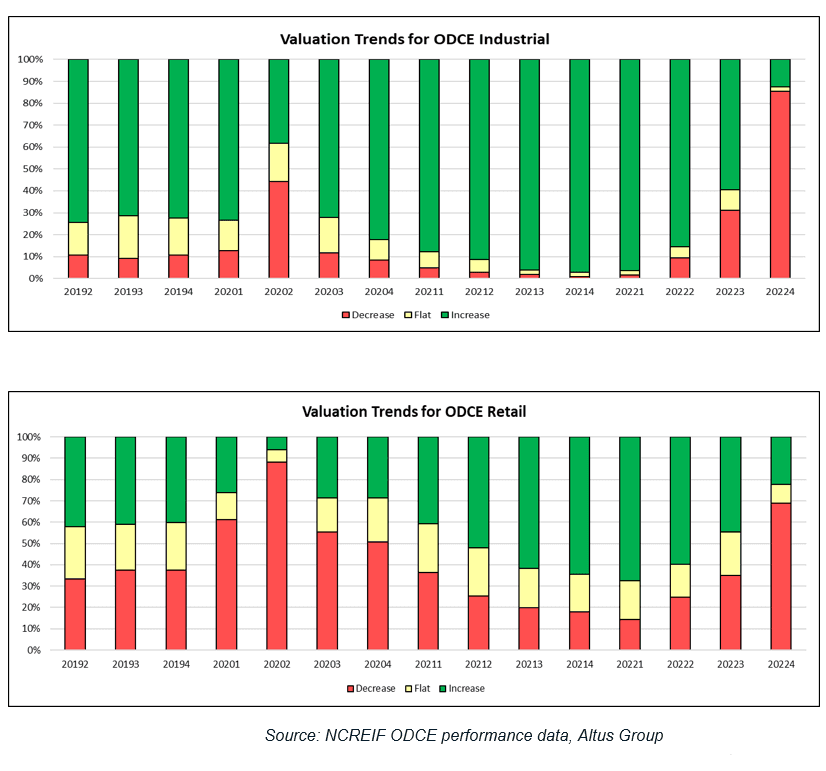
Even though the total returns across the different sectors varied widely, the negative appreciation impact was the primary driver of the overall negative quarterly total returns across all sectors. For the first time since Q2 2020, the majority of properties in all of the four major property sectors in the NCREIF ODCE index experienced value declines during the quarter. This was most pronounced in the office sector, however, nearly 70% or more of the properties in the industrial, retail, and apartment sectors also experienced quarterly value reductions.
Figure 3 - Valuation trends: Apartments and Offices
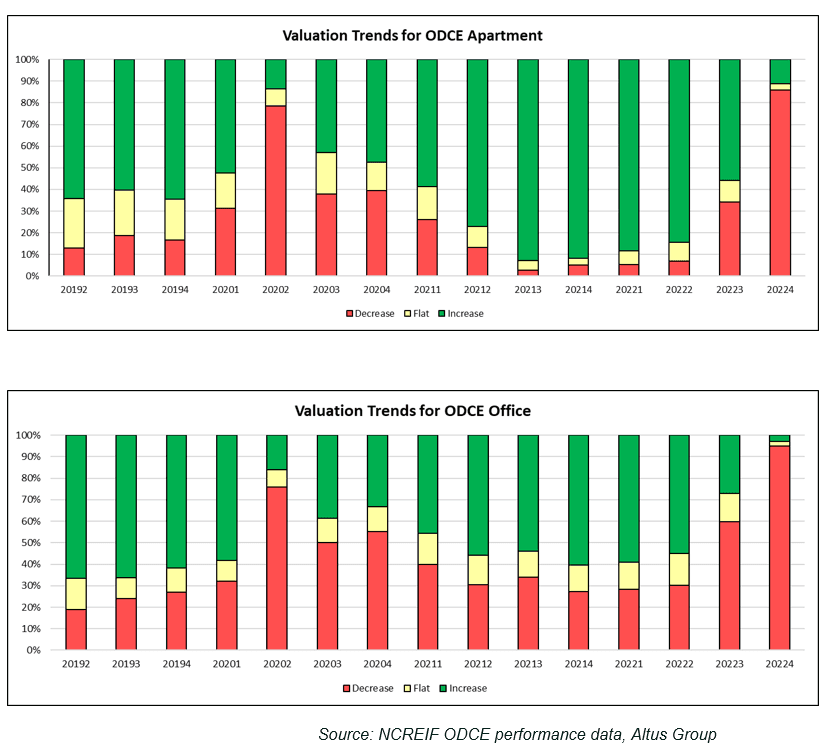
Figure 4 - Valuation trends: Apartments and Office
Get the latest valuation benchmarks by market and asset class
Join this webinar as we analyze the latest performance results and insights of the NCREIF ODCE index - one of the most referenced commercial real estate price indexes in the market.
Putting the recent valuations into context, the current values are 19.5% lower than their recent post-pandemic peaks and currently sit 3.7% below their pre-pandemic levels. However, this varies significantly across property sectors. Over one third of office value has been written off when compared to pre-pandemic levels or the post-pandemic peak. Retail values have come down about 10% since the post-pandemic peak, and nearly 20% since pre-pandemic levels. The apartment sector has lost nearly a fifth of value compared to the post-pandemic peak, but are just slightly lower than pre-pandemic valuation levels. And finally, the industrial sector, while having lost more than a tenth of value compared to post-pandemic peak valuations, still has valuations that are more than 50% above pre-pandemic valuation levels.
Figure 5 - Appreciation to Q1 2024 (from peak versus pre-pandemic change)
Checking in on cash flows
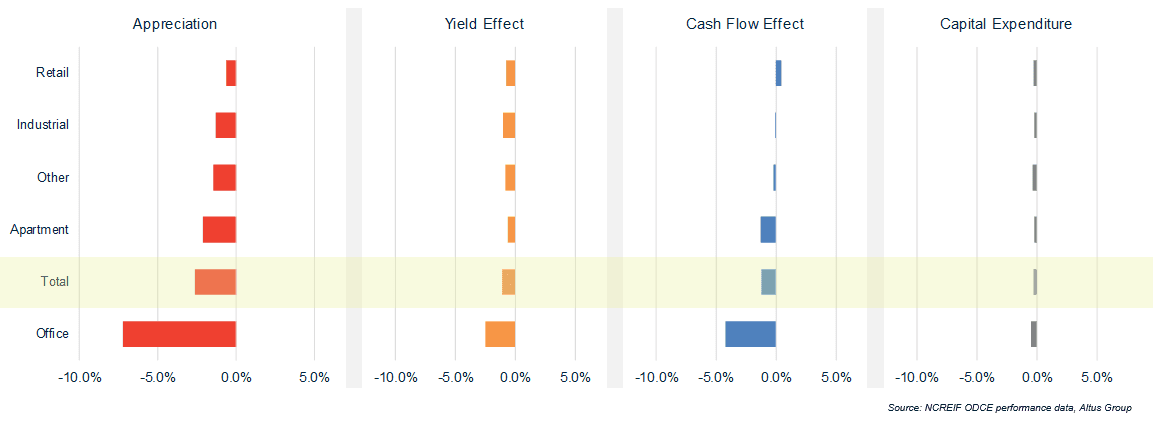
The overall negative appreciation is being driven by both the yield effect and cash flow effect, both of which were negative in Q1 2024. Through the first quarter of 2024, the yield effect remained negative as uncertainty around the forward path interest rates continued to weigh heavily on investors and slow transaction activity, as it has in prior quarters. Compounding the falling appreciation, the cash flow effect was negative for all but the retail sector in Q1 2024, and was most negative for the office and apartment sectors.
Figure 6 - Yield and cash flow effect – Q4 2023 to Q1 2024
When will the market turn and returns turn positive?
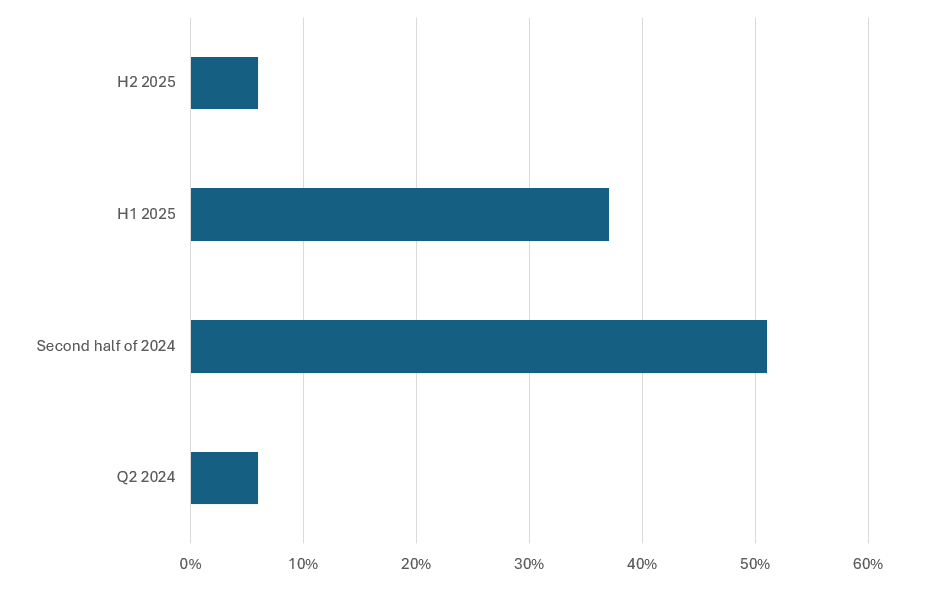
“The market is still very much on a downward trajectory,” Phil Tily, Senior Vice President at Altus, said on the recent Valuation and Performance Trends Analysis of the NCREIF ODCE Index webinar. The majority of attendees on the call agreed with this sentiment, as their responses to a poll indicated 51% expecting values to bottom out in the second half of 2024 and another 37% anticipating the trough to be reached in the first half of 2025.
Figure 7 - NCREIF ODCE webinar poll results – When will value declines reach a bottom trough?
For context and comparison, following the global financial crisis (GFC), there were nine consecutive quarters of negative appreciation and value write-downs, which wiped out nearly a third of all property values. While comparisons to the GFC period seem increasingly more appropriate in many ways, including magnitude and duration of declines, still the comparison is complicated by the clear differences between the broader economic environments surrounding the GFC and at present.
Want to be notified of our new and relevant CRE content, articles and events?
Author

Omar Eltorai
Senior Director of Research, Altus Group
Author
Omar Eltorai
Senior Director of Research, Altus Group
Resources
Latest insights