Maximizing single-family rental returns with data-driven NOI insights
Discover how advanced analytics uncover key NOI drivers and boost returns in single-family rental investments across US markets.

Key highlights
Single-family rentals (SFRs) have emerged as an attractive alternative asset class with strong fundamentals, especially across markets where affordability challenges persist
SFRs have historically been difficult to value when compared to traditional multifamily or commercial assets; however, this complexity can be tamed with the help of advanced analytics
To pull back the curtain on the factors that influence SFR rent levels, Sally Johnstone, Senior Manager, Offer Delivery at Altus Group, combined anonymized performance and physical characteristic data on 21,000 SFR properties with macroeconomic and demographic data
Macroeconomic factors (local GDP growth, household formation) drive ~40% of county-level NOI variance — while neighborhood dynamics (income, density) add another 15%
School quality scores have a mixed but overall weak relationship with NOI (accounting for ~1%), illustrating the complex and localized nature of school districts and the fact that many renters prioritize affordability and commute times over school rankings
From niche to mainstream: The continued rise of single-family rentals
Traditionally, multifamily assets have been a darling of real estate investors, offering economies of scale, operational efficiency, and attractive rental yields. Yet as portfolio diversification becomes ever more critical to long-term success, single-family rentals (SFRs) have emerged as an attractive alternative asset class that is expected to continue its growth trajectory, especially across markets where affordability challenges persist. In fact, according to IBISWorld’s 2023 “Single-Family Rental Communities in the US” report, the SFR market in the US is estimated at over $480 billion in aggregate value, and has grown at an average annual rate of 9% over the past five years, outpacing many other real estate sectors.
As the second-largest rental housing segment in the US, SFRs are underpinned by increasingly strong fundamentals, making SFRs an excellent way to add diversification with upside potential. “Unlike 5 or 10 years ago, the asset class is no longer under the radar,” notes Troy Sivak, Senior Director, Valuation Advisory at Altus Group. “Most institutional investors are now well aware of the opportunities this sector affords them.”
Are SFRs a practical solution to the homeownership gap?
As a general rule of thumb, residential real estate is viewed as a “safe” investment because people will always need a place to live. But when we consider the constraints (and the subsequent opportunities) presented by the current landscape, the case for SFRs – including both portfolios of detached homes spread across multiple markets (scattered site) and purpose‐built “built‐to‐rent” (BTR) subdivisions – becomes even more undeniable.
As would‐be homeowners across key markets grapple with elevated mortgage rates and rising down‐payment thresholds amidst a backdrop of economic uncertainty and development challenges, professionally managed SFR communities emerge as a practical housing solution. “Unlike multifamily assets, SFRs remain chronically undersupplied, with a 4.5-million home shortfall projected for the next several years,” adds Sivak. “That persistent supply gap, coupled with a 20% to 40% cost premium to own versus rent, has sustained robust rent growth even as other property types flatten out.” SFRs are also favored for appealing to more stable, long-term tenants, which translates to lower turnover and the potential for home price appreciation in suburban or high-growth markets.
“For institutional investors, SFRs offer a compelling diversification opportunity with multiple exit pathways,” shares Sivak. “Portfolios can be sold in bulk to another rental operator, preserving recurring-income characteristics, or disaggregated “retail‐style” to individual owner-occupants at retail‐market prices.”
Taming the complexity of SFRs with data-driven insights
SFRs have historically been difficult to value when compared to traditional multifamily or commercial assets. Since SFRs lack the standardization and scale typically seen in multifamily or office assets, they enter into a category of their own – a unique space between residential and commercial real estate. As you can surely imagine, valuing a portfolio of thousands of single‐family homes scattered across dozens of markets is fundamentally different — and more complex — than underwriting a single multifamily property. At the property level, each home carries its own risk profile: local economic drivers, neighborhood supply dynamics, age and condition of the structure, school‐district quality, recent capital expenditures, and more.
“By projecting income and expenses at the individual property level, we can capture these nuances while assigning a risk rating to each home,” explains Sivak. “This allows us to model projected cash flows under multiple rent‐growth and expense scenarios and assign bespoke discount and cap rates at the individual‐asset level. Based on our client’s needs, we can rapidly roll up the results by Metropolitan Statistical Area (MSA), region, or for the entire portfolio — spotlighting concentration risks, emergent rent‐growth hotspots, and cost‐efficiency opportunities that would be invisible in a more aggregate approach.”
Investors continue to look for an edge, and their use of data is ever evolving. “Our valuations don’t end with delivering the report,” adds Sivak. “Each quarter, we ingest over 300 valuation data points and, using this information, clients can benchmark their income, expense, and valuation assumptions against peer portfolios at the MSA, national, or zip code level. They can also gain insight into the factors impacting outperformance and underperformance, and then evaluate their portfolios.”
Of course, SFRs introduce another important challenge: reconciling income‐based valuations with retail‐market realities. “In today’s cycle, individual home prices have continued to be elevated despite rising interest rates. These prices are too high for institutional buyers, pushing returns below what current capital markets demand,” shares Sivak. “With this in mind, the differences between the retail prices and income-based valuations can be reconciled using a 'sell-out' analysis. This lends necessary context to the differences, so our clients can explain this gap to their investors. It also can flag where that spread creates attractive windows for strategic dispositions.”
Identifying key drivers of net operating income (NOI) for SFRs
In an asset class defined by dispersion and dual‐valuation dynamics, granularity, benchmarking, and ongoing data refinement are the key to making informed, repeatable investment decisions.
To pull back the curtain on the factors that influence SFR rent levels, Sally Johnstone, Senior Manager, Offer Delivery at Altus Group, combined anonymized performance and physical characteristic data on 21,000 SFR properties with macroeconomic and demographic data.
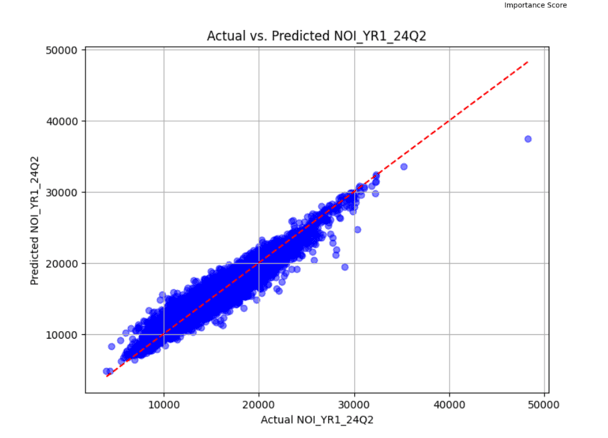
“We used NOI for the trailing four quarters as the target variable in our machine learning model, and about 80% of the variation in the NOI for SFR properties can be explained by the factors we included in our analysis,” notes Johnstone.
Figure 1 - Scatter plot showing actual vs. predicted NOI
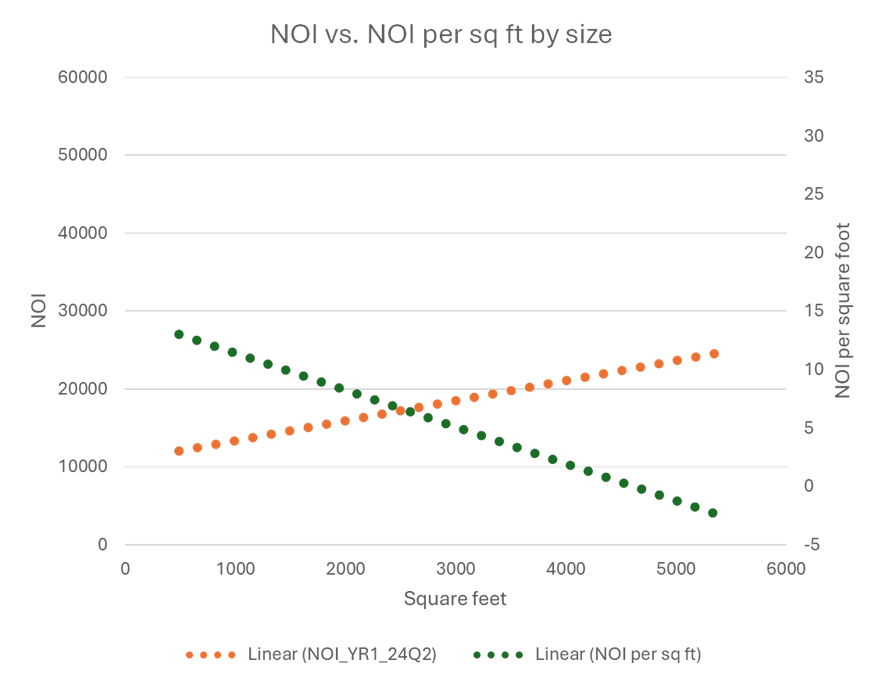
According to Johnstone’s analysis, about 25% of NOI variance can be explained by the physical characteristics of the home. As might be expected, higher square footage tends to result in higher NOI for the home, as larger homes typically command higher rent. “Here’s what stuck out to me – when you compare NOI vs. NOI per square foot, it revealed that bigger is not always better,” Johnstone explains. “NOI per square foot declines as the homes grow larger, which is important to keep in mind for new BTR projects, given the rising cost of construction.”
Figure 2 - NOI vs. NOI per square foot
This finding begs the question – what is the ideal configuration for new BTR homes? To determine this, Johnstone analyzed the movement of NOI compared to the various physical factors of the home. Here’s what she found:
NOI was flat for 1-to-2-bedroom homes, then increased as the number of bedrooms increased from 3 bedrooms to 5 bedrooms, and then flattened again after 5
NOI per square foot steadily declined with more bedrooms
NOI increases sharply from 1 to 2 bathrooms, then levels off for 3 or more bathrooms
NOI per square foot steadily declines as the number of bathrooms in the home increases, and is flat after 2.5 bathrooms
The final verdict? For BTR new construction, the best configuration to balance potential rent versus the cost of construction and achieve higher returns appears to be a home around 2,000 square feet, with three bedrooms and two or two-and-a-half bathrooms.

Access data-powered valuation advisory services
Leverage our market expertise, leading ARGUS technologies, and unique valuation datasets you need to drive asset performance and manage risk.
Exploring the macroeconomic factors impacting SFR NOI
“Macroeconomic conditions at the county or MSA level explain roughly 40% of the variance in SFR NOI,” notes Johnstone. “Areas with strong household growth and robust local Gross Area Product (GAP) expansion — regions that have seen at least 12% GAP growth over the past three years versus the US average of 9.7% — enjoyed the largest NOI gains.”
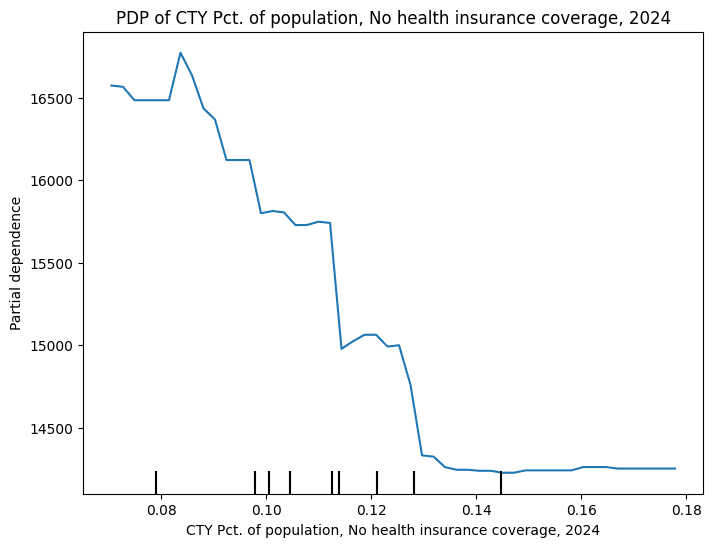
Conversely, higher shares of residents without health insurance have a measurably depressing effect: counties where more than one‐third of adults lack health coverage (34.2% in parts of Texas) see lower NOI compared with markets like Boston, where only 2.6% are uninsured.
Figure 3 - Impact of uninsured adult population on single-family NOI*
“Notably, labor‐force growth — which is often considered a key driver of multifamily rent upsides — accounts for less than 4% of SFR NOI variance,” Johnstone adds. “Instead, SFR performance tracks more closely with labor‐force productivity (GAP per capita) and home-value appreciation relative to local incomes, suggesting that single-family rental returns peak in markets where ownership costs outpace wage growth and force would-be buyers into the rental pool.”
Figure 4 - Impact of labor-force growth on single-family NOI*
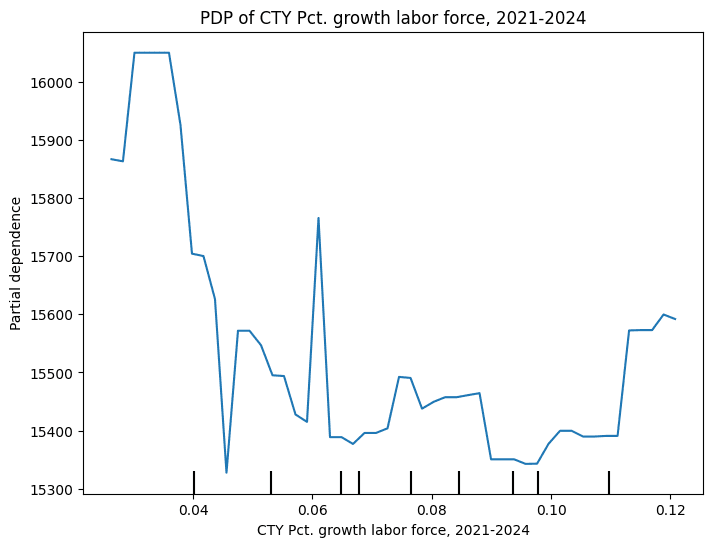
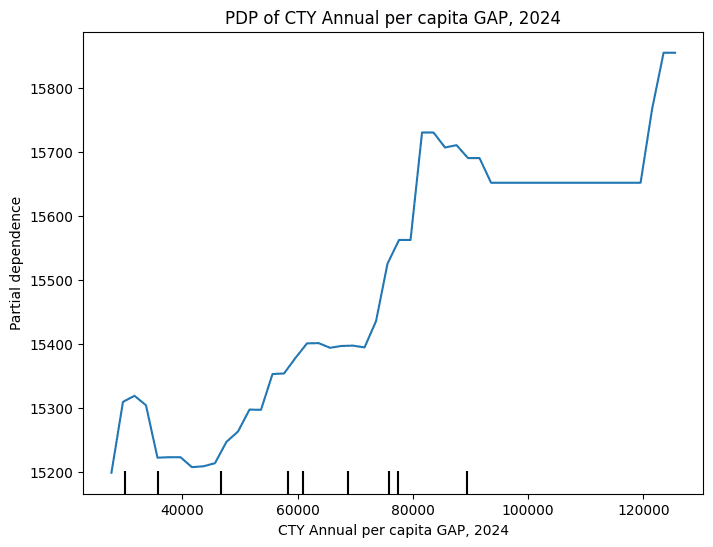
Figure 5 - Impact of labor productivity (measured by growth in GDP per capita) on single-family NOI*
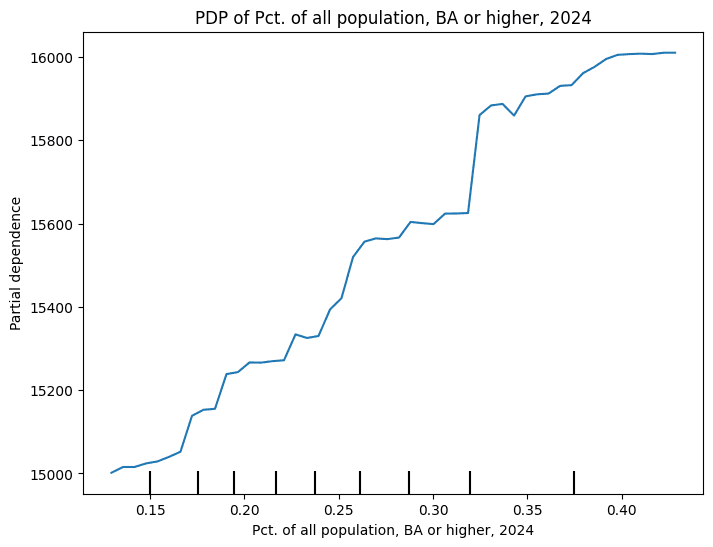
At the neighborhood level (within a one to three-mile radius of each home), another 15% of NOI variation can be attributed to local dynamics. Higher median household incomes, greater population density, and elevated home values all correlate with stronger rents and NOI. “Educational attainment also matters – neighborhoods with larger shares of college‐educated residents tend to support higher rental rates,” Johnstone says.
Figure 6 - Impact of higher median household incomes on single-family NOI*
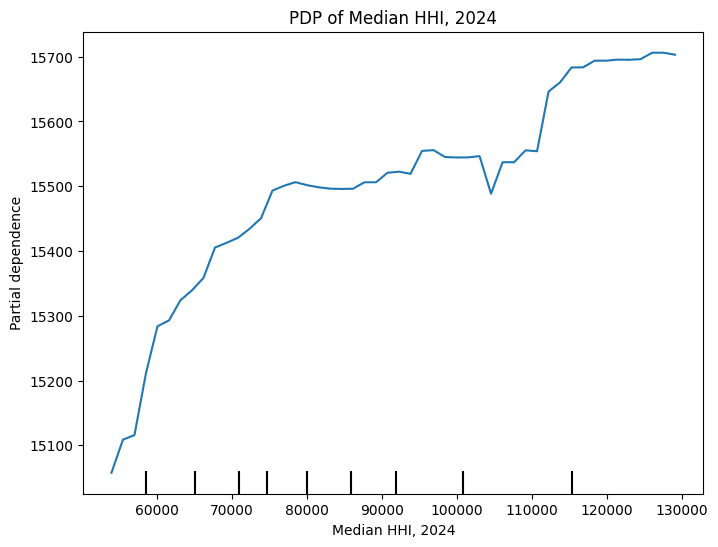
Figure 7 - Impact of educational attainment on single-family NOI*
Why doesn’t school quality matter more for SFR NOI?
If school quality has a significant impact on for-sale home prices, does it have a similar impact on SFR NOI? According to Johnstone’s analysis, the answer is somewhat complicated.
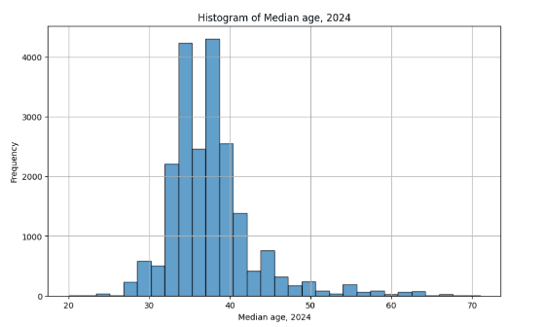
“School quality scores have a mixed but overall weak relationship with NOI (accounting for ~1%), which sheds light on the complex and localized nature of school districts and the fact that many renters prioritize affordability and commute times over school rankings,” Johnstone explains. “We can glean a few different demographic realities from this. First, most of the households that are renting single-family homes are in their thirties and don’t have children, at least not yet. Rentals typically aren’t viewed as a long-term living situation, so school quality is likely not as relevant a consideration for these households.”
Figure 8 - Histogram of median household age for single-family rentals
Around the country, only about 36% of households include children — either as married couples or single parents — and many women are choosing to delay starting their families. In 2022 the Center For Disease Control (CDC) reported that just 55% of women had their first child before age 30 that year, compared to 74% twenty years ago. At the same time, the typical age for college-educated women to have their first child is even older than average, and higher SFR NOI correlates quite strongly with higher levels of educational attainment.
Figure 9 - Histogram of household type for single-family rentals
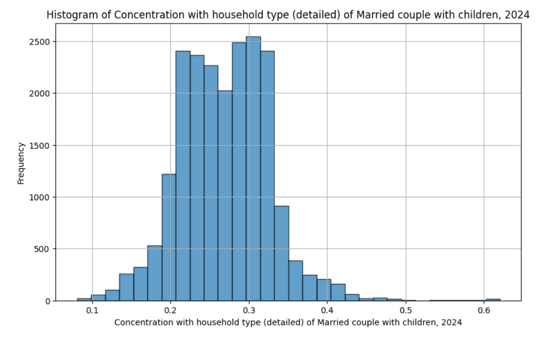
“In other words, the highest rents are commanded in neighborhoods with higher levels of educational attainment, which tends to correlate with a lower proportion of households with children,” explains Johnstone. “Anecdotally, many tenants, particularly in BTR communities, are seeking a single-family detached home to have more room and outdoor space for their pets, rather than for a growing family."
Conclusion
Now more than ever, SFRs stand out as a resilient – yet often under-leveraged – asset class that offers investors diversification and multiple exit pathways. Leveraging Altus Group’s single-family rental intelligence, investors can seamlessly manage scattered SFR portfolios with the same confidence as institutional multifamily, to pinpoint value creation and unlock a new frontier of scalable returns.
*Note: A Partial Dependence Plot (PDP) visualizes the average effect of a single feature on a model’s predictions, while holding all other features constant. This technique answers the question: “If we vary this one feature, how does the model’s prediction change on average?” If the PDP line slopes upward, it indicates that increases in the feature are associated with higher predicted values. A flat line suggests the feature has little influence on the prediction. Non-linear shapes in the plot reflect more complex or interactive effects between features.
Want to be notified of our new and relevant CRE content, articles and events?
Subject matter experts

Sally Johnstone
Senior Manager, Advisory

Troy Sivak
Senior Director, Valuation Advisory
Subject matter experts
Sally Johnstone
Senior Manager, Advisory
Troy Sivak
Senior Director, Valuation Advisory
Resources
Latest insights