Is capital now pushing investors toward older US multifamily vintages?
US multifamily deals in 2025 focus on vintage assets, highlighting how capital access and financing options influence investor decisions.

Key highlights
Office properties changing hands today mirror the broader US office inventory in age, with both largely comprising buildings constructed in the 1980s
However, recently traded multifamily properties are notably older than the overall stock, often dating to the 1960s or earlier, even in markets with generally newer inventory
Transactions skewing to smaller, older multifamily buildings may be a response to the high-cost capital environment, given lower initial equity requirements and access to competitively priced agency financing
The surprising age profile of 2025 transactions
Transaction data from 2025 thus far provides a useful lens into how capital may be responding to current market constraints. Office activity serves as a baseline, with traded assets broadly reflecting the existing inventory. Multifamily, however, shows a distinct departure from that pattern, offering clues as to how liquidity, pricing, and financing factors may be influencing which assets come to market.
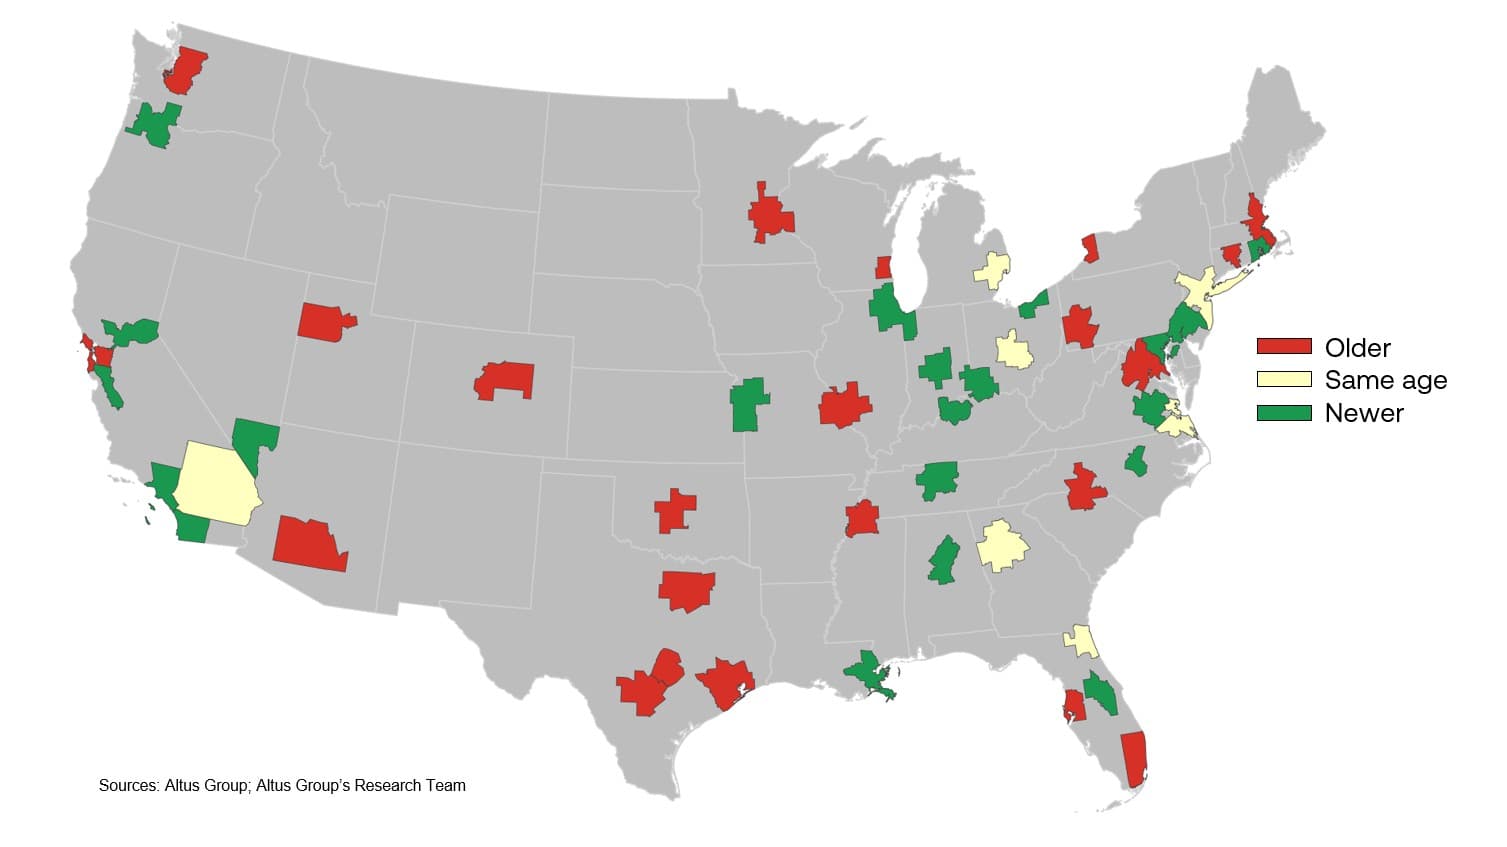
Despite demand headwinds and tighter capital conditions, the age profile of office properties transacting so far in 2025 looks very similar to the existing stock at a national level. The median office building in the US was built in the 1980s, and the median office property traded has also been from the 1980s. Among the 50 largest MSAs, traded office assets were newer than the stock median in 21 metros, older in 22, and the same age in 7. In other words, office buildings transacting in 2025 broadly reflect overall inventory, at least by age of building.
Figure 1: Traded property age (2025 YTD) vs. existing property age (office)
Multifamily, on the other hand, is telling a different story. In a sector that remains highly sought after and has driven a large share of annual volume growth in 2025 thus far (as highlighted in our Q2 2025 US CRE Investments & Transactions Quarterly report), traded properties look less similar to the broader national stock by building age. The typical multifamily property sold in 2025 has been much older, often dating to the 1960s or earlier, even in metros where the inventory is far younger. Why such a skew?
Multifamily construction peaked in the 1960s
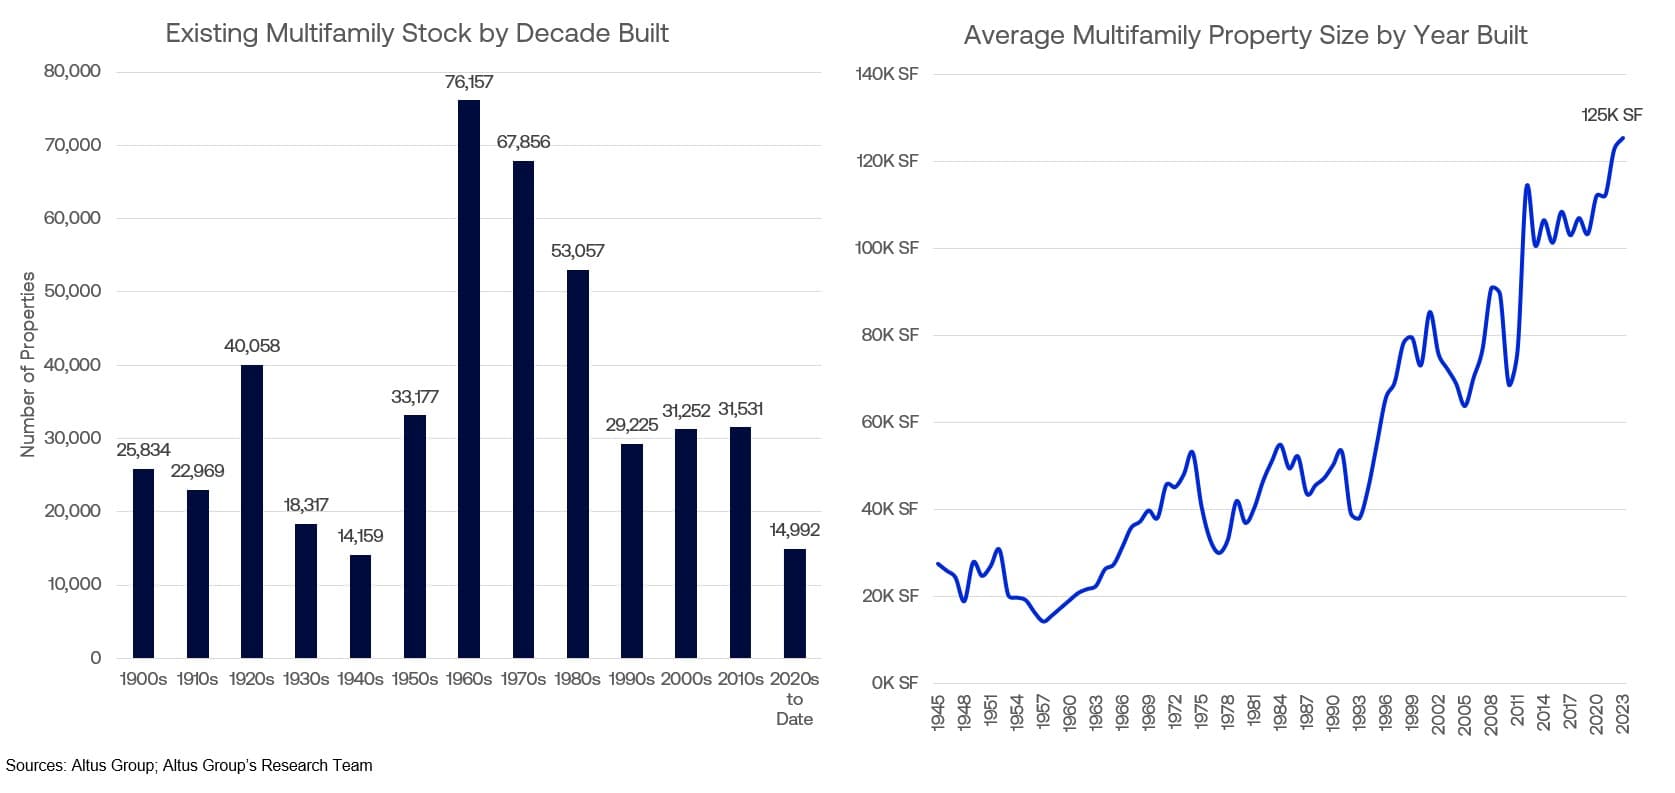
The supply backdrop helps explain why the “typical” multifamily building is quite old. In the 1960s, the US delivered more than 76,000 multifamily properties that still exist today, almost two and a half times as many as in the 2000s or 2010s. But these properties were also much smaller. By the end of the 1960s, the average new building was around 40,000 square feet, compared with nearly 100,000 square feet by the 2010s. Over time, the market shifted from producing many small buildings to fewer, larger ones (i.e. ones that contain more units).
Figure 2: Existing multifamily stock by decade built; Average building size by year built
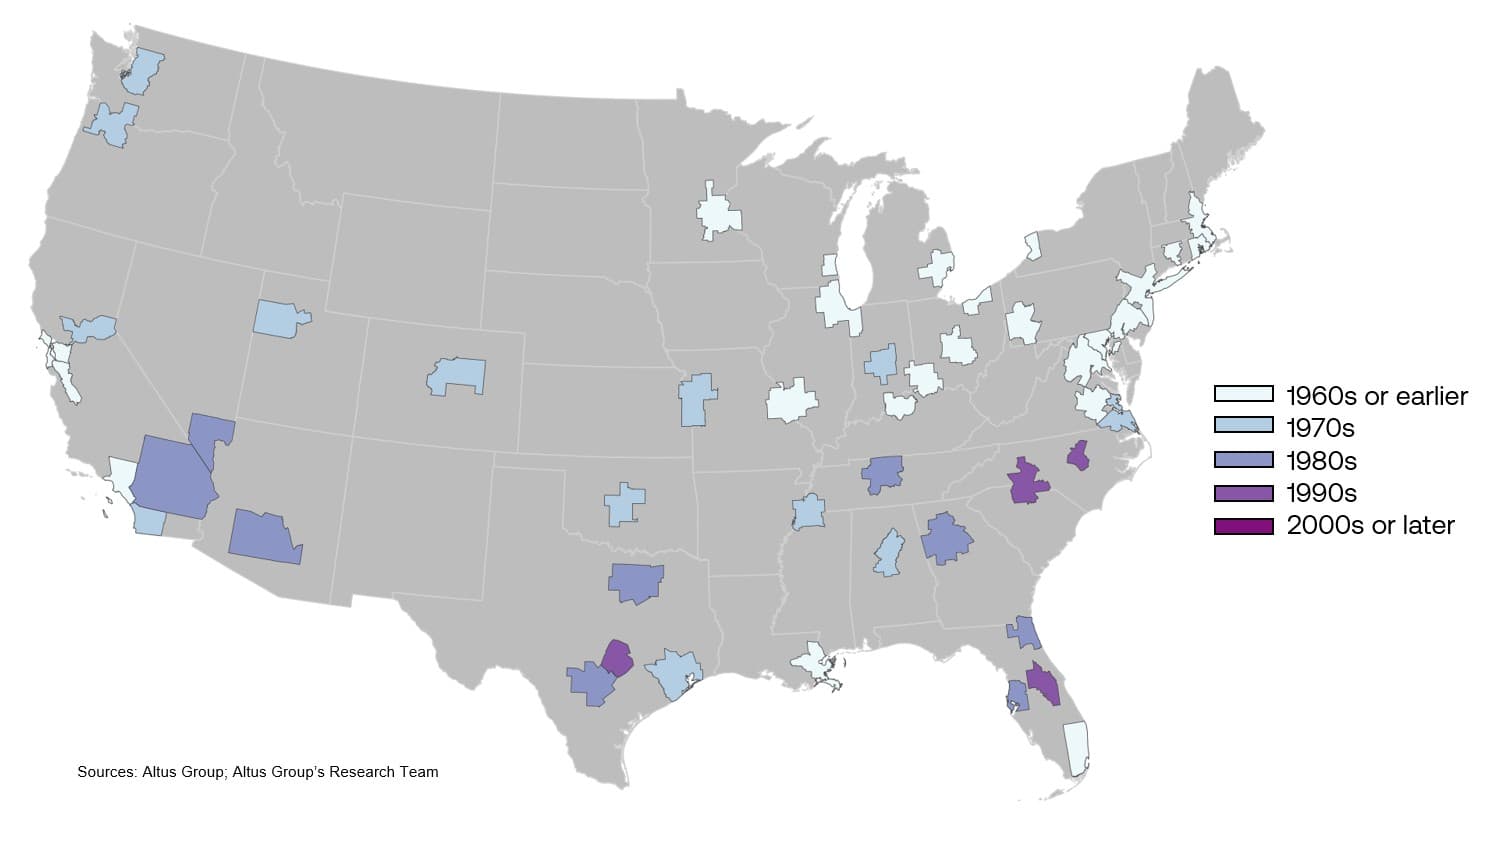
1960s or earlier vintages therefore dominate the Northeast (New York, Philadelphia, Boston), Midwest (Chicago, St. Louis, Detroit), and legacy coastal markets such as San Francisco, Los Angeles, and New Orleans. The 1970s vintage properties are typical in much of the Mountain West, Pacific Northwest, and an assortment of other landlocked cities (Kansas City, Oklahoma City, Memphis, Birmingham). The 1980s define many Sunbelt MSAs including Phoenix, Las Vegas, San Antonio, Dallas, Atlanta, and Jacksonville, among others.
Figure 3: Typical built decade of existing multifamily stock
What has traded so far in 2025?
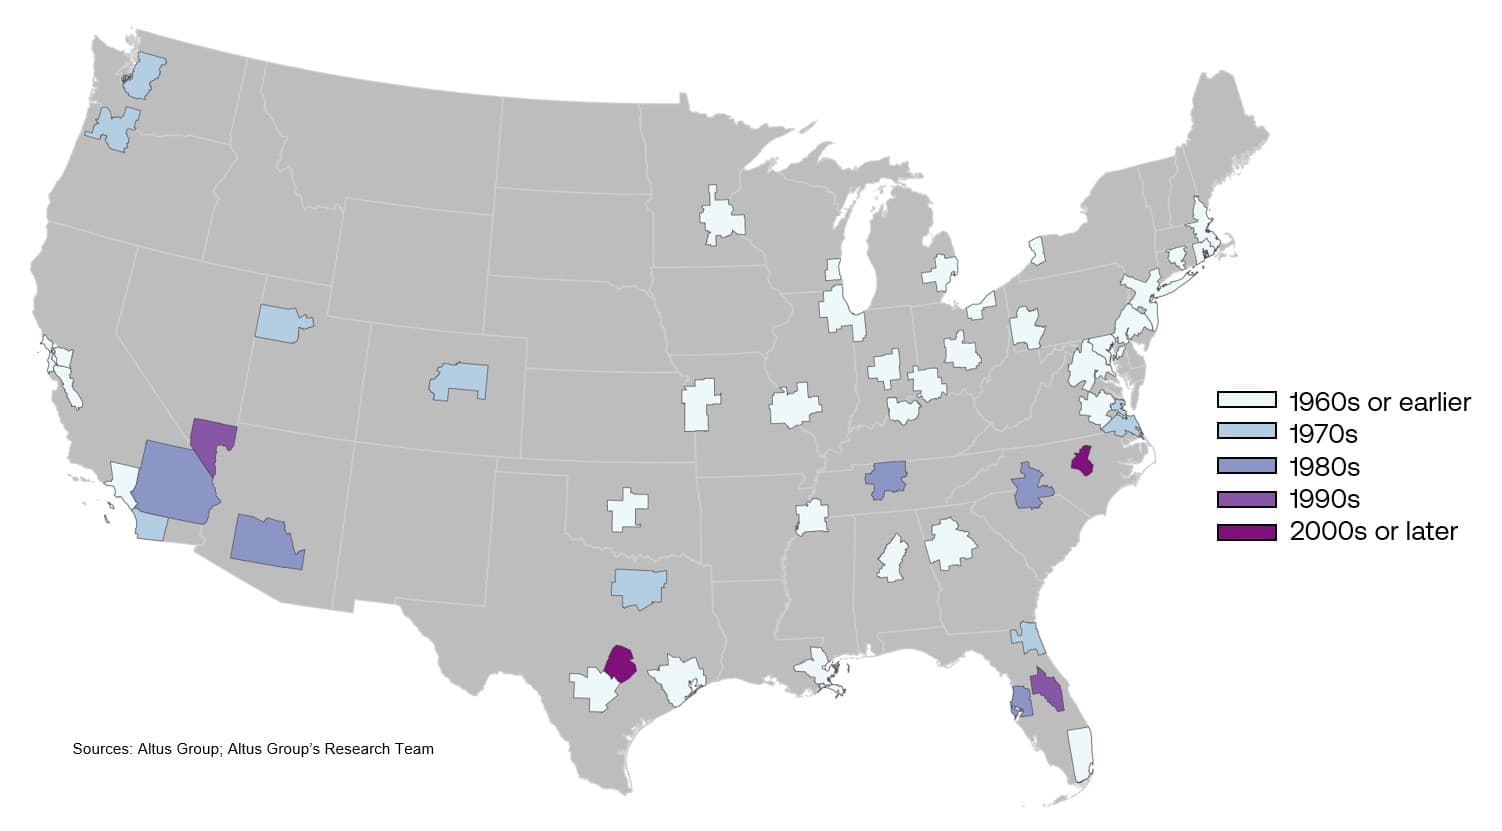
The typical multifamily building sold in 2025 is even older than the overall stock. Most (31) metros saw median traded properties from the 1960s or before. Only a few high-growth markets bucked the trend: Riverside, Phoenix, Nashville, Charlotte, and Tampa saw typical sales from the 1980s; Orlando and Las Vegas from the 1990s; and Austin and Raleigh from the 2000s or later.
Figure 4: Typical build decade of transacted multifamily stock
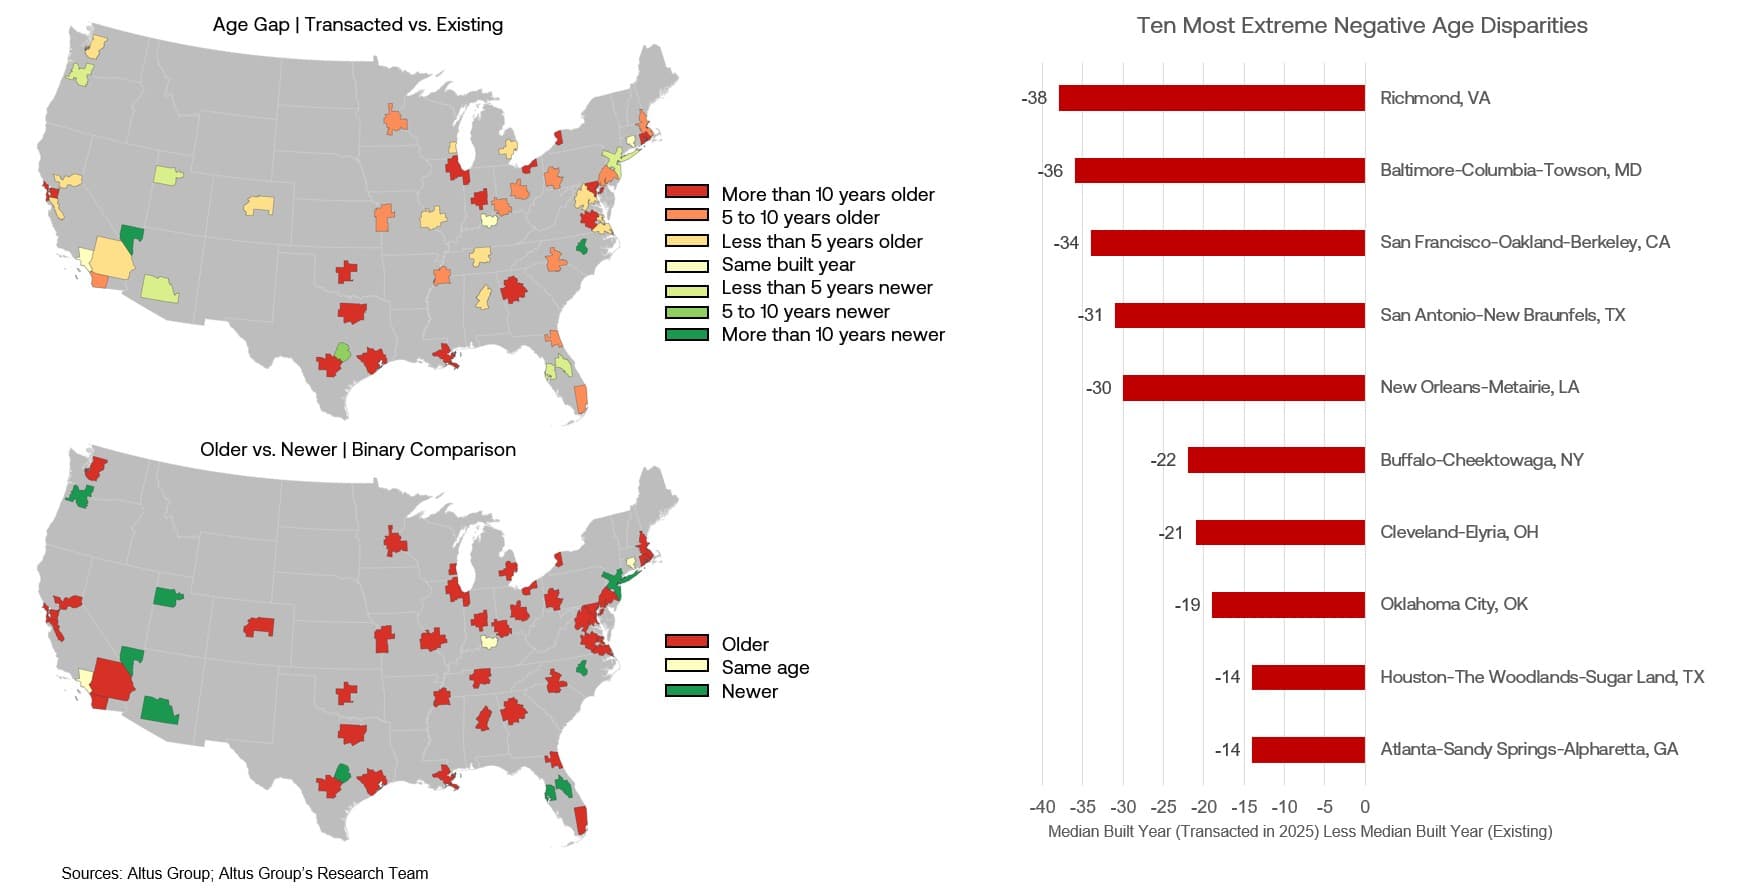
Only nine metros saw newer traded properties, three matched the typical built year exactly, and the rest (38 MSAs) skewed older. In Richmond, Baltimore, San Francisco, San Antonio, and New Orleans, the typical traded property in 2025 was more than 30 years older than the stock median. Other large negative gaps appeared in Buffalo, Cleveland, Oklahoma City, Houston, and Atlanta. By contrast, Raleigh’s traded properties were 25 years newer, and Las Vegas' were 13 years newer.
Figure 5: Age gap - Transacted vs. existing; Older vs. newer - Binary comparison
One possible explanation
Even though it is hard to definitively say what is driving these trends, a possible explanation is that there is simply more liquidity with older (and usually smaller) multifamily properties than other property types. Older, smaller multifamily properties generally have lower prices than larger, newer properties, so the equity contributions required for a transaction are lower, attracting a broader pool of potential buyers. Also, in addition to the lower equity requirements, liquidity may also be better for these properties because of access to more lenders and financing options - specifically, the agency lenders (i.e., Freddie Mac, Fannie Mae). Agency financing serves as a consistent and competitively priced financing option, which is only available for residential properties. Since the agency financing programs and products are predominantly focused on stabilized, existing properties, the result may be a tilt toward these older properties.
More detail on transaction composition and property vintages will follow in the upcoming Q3 2025 US CRE Investment and Transactions Quarterly report, offering a deeper view into how these patterns shifted into Q3 2025.

Author

Cole Perry
Associate Director of Research, Altus Group
Author
Cole Perry
Associate Director of Research, Altus Group
Resources
Latest insights