Investors revisit US malls amid mixed consumer signals
Renewed energy behind US mall transactions could mark an inflection point for the broader retail category.

Key highlights
Reonomy data shows that just over 1,000 mall properties remain in the US as of 2025; the majority were built before 1990, and fewer than 3% have been constructed in the past 15 years
Mall fundamentals continue to strengthen; rent spreads remain healthy, occupancy has rebounded to pre-pandemic levels, and lease rollover concerns are waning
The US consumer outlook appears mixed; sentiment remains historically low, yet retail spending continues to rise, at least nominally
CRE investors appear to be calling consumers’ sentiment bluff, with as many single-asset mall sales occurring in the first three quarters of 2025 as in all of 2024; 2025 is on track to be the biggest year for such trades since 2022
Consumers, confidence, and the mall rebound
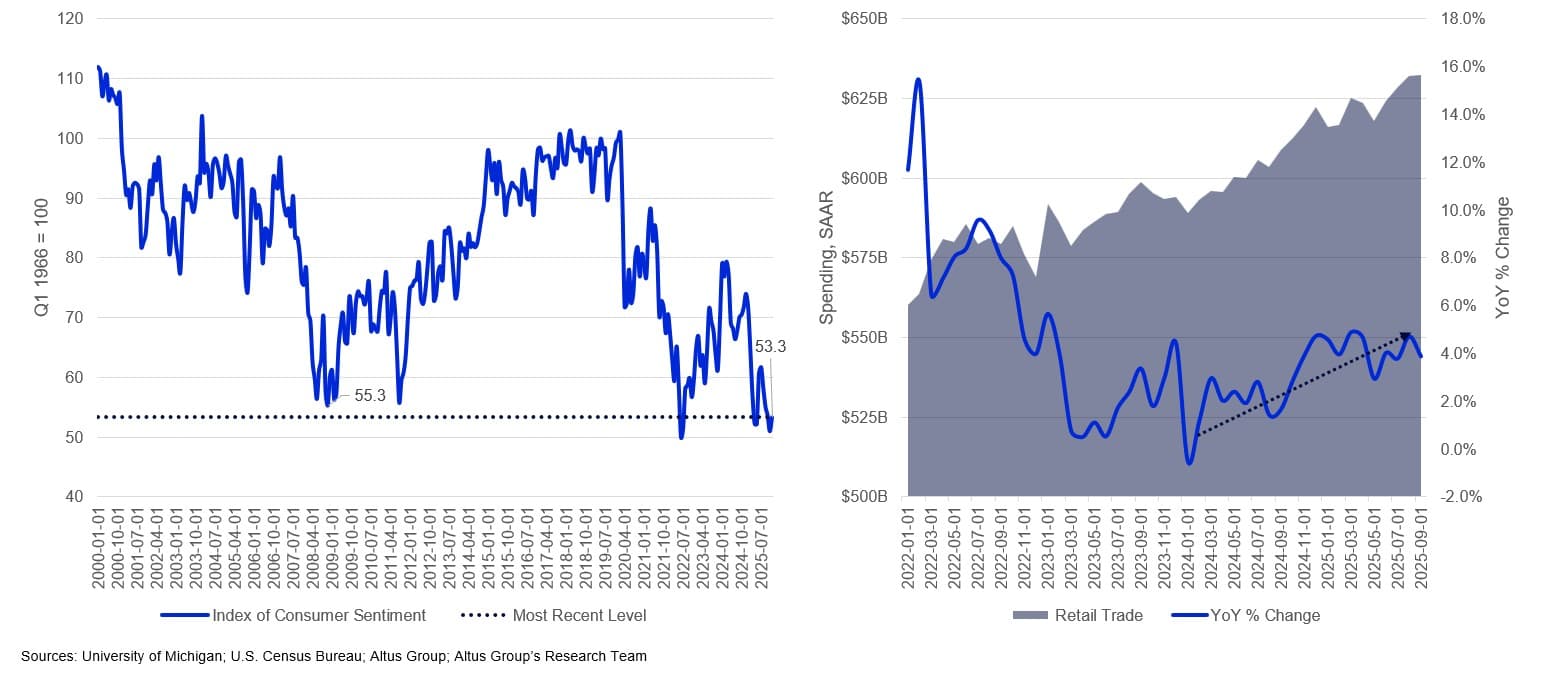
As the year closes and the holidays approach, consumer sentiment data paints a bleak picture. The preliminary readout of the University of Michigan’s Consumer Sentiment Index for December came in at 53.3, near its lowest level on record (50.0 in June 2022) and even below the 55.3 recorded during the height of the Global Financial Crisis.
Yet nominal retail spending data tells another story. The most recent Census Bureau retail trade figures (from September, delayed by the government shutdown) show seasonally adjusted annual spending of $632 billion, up 3.9% annually. However, in real terms, spending growth appears to be weak by historical standards, though not concerningly so. Overall, the consumer outlook appears decidedly mixed.
Consumer sentiment and nominal retail spending
Nonetheless, retail commercial real estate investors, and specifically those focused on malls, appear to be calling consumers’ sentiment bluff. Several nine-figure shopping mall trades have made headlines this year, and single-asset transaction data shows that 2025 is shaping up to be a strong year for the mall sector compared to historical trends.
In the Altus Group Research Team’s 2023 overview of the sector, concerns about malls centered on rising tenant turnover, elevated vacancy, and steady cap rate expansion. But over the past two years, those trends have stabilized or reversed, and investors are taking notice. Nearly as many single-asset mall sales occurred in the first three quarters of 2025 as in all of 2024. The following is the team’s holiday revisit of the sector.
Charting the remaining mall universe
While malls represent a relatively small share of total US retail real estate, they remain among its largest and most visible assets. Using a crosswalk of OpenStreetMap and Altus Group’s Reonomy data, 1,382 mall properties were identified nationwide, of which just over 1,000 are estimated to be in operation as of 2025. This analysis covers more than 1,100 single-asset transactions linked to these properties and excludes major portfolio or entity-level acquisitions, such as Simon Property Group’s recent purchase of the remaining interest in Taubman Centers.
Timeline of construction – Presently-operating US malls
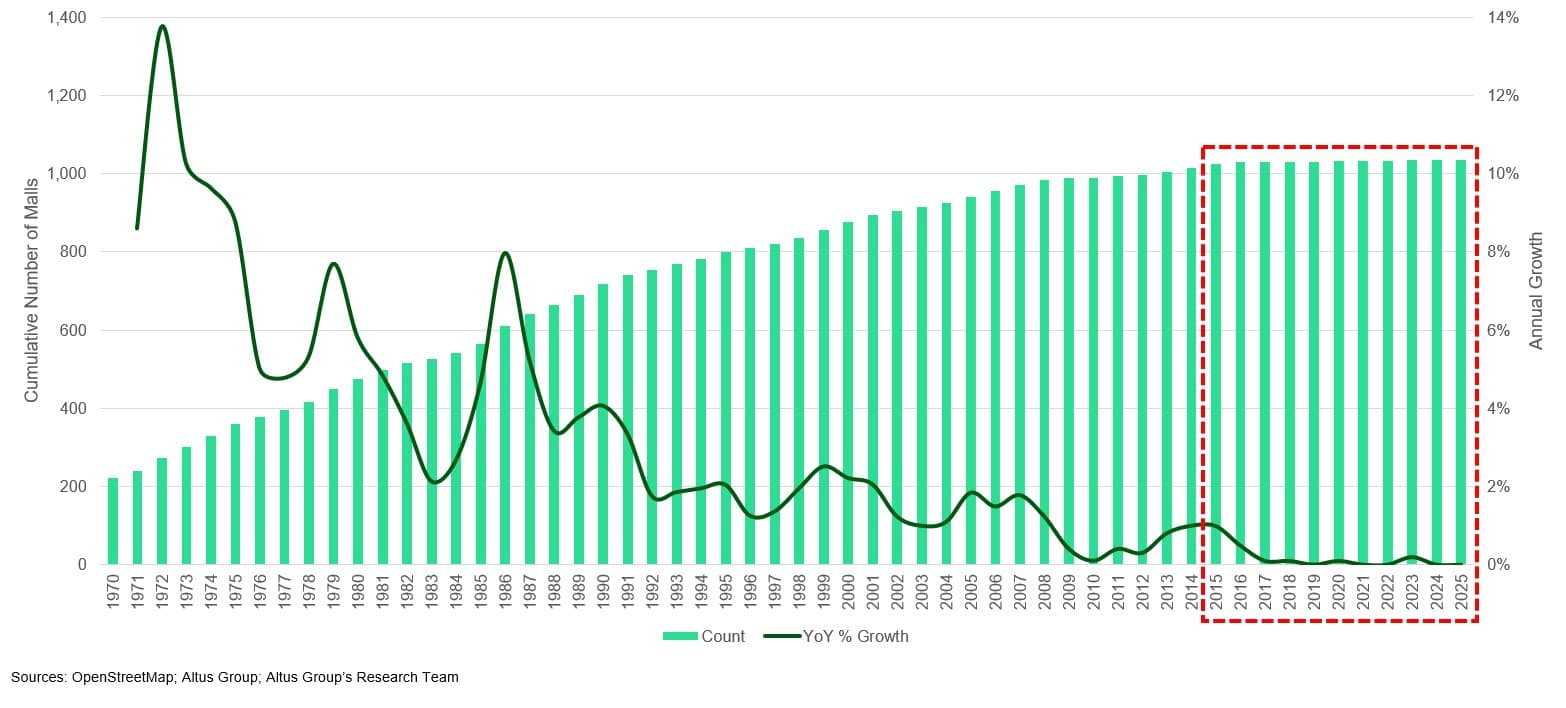
Across these known operating malls, primary parcels alone encompass at least 514 million square feet of space. This figure excludes anchor stores or other components located on separate parcels, meaning the total built area is considerably higher. Most are older assets: the vast majority (69.3%) were constructed before 1990, fewer than 3% have been built since the Global Financial Crisis, and virtually none within the past decade. County assessment data places their aggregate value above $56 billion, or an average of about $55 million per property.

Single-asset trades make a comeback
Although the mall segment is small in count, these are high-value, headline-making assets when they trade. Investor demand for colossal retail assets is colliding with a sector that has not meaningfully expanded in years.
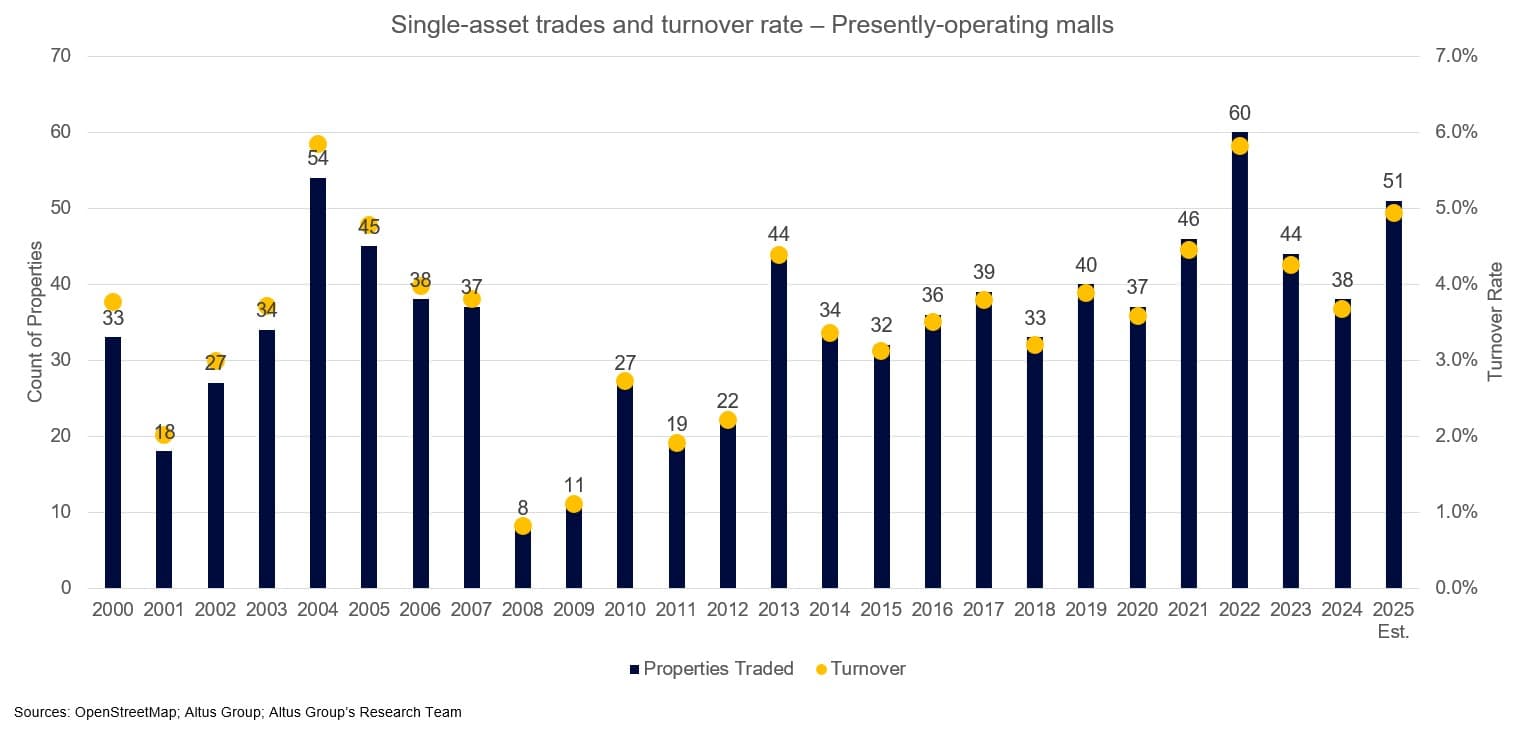
38 malls traded in single-asset transactions during the first three quarters of 2025, matching the total for all of 2024
At the current pace, more than 50 malls are on track to change hands by year-end as part of such transactions, marking the third-highest annual total in more than two decades
That level of activity would equate to a 4.9% turnover rate relative to the existing stock, trailing only 2022 and 2004 (both at 5.8%) as the most active years in over 25 years
Number of single-asset mall trades of operating properties
Fundamentals hold their ground
Improving property performance may be one of the reasons investors are re-engaging with the mall sector. The steady recovery in fundamentals since the Altus Group Research Team’s 2023 update has strengthened the investment case for these complex assets.
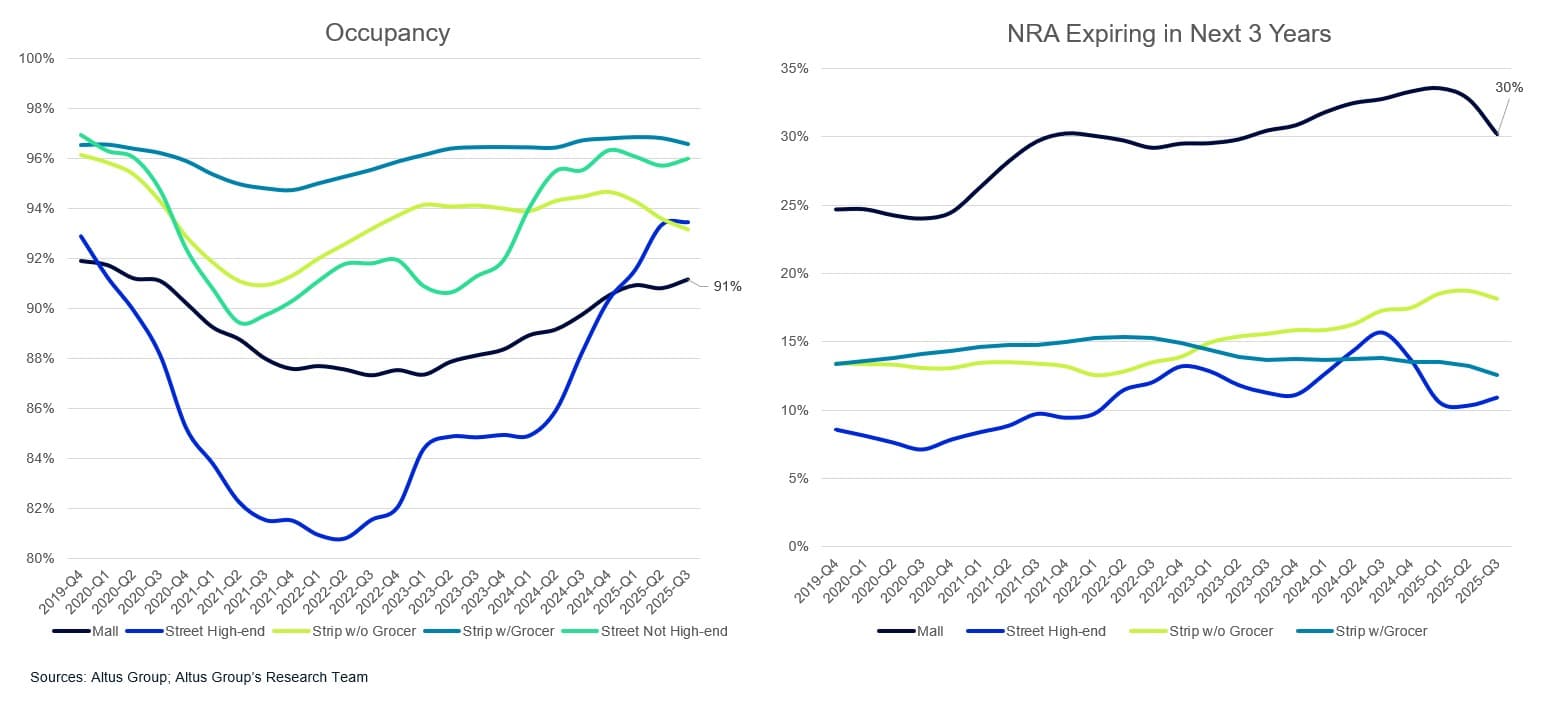
Occupancy has rebounded to 91%, effectively matching the pre-pandemic rate from late 2019
The share of space expiring within three years remains slightly elevated from 2019 but has been trending lower in recent quarters
Market-to-contract rent spreads are widest among retail subtypes at 7.5%, reflecting strong re-leasing potential
Appraisal cap rates, which climbed through 2023 alongside higher interest rates, have since stabilized near 6.3%
Retail occupancy and NRA expiring by subtype
Market-to-contract rent spreads and implied year 1-5 cap rates by subtype
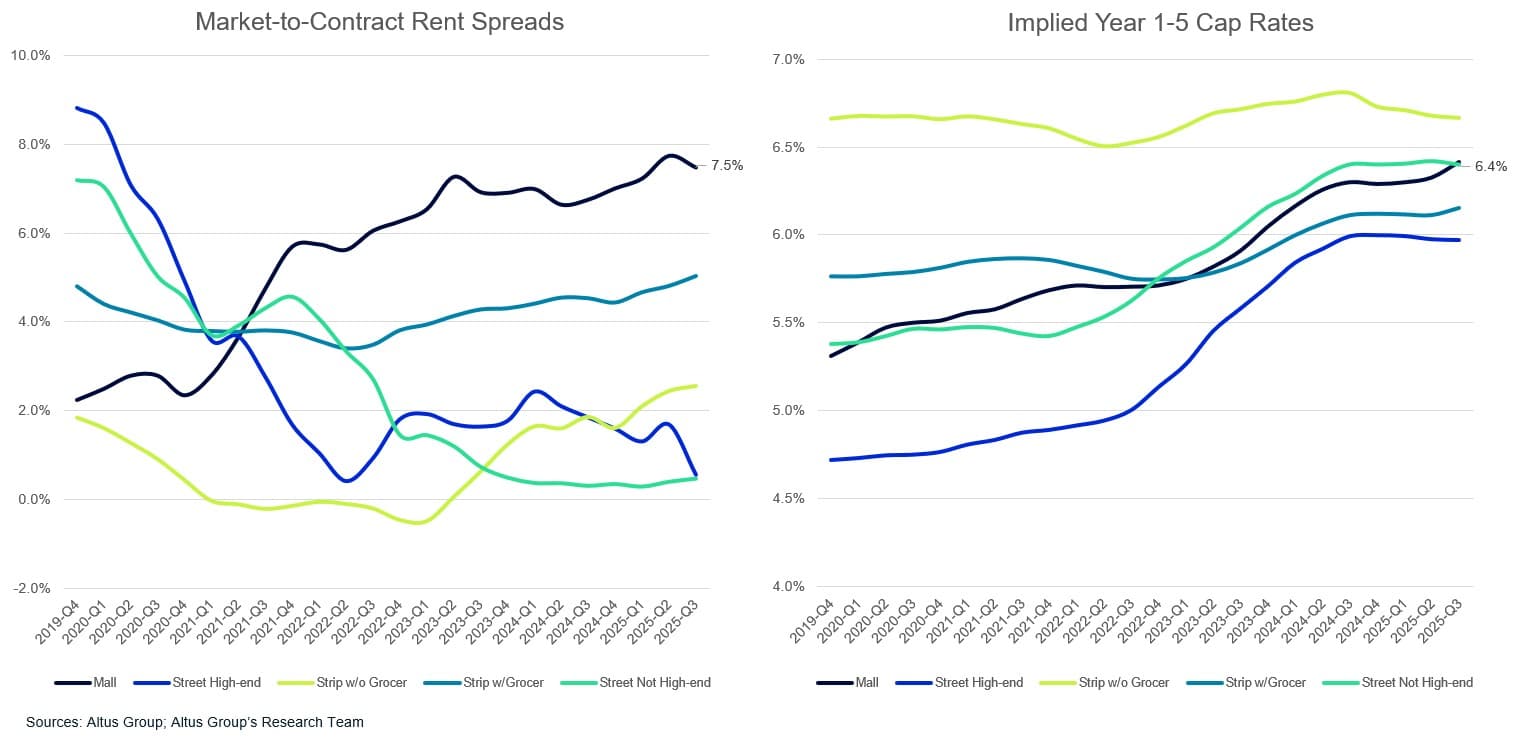
This combination of steady occupancy, manageable rollover exposure, and rising rent spreads has made malls relatively attractive compared with other retail property types. The weakest centers have already cycled out of the market, leaving behind higher-quality assets with more predictable cash flows.
Signals for the broader retail CRE market
Despite the uptick in mall investment, the broader retail property market has yet to fully recover its pre-pandemic pace. Between 2015 and 2019, an average of around 11,400 retail properties traded each quarter. In Q3 2025, that number reached 11,039, still slightly below the historic norm. The same is true for the quantity of space traded. Over 88 million square feet of retail space transacted in Q3 2025, the most since Q4 2022, but still 5.7% below the 2015-2019 quarterly average of 93 million square feet. While average quarterly retail investment stood at $23.1 billion in Q3 2025, this was only a marginal improvement over the quarterly average of $21.3 billion from 2015 to 2019.
Count and total value of retail properties traded since Q1 2000
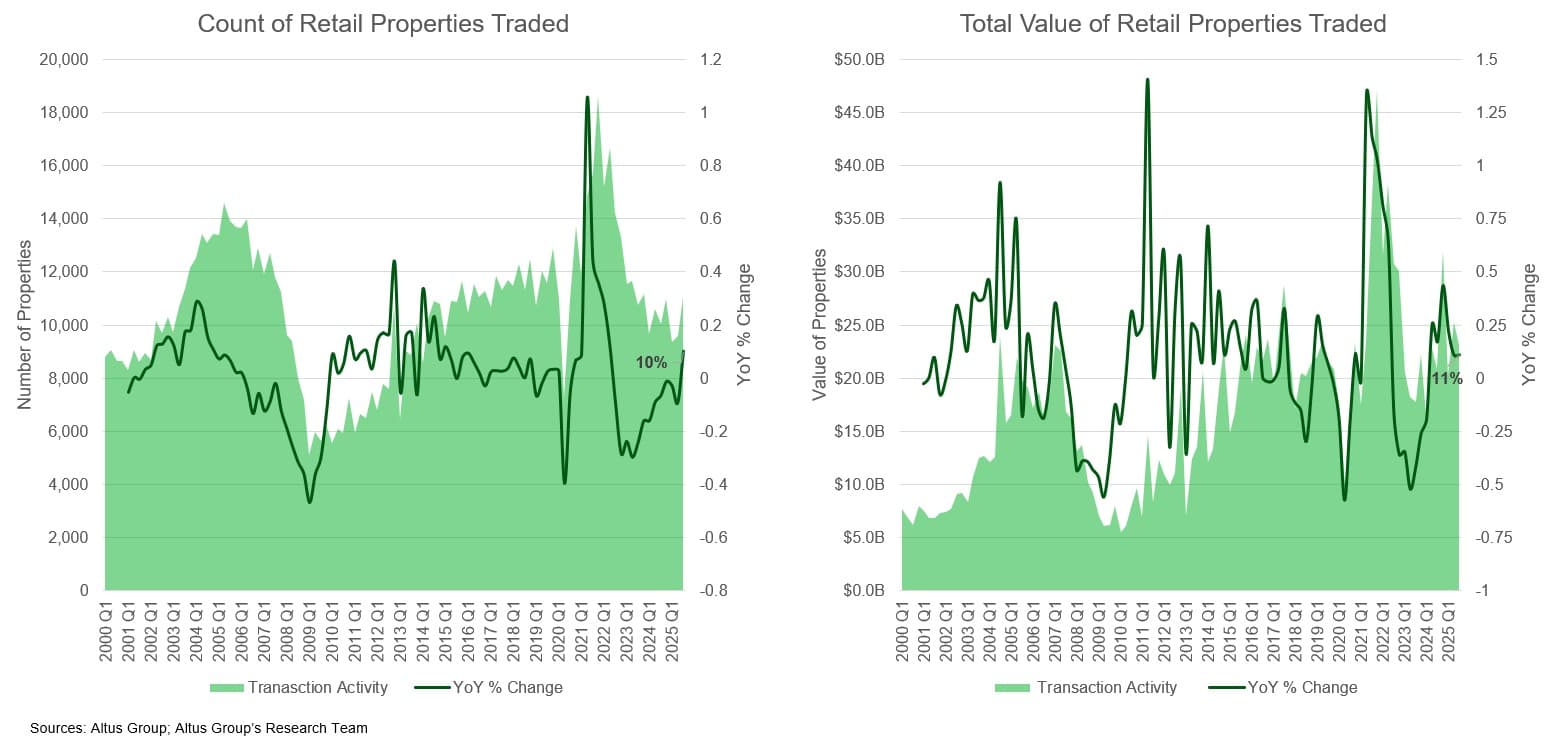
Still, renewed energy behind mall transactions could mark an inflection point for the broader retail category. Investors appear to be re-engaging with the sector, a trend that mirrors the overall return of large-dollar deals in 2025. With consumer spending strong and high-quality supply limited, malls may once again be setting the tone for broader retail real estate recovery heading into 2026.

Author

Cole Perry
Associate Director of Research, Altus Group
Author
Cole Perry
Associate Director of Research, Altus Group
Resources
Latest insights