Inside CRE valuation: Why calculating US selling costs is not one-size-fits-all
Explore why selling costs in US CRE valuations vary - from transfer taxes to commissions - and how each component shapes selling assumptions.

Key highlights:
Particularly in major markets, selling costs can materially impact sale proceeds
The main variables that impact selling expense assumptions are property type, size, and location
Selling costs can include transfer taxes, brokerage commissions, marketing expenses, legal fees, and closing costs
New and increasing transfer taxes in many jurisdictions is pushing conversations about selling expenses to the forefront
Why selling costs deserve more attention
Selling costs are a critical, yet often overlooked, line item in resale valuation calculations. Small assumption errors, even by half a percent, can translate into millions of dollars on large transactions. Exactness in determining selling costs isn’t just good practice, it’s essential for accurate valuation and strategic decision-making.
Selling costs come into play at the end of a resale valuation calculation with inputs that are made within a discounted cash flow (DCF) analysis. Assumptions are a percentage of the projected adjusted gross sale price of a property, and they can vary widely from below 1% to more than 6%, depending on the property type, size, and location. Selling costs – often paid by the seller – are not inconsequential.
For example, the current market selling cost assumption for a Manhattan office building is about 4.00%. Using a generic 2.00% assumption — the kind often applied when market nuances aren’t fully understood — would underestimate these costs and create a valuation discrepancy of more than $1 million once discounted back to present value.
Two questions related to selling expenses that frequently come up from property owners are:
How do you come up with that assumption?
Why does it vary from market to market?

Boost investor confidence with independently managed valuations
Independent appraisals trusted by funds, investors, lenders, and public entities around the world.
What’s included: The nuts and bolts of selling expenses
Selling costs include transfer taxes, brokerage commissions, marketing expenses, legal fees, and closing costs.
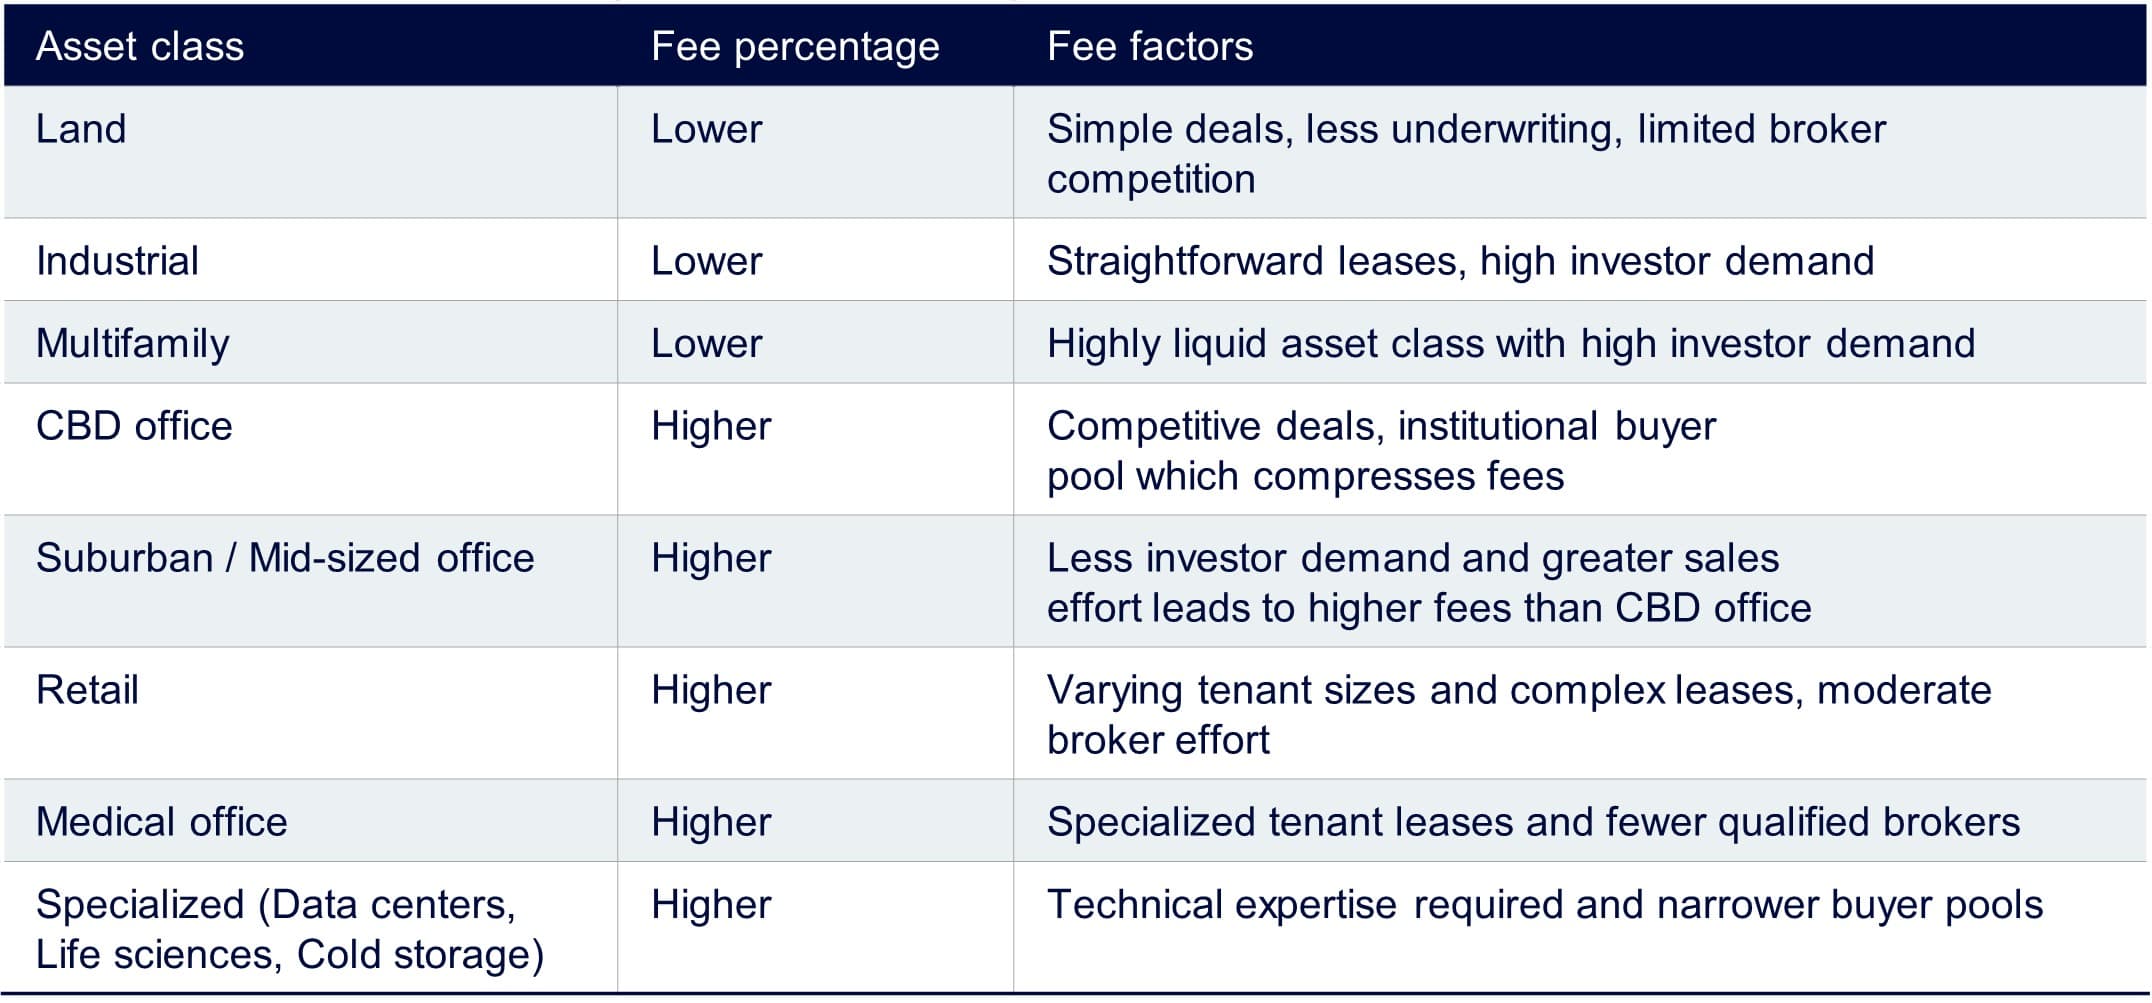
Brokerage commissions are one expense that can vary widely, often increasing with property complexity and decreasing on a percentage basis as the property value rises. The lowest brokerage commissions are typically found in apartment and industrial property sales, while sales of regional malls and secondary-market offices command the highest commissions.
Additionally, Altus Group has found that commissions are lowest when it comes to sales between institutional investors or REITs. The chart below outlines the varying factors that contribute to commission size across different asset types.
Figure 1 – How commissions vary across CRE sectors
Regional realities: Why selling costs vary market to market
In recent years, rising city and state transfer taxes have pushed selling expenses to the forefront, which in some cases has resulted in larger line items in resale calculations. As such, it is imperative to reference the most recent transfer tax schedules to establish accurate selling cost assumptions.
Most US states (35 plus Washington, D.C.) have set transfer taxes that are due upon sale. Generally, the amount in most states is less than 1% of the sale price. However, some cities and states impose substantial transfer taxes, which should be reflected in the selling costs. For example, San Francisco has some of the highest selling expenses with a range between 4 and 6% across all property types.
Depending on the location, a transaction may be required to pay transfer taxes at both the city and state level, and larger transactions above certain thresholds may be subject to a greater tax rate. Gateway markets in particular are prone to higher transfer taxes. Examples of regional nuances in gateway markets include:
• New York City: Transfer taxes at both city and state levels can total more than 3.25%
• San Francisco: Progressive city transfer tax, up to 6.00% on sales greater than $25M
• Los Angeles: Luxury/Commercial Tax applied at a rate up to 5.95% upon sale
• Philadelphia: Transfer taxes at both city and state level, city rate alone is above 3.28%
• Washington State: County and state excise taxes reaching 3.00% on sales above $3,025,000
As shown in Figure 2, these valuation assumptions play out unevenly across metros.
Figure 2 - Comparative average selling cost assumptions across US metros
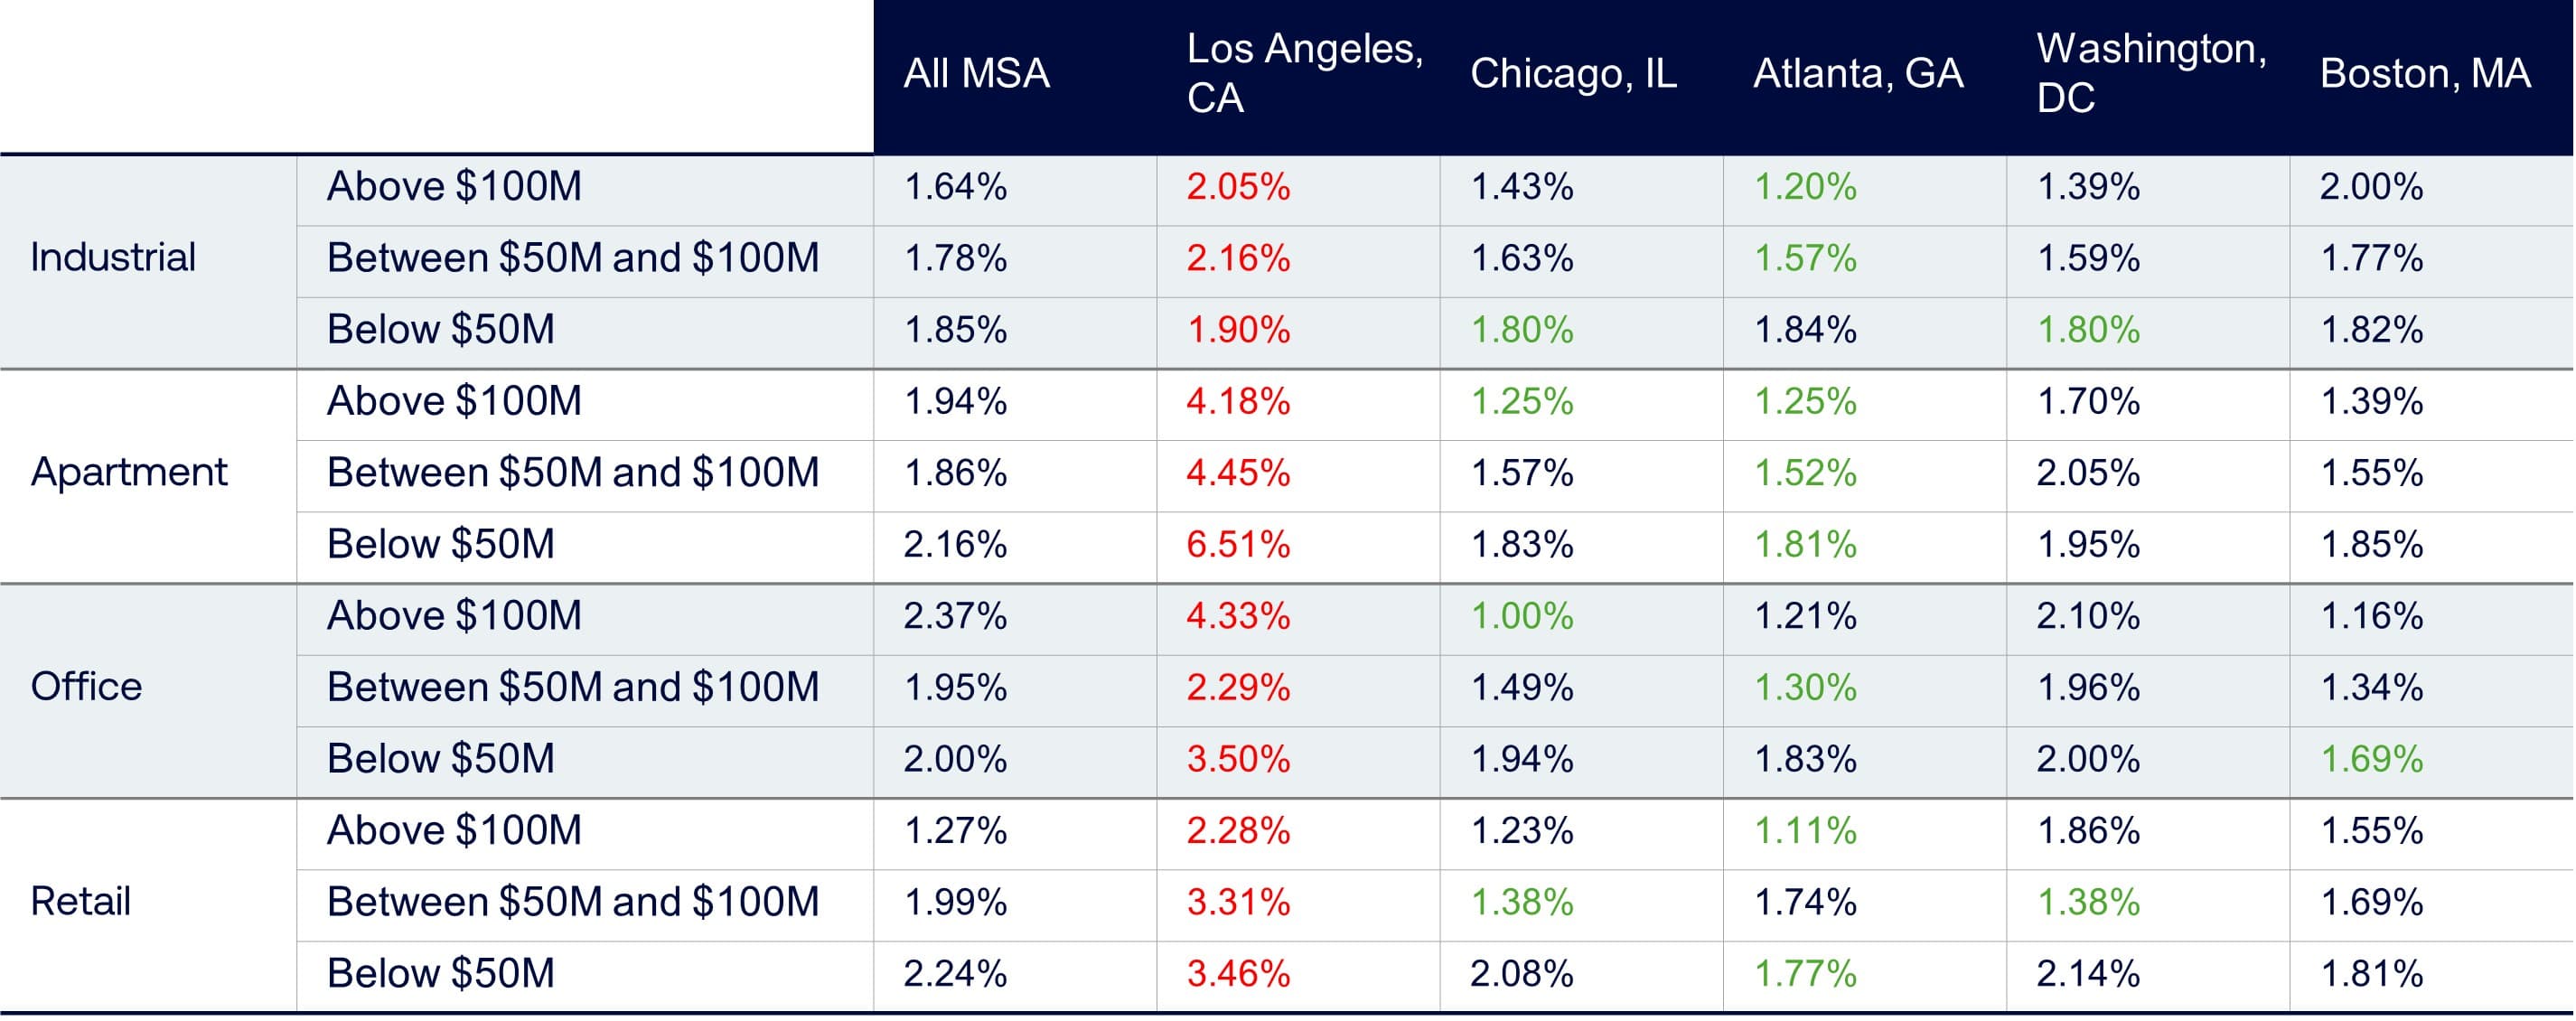
Source: Altus Group
Sizing up CRE selling costs: Key drivers and benchmarks
The main variables that impact selling expense assumptions are property type, size, and location. The complexity of an asset or transaction can be another factor that impacts the selling costs. More complex assets tend to incur higher costs on a percentage basis. However, higher-value assets often benefit from economies of scale. So, while the dollar amount of selling costs may increase, the amount decreases as a percentage of the total transaction value.
Best practices for setting assumptions include:
Recognize regional differences and evaluate the selling expense assumption based on the city and state. Is an assumption that is above the norm because of a rounding error, or is it higher because of the location?
Reference the most recent transfer tax schedules to establish accurate selling cost assumptions.
Consider the property dynamics, including size, property type, and any potential market obstacles. Some buildings that are more specialized or difficult to sell may require more marketing dollars or a higher broker commission.
Benchmarking selling expenses is a good way to determine if your assumption is in line with the market and not set too high or too low. Take advantage of industry benchmark data to compare and contrast where your selling expenses sit relative to peers in a particular region.
Work with a valuation expert to validate assumptions and ensure they reflect current market conditions.
As mentioned previously, the size of the transaction can impact selling costs. The chart below utilizes data from Altus Group to compare the selling costs for each property type between property values.
Figure 3 - Selling cost benchmarks by deal size
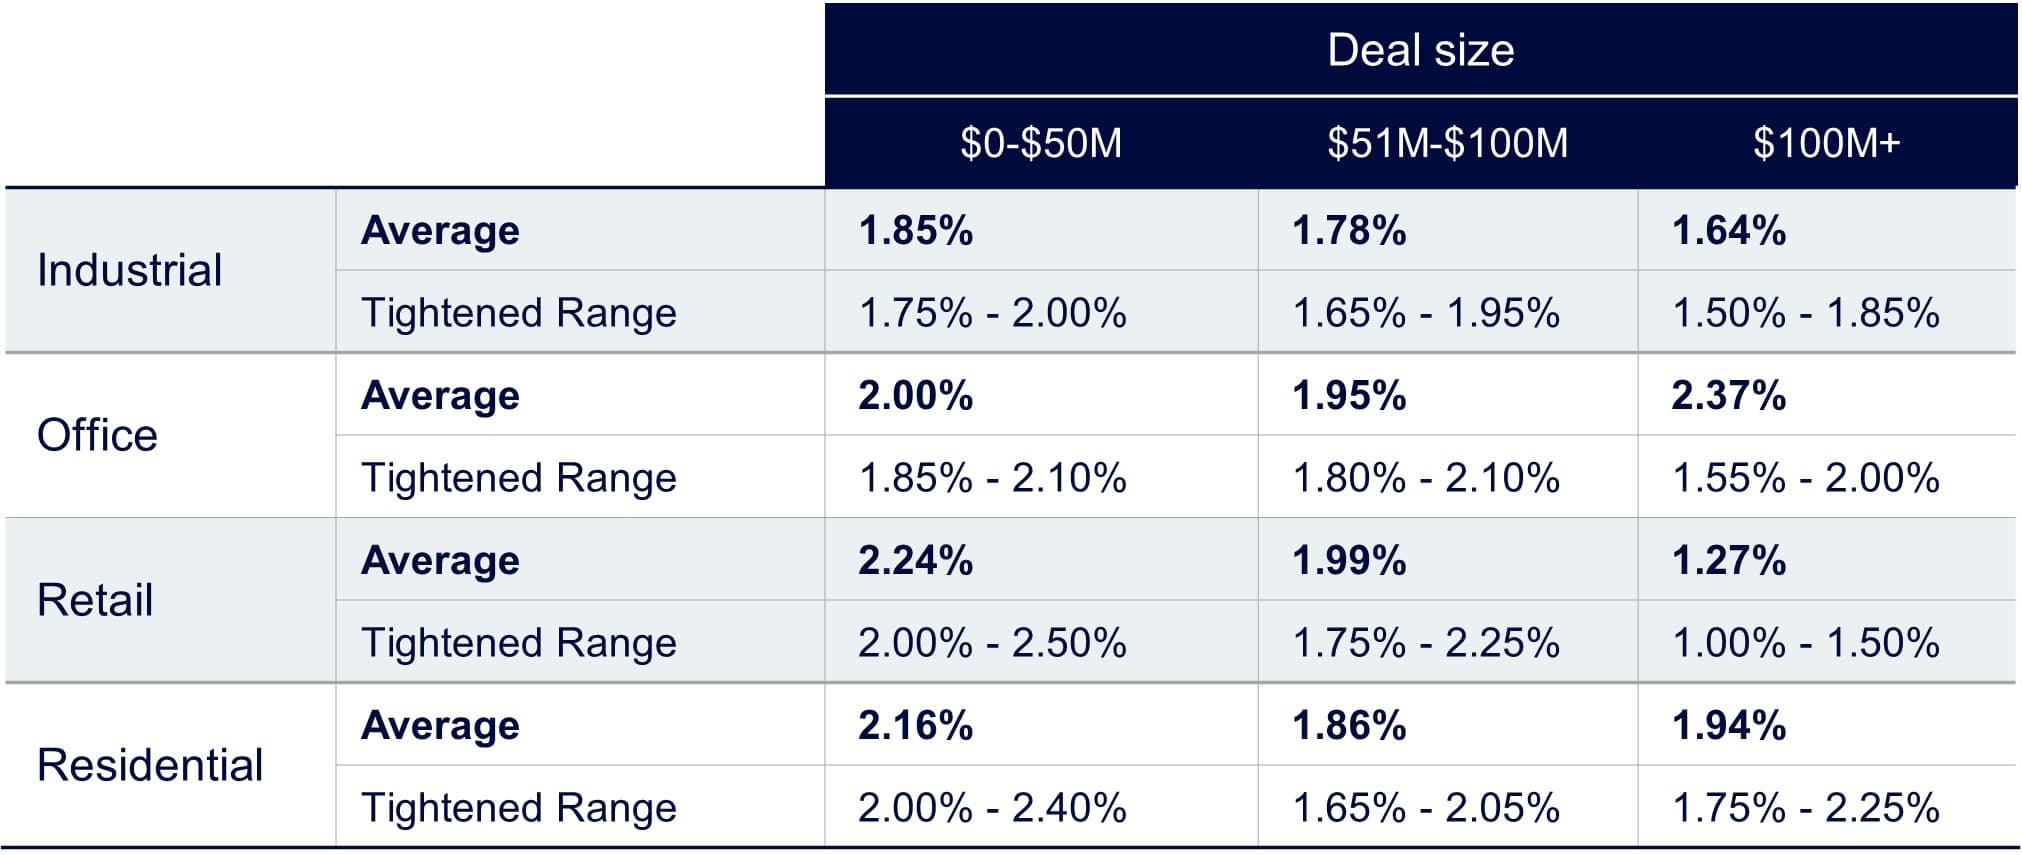
Source: Altus Group
Note: Office and residential selling costs for deals greater than $100M are skewed upwards due to the presence of increased transfer taxes in high-value jurisdictions.
Key takeaway: Update your assumptions
Where to input selling costs? In a typical ARGUS Intelligence model, selling costs can be found in the Property Resale tab. To locate this adjustment, navigate to the Valuation tab, then the Property Resale sub-tab, and scroll to the end to find Adjustments. The default Selling Cost adjustment in ARGUS is calculated as a percentage of Adjusted Gross Value.
Selling costs are a key part of real estate modeling. As discussed, these costs vary by property type, size, location, and complexity. Particularly in major markets, selling costs can materially impact sale proceeds. Following best practices and regularly updating assumptions supports valuation analyses and informs investment decisions to optimize transaction outcomes.
Want to be notified of our new and relevant CRE content, articles and events?
Authors

Kyle Brewer
Senior Consultant, Valuation Advisory

Adam Sadoff
Consultant, Valuation Advisory
Authors
Kyle Brewer
Senior Consultant, Valuation Advisory
Adam Sadoff
Consultant, Valuation Advisory
Resources
Latest insights