East vs. West: Inside Inland Empire’s industrial rent divide
Explore the drivers of Inland Empire’s East-West rent divergence and how benchmarking, cycles, risk, and advanced analytics are critical for industrial investors.
Key highlights
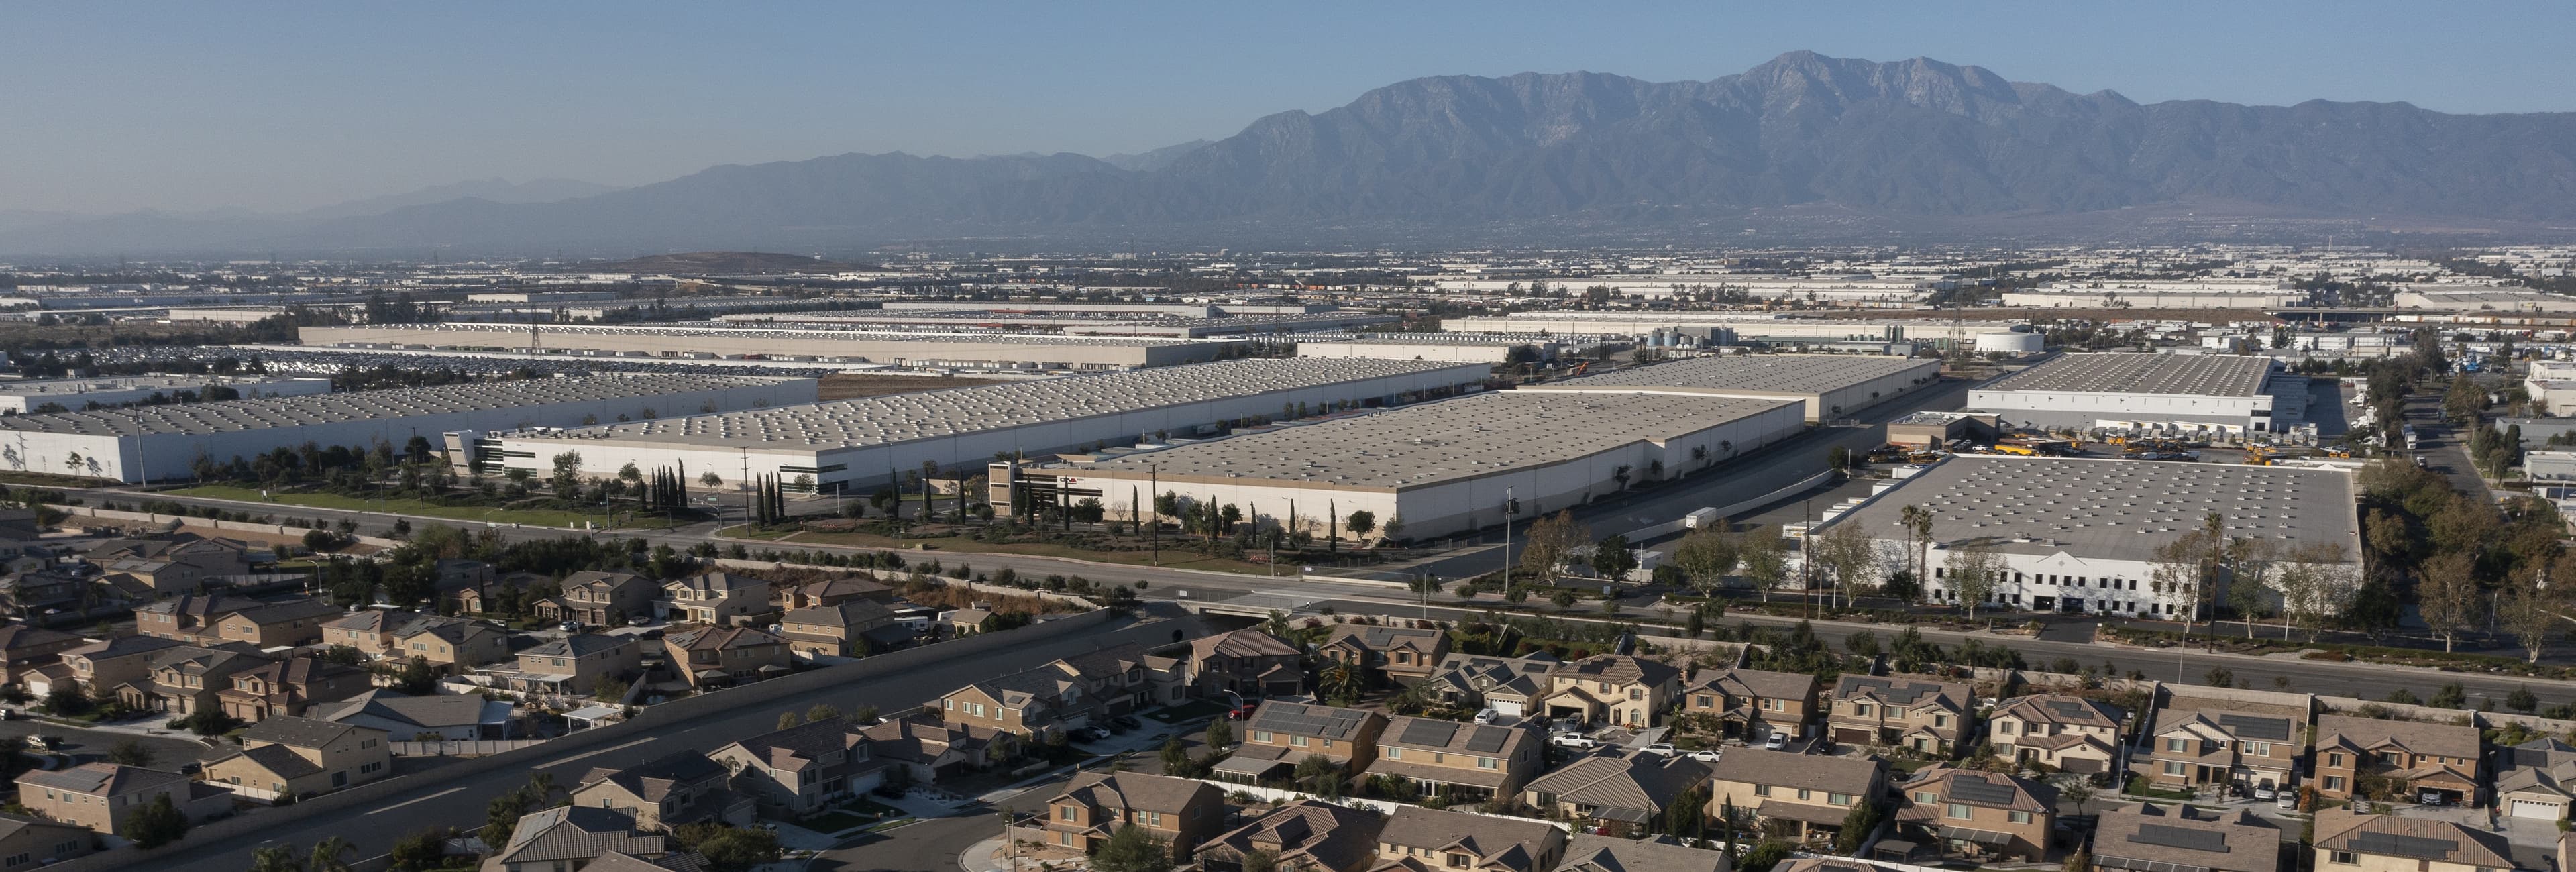
Inland Empire, spanning Riverside and San Bernardino counties east of Los Angeles, is one of the nation’s largest industrial hubs and a critical link in global supply chains
While both East and West Inland Empire saw exceptional rent growth during and after the pandemic, recent data reveals that the West surged rapidly before a correction, whereas the East followed a steadier, more consistent trajectory
Proximity to L.A., competition for assets, post-pandemic e-commerce demand, and access to major ports fueled dramatic differences between submarkets
Current rents are well above pre-pandemic levels, demonstrating enduring market strength and stability
Understanding what drives submarket divergences and the underlying story behind peaks and corrections is essential for allocating capital, managing risk, and communicating with stakeholders
What happened in the Inland Empire?
If commercial real estate (CRE) leaders know one thing for certain, it’s this: everything is subject to change. Even the highest performing asset classes can endure a stark recalibration after an extended period of resiliency, just as formerly overlooked submarkets can rise up the ranks following a shift in economic tides or consumer behavior. In the wake of higher interest rates, volatile e-commerce activity, and changing fundamentals, the Inland Empire has emerged as a prime example of how even the strongest markets can shift in unexpected ways.
While both East and West Inland Empire (the vast industrial corridor spanning Riverside and San Bernardino counties east of L.A.) enjoyed meteoric rent growth through the pandemic and into 2022, recent data tells a tale of two distinct market cycles. Over the last five years, rent growth across Inland Empire industrial properties has outpaced not just the national trend, but also Los Angeles. Yet, the surge has played out differently across the region. West Inland Empire rents climbed rapidly toward L.A. levels, which have historically been among the highest in the region, before correcting , while East Inland Empire charted a steadier, more consistent path.
To understand what’s really behind this divergence, we turned to the data, examining historical rent patterns and market benchmarks to reveal how performance and risk have shifted across the region. So, what exactly happened in the Inland Empire?
Taking a closer look at the geography (and data) behind industrial rent trends
It’s important to clarify what separates the East from the West when looking at the Inland Empire’s submarkets. “There really isn’t a single, universally agreed-upon line that splits the two,” notes Sally Johnstone, Senior Manager, Advisory at Altus Group. This ambiguity makes data-driven differentiation all the more essential. Using anonymized valuation data, Johnstone mapped cash flow metrics for stabilized industrial assets over multiple years. “It wasn’t until we visualized market rent distributions over time that the distinction between East and West truly came into focus,” she added. “For most other metrics – like cap rates or vacancy – the split wasn’t obvious, but when you look at market rent, the geographic pattern jumps out.”
Looking at the data, market rent levels emerge as the strongest indicator differentiating the markets. In the West Inland Empire, rents soared (at times nearly matching Los Angeles levels), while the East Inland Empire experienced far more measured growth. “If you map the 2020, 2022, and 2025 average market rent by quartile,” Johnstone explains, “you’ll see how the West’s upper two rent quartiles grow dramatically, whereas the East’s rents, though rising, do so more gradually.”
Figure 1: Industrial warehouse average market rent trends, Los Angeles and Inland Empire
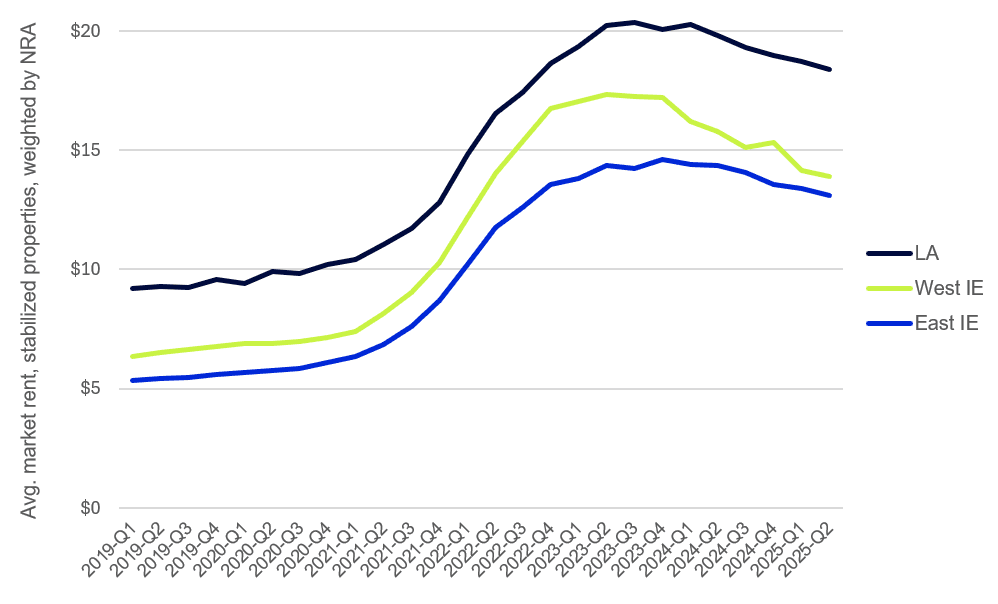
Source: Altus Group
Importantly, both submarkets are now well above their pre-pandemic benchmarks, underscoring the overall strength of the Inland Empire industrial market. As Sally adds, “Even with recent corrections, rents across the board remain at levels we would have called ambitious just a few years ago.”
Supply, demand, and a bit of exuberance
Throughout 2021 and 2022, the Southern California industrial market benefited from the interplay of supply, demand, and a touch of what could be referred to as post-pandemic market exuberance. Nowhere was this more apparent than in Los Angeles and its neighboring Inland Empire.
As industry momentum reached new heights, Los Angeles acted as a geographic accelerant, with its impact radiating outward. “Southern California far outpaced the rest of the country through the 2021 to 2022 growth period,” highlights Mike Amthor, Director, Performance Analytics, adding that the sheer level of investor and tenant interest was so high, especially in L.A, that competition and values rose to unprecedented levels. “Industrial demand around L.A. had something of a contagious effect as it spilled over into Inland Empire West, lifting market rents well beyond those seen in the East.”
Several factors fueled this environment: proximity to the ports, near-zero vacancies, and sustained, peak e-commerce demand. As demand trickled steadily into the West, market rents for warehouses closer to L.A. and major logistics hubs reached significant premiums. Meanwhile, the Inland Empire East, less affected by those explosive dynamics, followed a much steadier and predictable growth path.
From market boom to balance – not bust
The interplay of macroeconomic dynamics and local market forces rarely follows a perfectly predictable script. However, as we trace the turning points of the Southern California industrial market, the inflection point for the region appears to stem from a reconciliation of local market influences and wider macroeconomic factors.
Sharp interest rate hikes in late 2023 began to cool deal flows and temper the exuberant leasing activity that had defined the preceding years. Around that time, US Census Bureau data shows that the rapid growth in national e-commerce sales seen early in the pandemic had started to moderate. Meanwhile, the port congestion that once supercharged warehousing demand gradually subsided, reducing the need for significant “just in case” inventory buffers.
“Occupancies were above 99%,” recalls Amthor. “Things were nearly 100% full in L.A. and the Inland Empire, especially in Inland Empire West. Over the past five years, L.A. rents are up 85% and Inland Empire rents are up 128%. But in the past year, L.A. is down 7%, and Inland Empire is down 10%. There’s been such a huge increase overall, even with a recent bit of a drop.”
Taken together, these shifts signaled a consequential, if measured, market adjustment. After years of record gains, the sector hasn’t collapsed but has entered a period of normalization at levels well above its pre-pandemic baseline. As Amthor explains, “We’re seeing some price adjustments and softer demand compared to the last couple of years, but the underlying fundamentals remain remarkably strong. Vacancy rates are low, and the pipeline is manageable – not indicative of oversupply.”
In Benchmark Manager, you can trace your portfolio or property’s historic cash flow metrics compared to the Benchmark by CBSA(s), property type(s), and/or property subtype(s). Figure 2 shows average occupancy of Los Angeles and Inland Empire industrial warehouses in the Benchmark versus a sample portfolio in that region, over time.
Figure 2: Average industrial warehouse occupancy in LA and Inland Empire, Benchmark vs. sample portfolio (Q3 2020-Q2 2025)
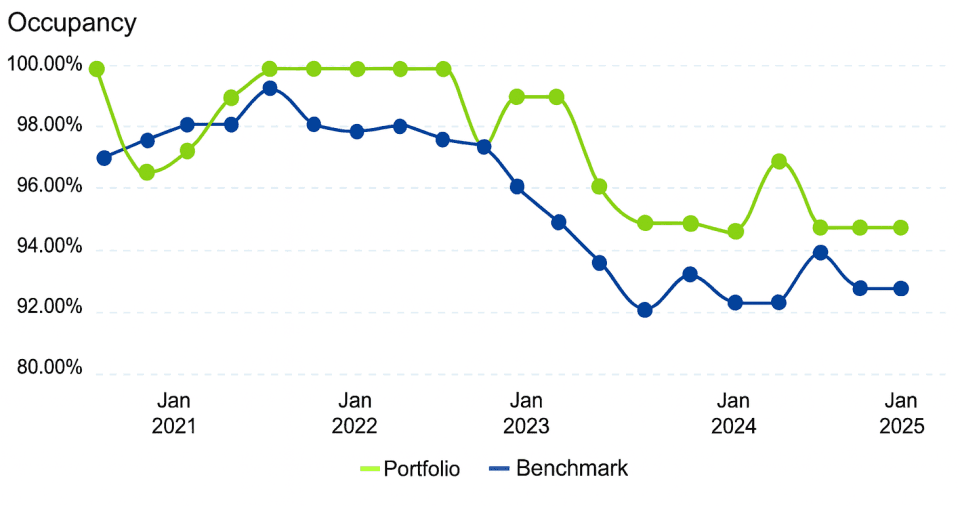
Source: Altus Group, ARGUS Intelligence's Benchmark Manager
The lesson remains clear: market timing matters, but strong fundamentals endure. Understanding what drives submarket divergences and the underlying story behind peaks and corrections is essential for allocating capital, managing risk, and communicating with stakeholders. As Johnstone observes, “Over the past five years, Southern California’s industrial market has significantly outperformed the broader index, with only Miami emerging as a comparable peer.” This sustained performance highlights the importance of looking beyond short-term volatility and the benefits of relying on data-driven insights to inform long-term strategies.
What the data says about risk, resilience, and benchmarking
Despite recent volatility, both markets – L.A. and the Inland Empire – remain in a significantly elevated fundamental position compared to their previous levels. Despite some recent softening, both L.A. and the Inland Empire remain well above pre-pandemic rent benchmarks. While leasing momentum has slowed, overall rent levels continue to signal a market that has reset at a higher baseline.
For owners, investors, and developers, the steeper rise and subsequent correction in the West is not a sign of structural weakness; rather, it’s an indication that the cycle is normalizing. “Long-term, if you had Southern California industrial investments, you generally did well,” Amthor elaborates. “Of course, if you bought at the peak, you experienced that value pullback, but fundamentals are still well above 2019. We’re also seeing more discipline in the underwriting and more scrutiny of deals now, which is good for the long-term stability of the market.”
This is where analytics and benchmarking – powered by ARGUS Intelligence Benchmark Manager – take center stage. “You can look at your market rent or other cash flow metric trends against the broader benchmark,” Johnstone explains, adding that modern analytics tools deliver an important level of granularity to market observation and help answer key questions such as: “How are my investments faring relative to the index? Where are there variances, and what are the drivers behind those differences?”
Benchmarking creates an important feedback loop for portfolio strategy and supports arguments for clients or investors. “Having real-time visibility into these trends helps make more defensible decisions,” shares Johnstone. “It’s not just about what’s happening at a property level, but how external forces and market differences come into play.”
“Transparent data turns what used to be guesswork into actionable strategy, especially in markets like L.A. and the Inland Empire where patterns don’t always mirror national trends,” adds Amthor. Ultimately, it’s about being able to say, ‘Here’s where we outperformed, here’s where we lagged, and here’s the why behind it all.’

Unlock market-level intelligence for superior investment decisions
Compare your portfolio's performance against benchmarks for improved decision-making.
Unlocking opportunity with advanced analytics
Even amid a recent correction, the Inland Empire and Los Angeles remain two of the nation’s highest-performing industrial submarkets; fundamentally altered, and still elevated, compared to pre-pandemic baselines.
For discerning investors, today’s shifting environment is rich with opportunity, particularly for those wielding robust analytics, peer benchmarking, and a nuanced understanding of local market drivers. With modern tools and quality data at the ready, stakeholders can identify areas of strength, anticipate pockets of risk, and position themselves to capitalize on both immediate prospects and lasting growth in any market.
Want to be notified of our new and relevant CRE content, articles and events?
Authors

Sally Johnstone
Senior Manager, Advisory

Mike Amthor
Director, Performance Analytics
Authors
Sally Johnstone
Senior Manager, Advisory
Mike Amthor
Director, Performance Analytics
Resources
Latest insights