Key highlights
In Q2 2025, median pricing for retail, office, and hospitality properties converged around $140 per square foot; beneath that surface-level alignment, subsector pricing performance remains highly uneven
Pricing for automotive-related real estate shifted from long-standing discounts to premiums, while restaurants and bars continue to command a roughly 70% premium over strip centers
Medical office properties maintain a large premium of more than 50% over general office, supported by demographic demand and tenant stability
Full-service hotels, once priced below limited-service, now trade at premiums due to constrained new supply and stronger rebounds in urban and resort markets
Subsector performance tells a nuanced story for hospitality, retail, and office property sectors
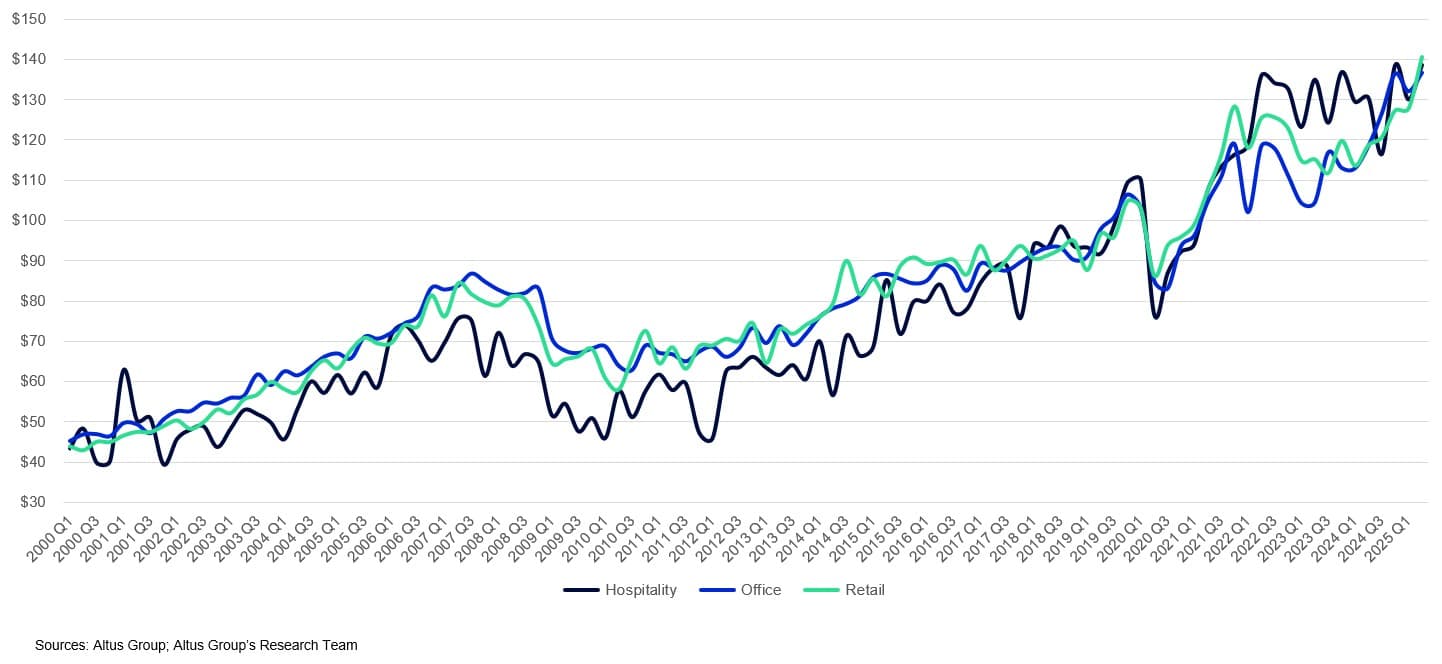
Retail, office, and hospitality pricing converged in Q2 2025, each near $140 per square foot
Convergence masks different recovery paths since the pandemic
All three sectors posted solid quarterly and annual gains
From the late 2010s through the pandemic, median single-asset pricing for service-oriented CRE sectors (hospitality, retail, and office) moved in lockstep on a per-square-foot basis. But by 2022, as pent-up consumers returned to shops and hotels far faster than workers returned to offices, a hierarchy became clear: hospitality at the top, followed by retail, with office lagging.
But by Q2 2025, that gap closed, with the three property types converging back to nearly identical levels: $141 for retail, $137 for office, and $139 for hospitality. All three sectors also posted solid quarterly and annual gains.
Median price per square foot for service-oriented CRE sectors
But the headline symmetry is slightly misleading: beneath it, subsector trajectories have split in response to demographics, consumer preferences, and supply dynamics. Drawing on Altus Group’s Q2 2025 US CRE Investment and Transactions Quarterly report, this article explores those divergences.
Retail property subsector premiums widen
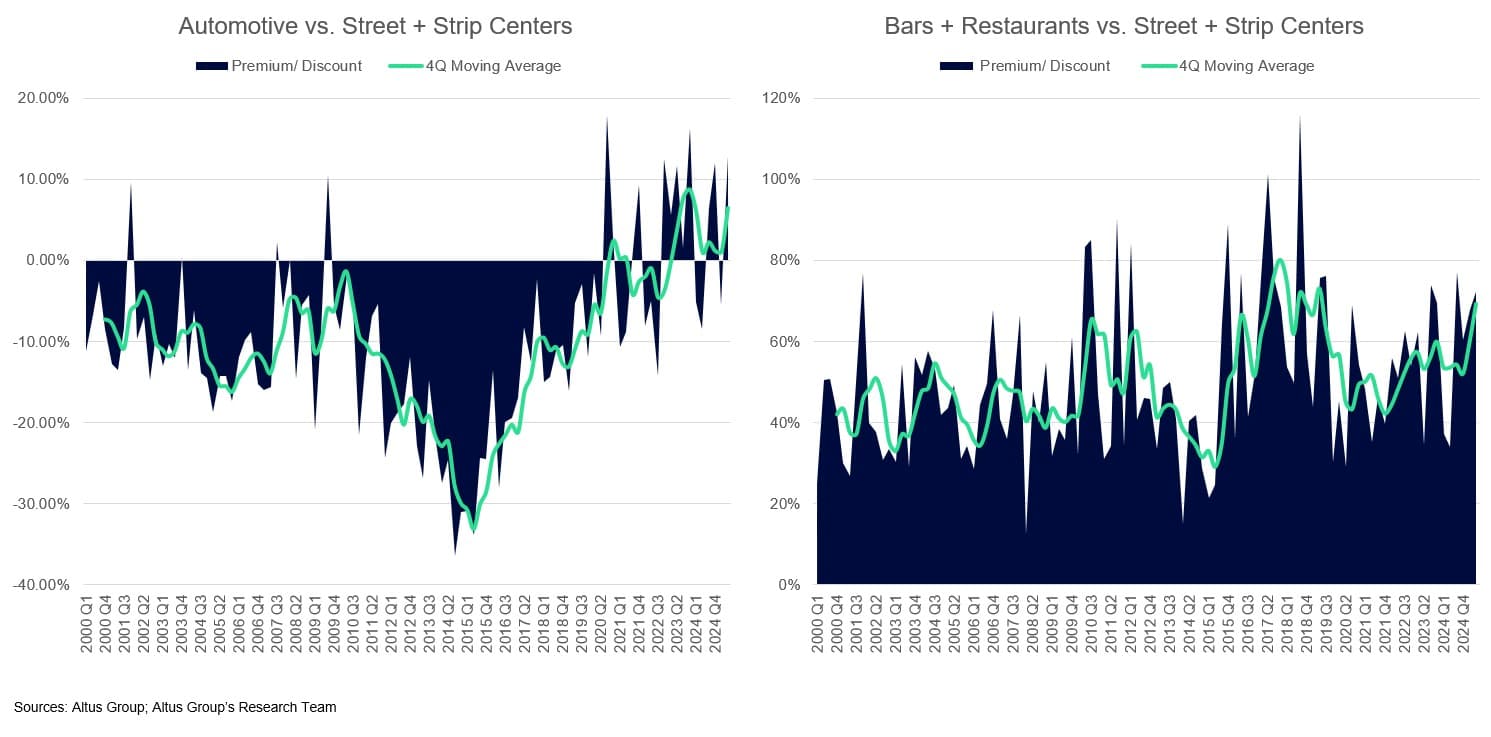
Retail subsectors surged, led by automotive (+36.6% YoY) and restaurants (+42.2% YoY)
Automotive real estate has flipped from long-time discounts to consistent premiums over strip centers
Restaurants and bars sustain a ~70% premium, reflecting prime locations and tenant resilience
Retail has seen some of the sharpest subtype-level shifts. Sector-wide price increases were solid in Q2 (+18.5% YoY), but the paths of two particular sectors – automotive and restaurants – stand out, up 36.6% and 42.2% over the same period.
Median sale price per square foot
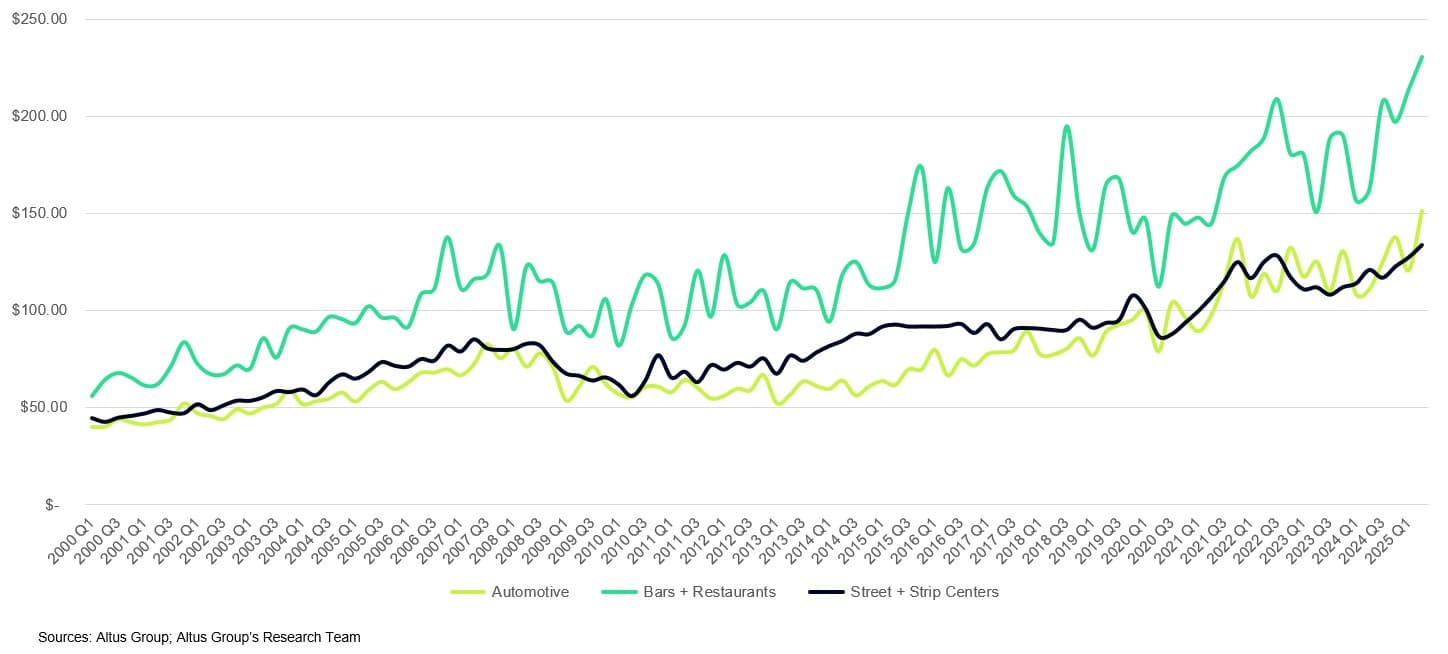
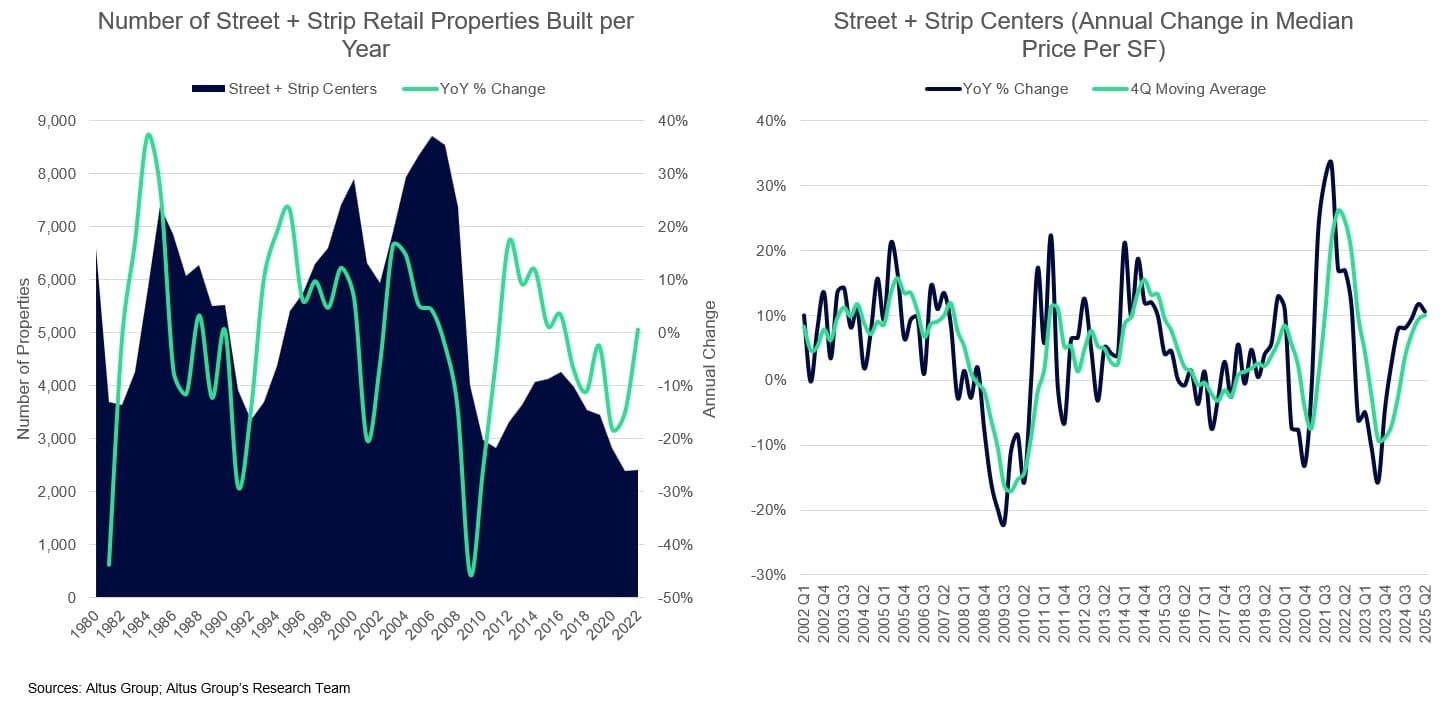
Freestanding automotive assets (gas stations, dealerships, service centers) once traded at a steep discount to retail strip centers (“Street + Strip Centers” in charts). That gap widened after the Global Financial Crisis (GFC), when strip retail pricing rebounded as consumer spending recovered and new construction moderated. But starting in the late 2010s, fortunes flipped, and by the pandemic, automotive sites often sold at premiums to strip centers - buoyed by resilient repair and fuel stations, the security of long leases, and insulation from e-commerce disruption.
Number of street + strip retail properties built per year | Annual price change for transacted street + strip center
Restaurants and bars have charted a similarly distinctive path. With prime locations, corporate guarantees, and tenant demand resistant to digital substitution, freestanding establishments have long commanded premiums over strip centers on a per square foot basis. Their average premium held near 40% between 2000 and 2010, rose briefly after the GFC, then dipped around 2015. By 2017, it surged to a record 80%. Pandemic volatility briefly pulled the premium below 50%, but it has since rebounded and now sits near 70%.
Automotive vs. strip retail premium/discount | Bars & restaurants vs. strip retail premium/discount
Medical office property pulls away
Medical office continues to outpace general office, now holding a 54% premium
Demographic demand (aging population, outpatient care) underpins steady pricing growth
Long leases and costly tenant buildouts drive stability, with limited new supply reinforcing premiums
The office sector has fractured into two very different tracks. Medical office has steadily pulled away from traditional office space since the financial crisis.
Office subtype pricing – Median $/SF
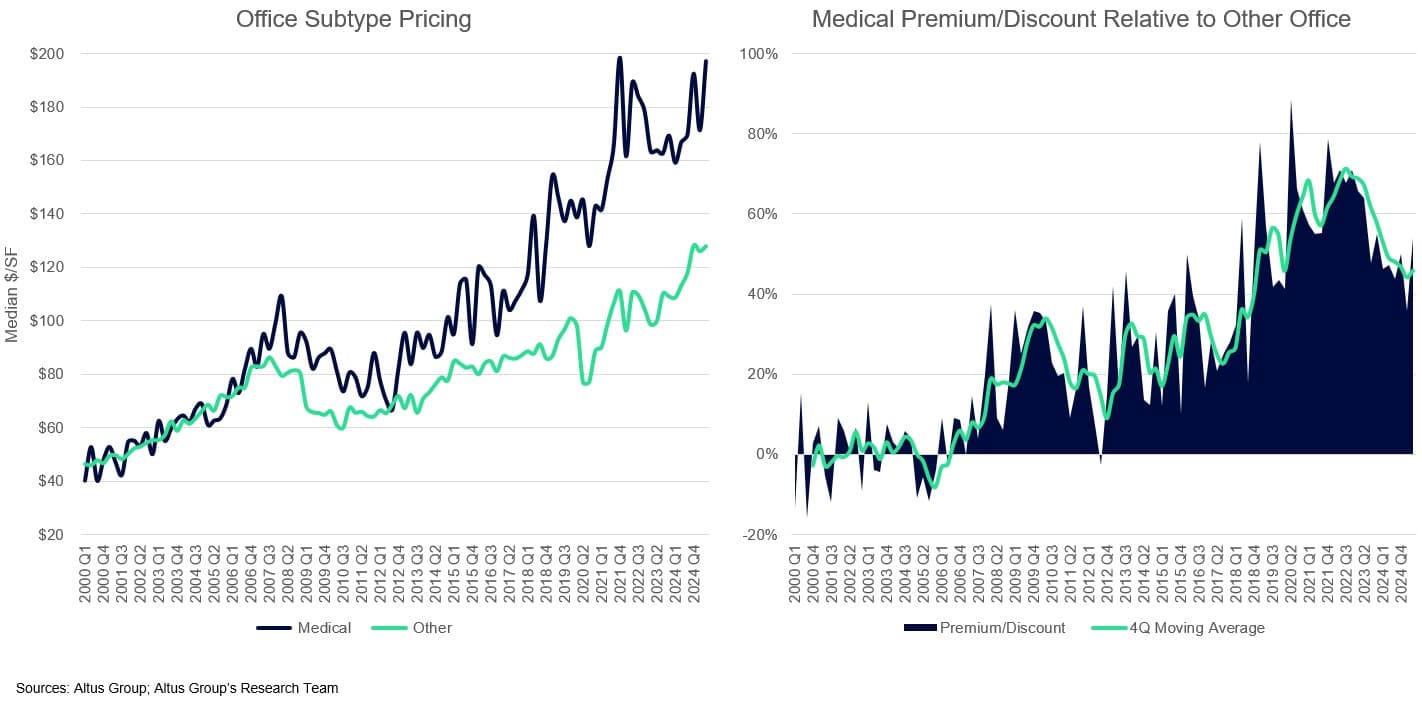
Before 2008, the median medical and general office buildings sold at a similar price per square foot. But after a steady run, medical office commanded an 89% premium at the onset of the pandemic – the widest on record. While that spread has since narrowed, it still sits at a robust 54% as of Q2 2025. Over the past decade, median medical office pricing has climbed nearly 60%, well ahead of general office growth.
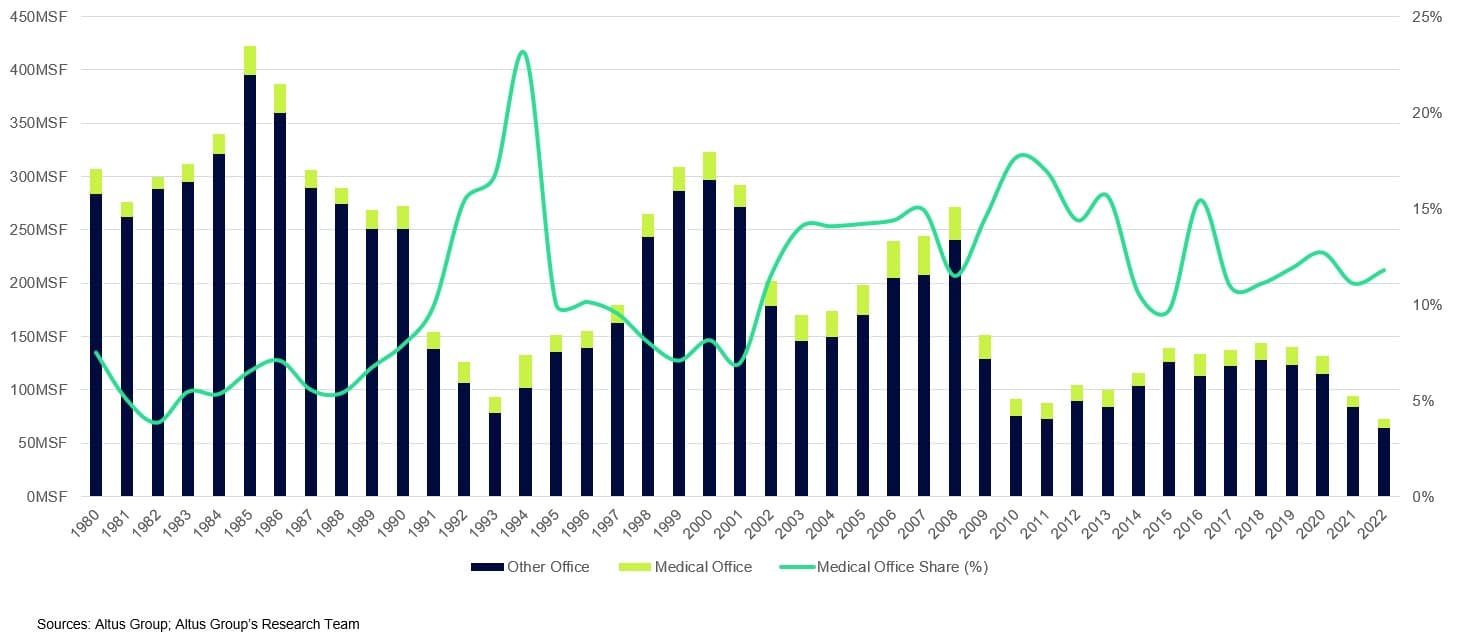
This resilience is rooted in part in structural demand. An aging population fuels steady growth in outpatient care, while medical office tenants make significant buildouts, sign long leases, and seldom relocate. In contrast, general office continues to face headwinds from remote work, downsizing, and persistent uncertainty. The result is a defensive niche where medical office stands out as a reliable outperformer. Given that its share of total office construction has barely increased over the past 25 years, the premium may have room to widen further.
Office square footage built per year since 1980
Full-service hospitality assets maintain the lead
Full-service hotels, once discounted, now trade at premiums over limited-service properties
Premium peaked above 30% in 2023, still well above long-term averages
Constrained construction and strong post-pandemic travel boosted asset values, especially in urban/resort markets
Hospitality tells a story of reversal. Before the GFC, the median full-service hotel sold at a discount to limited-service properties. Since 2010, the opposite has been true, with the premium steadily increasing for the past 15 years. From 2000 to 2009, the average discount for full-service properties relative to limited-service properties was 12.4%; the average premium from 2010 to 2025 was 14.5%.
Hospitality subtype pricing – Median $/SF | Full service vs. limited service hotel premium/discount
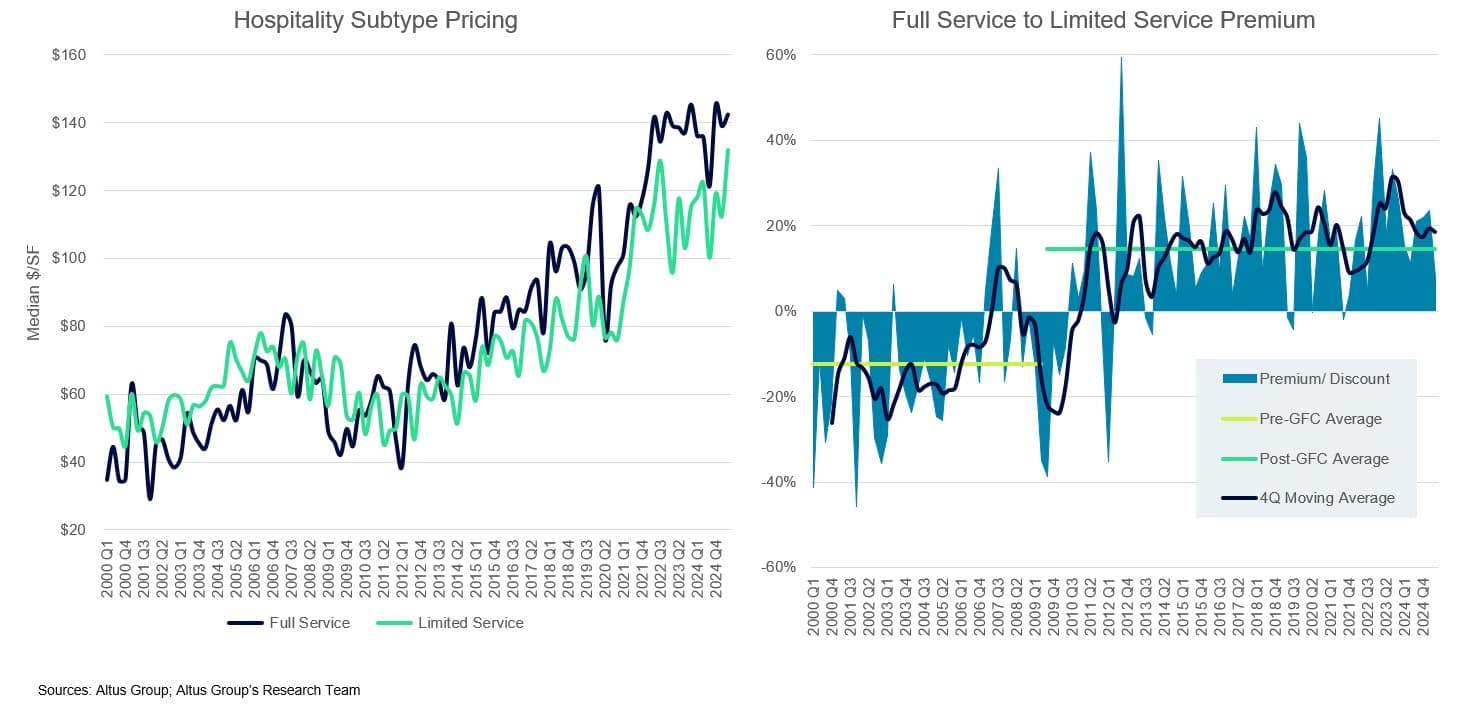
In fact, after a short drop, the premium for full-service hotels widened dramatically after the pandemic, peaking above 30% in Q3 2023 – the highest on record. While it has since narrowed, it remains above long-term averages.
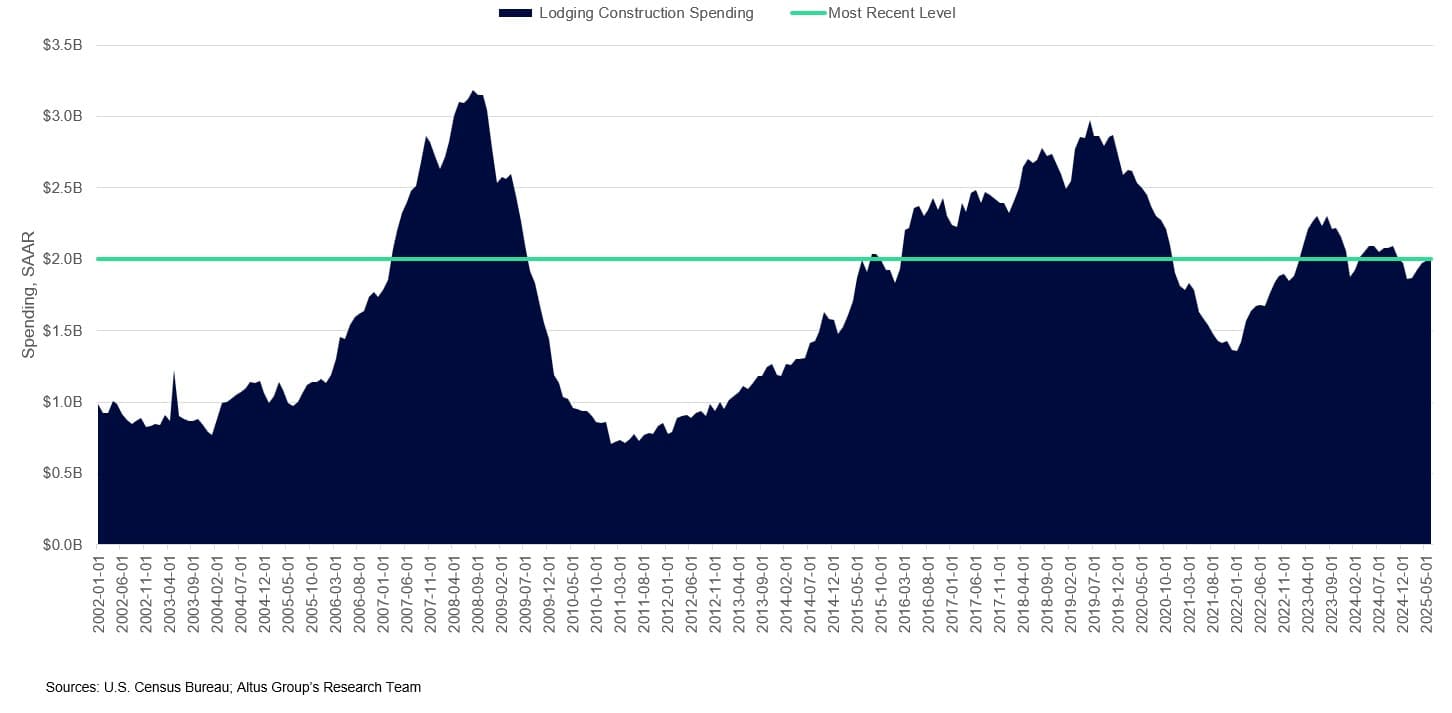
Supply is a key factor here as well: Hotel construction slowed sharply after 2008 and never recovered, even on an inflation unadjusted basis. With fewer new full-service projects, existing assets became scarcer and thus more valuable. And when post-pandemic travel rebounded in 2021–2022, urban and resort full-service properties captured disproportionate demand.
Construction spending on lodging
Beneath the surface
The median retail, office, and hospitality deal may look aligned on a per-square-foot basis, but that convergence masks major shifts within subsectors. The story cannot entirely be reduced to sector-wide narratives like a consumer rebound, return to office, or a focus on trophy assets. Price movements in smaller segments such as restaurants, automotive, medical office, and full-service hotels exert meaningful upward pressure on overall sector medians. These dynamics have long defined service-oriented CRE and they continue to shape where opportunities emerge as the economy evolves.
For deeper insights into transaction activity, pricing patterns, and metro-level trends, explore the latest edition of the Altus Group Research Team’s US CRE Investment and Transactions Quarterly report.

Disclaimer
This publication has been prepared for general guidance on matters of interest only and does not constitute professional advice or services of Altus Group, its affiliates and its related entities (collectively “Altus Group”). You should not act upon the information contained in this publication without obtaining specific professional advice.
A number of factors may influence the performance of the commercial real estate market, including regulatory conditions and economic factors such as interest rate fluctuations, inflation, changing investor sentiment, and shifts in tenant demand or occupancy trends. We strongly recommend that you consult with a qualified professional to assess how these and other market dynamics may impact your investment strategy, underwriting assumptions, asset valuations, and overall portfolio performance.
No representation or warranty (express or implied) is given as to the accuracy, completeness or reliability of the information contained in this publication, or the suitability of the information for a particular purpose. To the extent permitted by law, Altus Group does not accept or assume any liability, responsibility or duty of care for any consequences of you or anyone else acting, or refraining to act, in reliance on the information contained in this publication or for any decision based on it. The distribution of this publication to you does not create, extend or revive a client relationship between Altus Group and you or any other person or entity. This publication, or any part thereof, may not be reproduced or distributed in any form for any purpose without the express written consent of Altus Group.
Author

Cole Perry
Associate Director of Research, Altus Group
Author
Cole Perry
Associate Director of Research, Altus Group
Resources
Latest insights