Canadian office market update - Q4 2025
Our Q4 2025 update on the Canadian office market, including availability rate, completions, and under-construction data.

Key highlights
Source: Altus Data Studio market data and analysis
The national office availability rate declined by 140 basis points year-over-year to 16.0%, driven by increased demand for Class AAA office space and a significant reduction in new office construction
Despite having the highest availability rate at 19.8%, Calgary saw a significant year-over-year improvement, with a 210 basis point decrease, indicating strong recovery momentum for the market
Quebec City’s office availability rate increased by 170 bps year-over-year to 13.9%, representing the largest increase among Canada’s office markets
The national office construction pipeline is at a multi-year low, with total square footage under construction at 3.1 million, with only 24% of the space available for lease
The lack of new supply is expected to force a strategic shift in the office sector, driving investment from new construction toward the repositioning of existing assets as property owners aim to capitalize on demand by modernizing older Class A and some Class B properties in smaller markets
In the fourth quarter of 2025, the national office availability rate contracted, settling at 16.0%
The Canadian office market demonstrated promising recovery momentum in the fourth quarter of 2025, overcoming prevailing disruptions, including shifting workplace preferences, the implementation of return-to-office mandates, more efficient space planning, and weakened labour market conditions earlier in the year. This recovery was characterized by significant improvements in key metrics.
National availability and sublet contraction
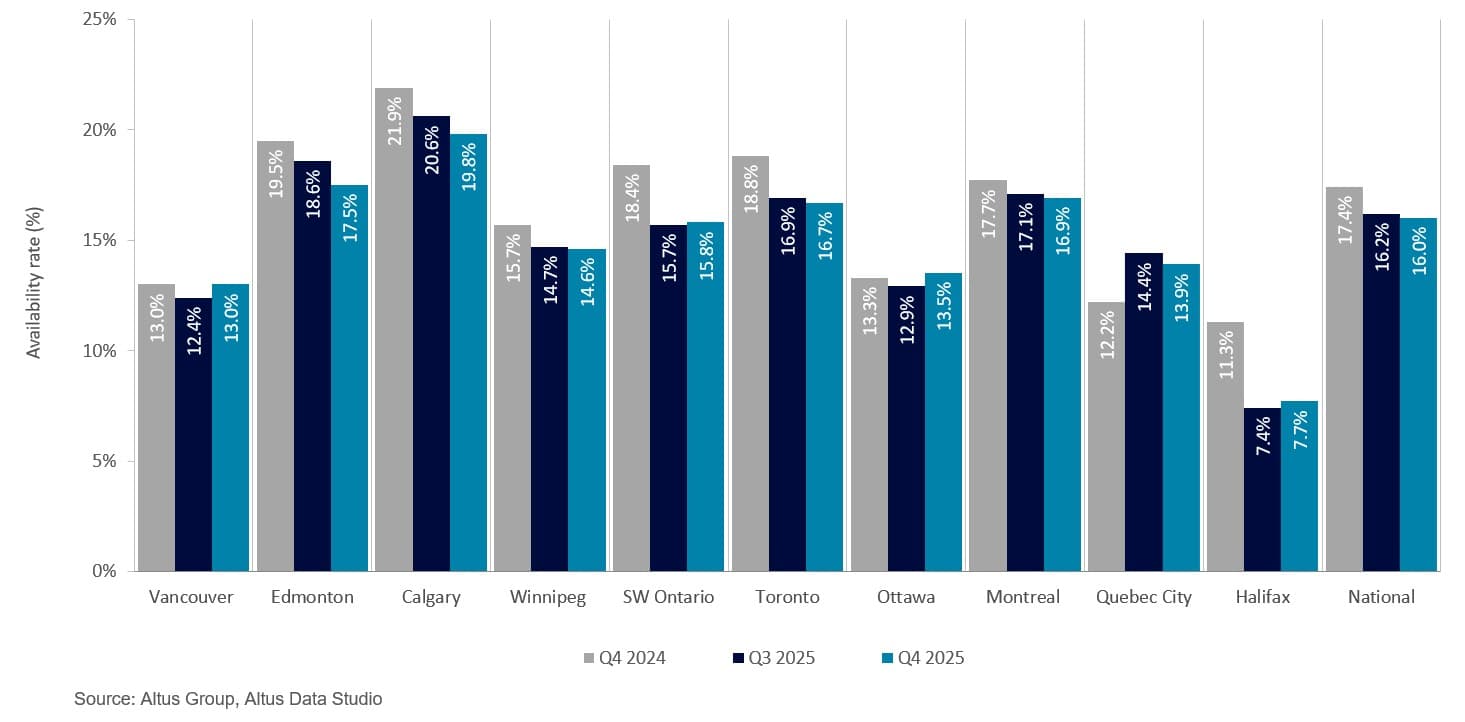
According to analysis from Altus Data Studio, the national office availability rate contracted by 140 basis points (bps) year-over-year to 16.0% in the fourth quarter of 2025 (Figure 1). Furthermore, the sublet availability rate continued to decline for the sixth consecutive quarter, reaching 2.1%. This consistent downward trend provided a clear indication of market stabilization. The reduction in both the overall availability and sublet rates was primarily attributed to heightened tenant demand for high-quality office space and a concurrent contraction in new office construction.
Figure 1: Office availability rate (Q4 2024 vs. Q3 2025 vs. Q4 2025)
The “flight-to-quality” and market bifurcation
The “flight-to-quality” trend has continued to profoundly shape the Canadian office market, as occupiers have placed greater value on high-quality spaces that offer modern amenities, superior infrastructure, and are located in easily accessible, desirable areas.
This trend not only underscored the widening disparity between premium Class A properties and the older Class B stock but also exacerbated the augmentation within the Class A category itself. Specifically, the distinction between standard Class A and top-tier Class AAA (trophy) buildings became more pronounced. Class AAA assets frequently commanded more competitive rental rates and experienced significantly lower vacancy rates. This reflected the surging corporate interest for spaces that prioritized features such as improved mechanical infrastructure (e.g., enhanced HVAC systems), wellness-focused amenities (e.g., fitness centres), purpose-built collaborative workspaces, and sustainability retrofits (e.g., energy efficiency improvements), all viewed as essential tools for attracting and retaining talent amidst prevailing hybrid work preferences.
Repositioning and broadened tenant search
With tenant demand for trophy assets exceeding the supply of Class AAA space, the market became increasingly bifurcated. Combined with a limited construction pipeline, this shifted attention toward re-elevating and repositioning older Class A and select Class B office assets. As the supply of Class AAA dwindled, tenants were compelled to broaden their search beyond the highest-end segment, often due to a lack of available contiguous space or budgetary constraints. This market pressure necessitated property owners of older assets to invest significantly in capital improvements. The goal of this repositioning was to upgrade the property’s amenity profile and systems to better compete with newer stock, thereby arresting the functional obsolescence of these assets and capturing the secondary wave of demand from tenants whose needs or budgets could not be met by the tight Class AAA market.
National and major market performance
A closer examination of major Canadian office markets revealed distinct regional differences in performance, highlighting the impact of local economic drivers, government policy, and structural conversion efforts.
Halifax’s availability rate continued to contract, posting the country’s tightest availability rate at 7.7%, down 360 bps year-over-year. This performance was largely a result of the province’s specialized economic base. As Nova Scotia houses a significant portion of Canada’s military and naval assets, the Liberal government’s planned increase in defence investment may further tighten rates by accelerating recruitment efforts and revitalizing existing infrastructure, thereby increasing associated professional employment and office utilization.
Conversely, Calgary recorded an availability rate of 19.8%, the highest nationally. However, this figure warrants a more nuanced interpretation, as availability declined significantly year-over-year by 210 bps. This substantial reduction indicated that strong recovery efforts in the city’s office sector, primarily through its Downtown Development Incentive Program (DDIP), have proven successful. This program incentivized the conversion of underutilized office space into residential, mixed-use, and other productive projects, effectively reducing available office inventory and contributing to the market’s rebalancing. By the fourth quarter of 2025, the city had announced nine additional conversion projects, bringing the program's total to 21 conversions supported by $805 million in municipal investment, which was estimated to remove approximately 2.7 million square feet of office space from the market’s inventory.
Vancouver and Ottawa reported availability rates of 13.0% and 13.5%, respectively, with the latter having experienced a marginal year-over-year increase. Vancouver’s availability rate has plateaued year-over-year, and this flattening was primarily attributable to the Vancouver Periphery, where the availability rate saw a notable increase of 150 bps to 14.4% year-over-year. This spike was driven by the introduction of fully vacant spaces into the market inventory, specifically from three notable buildings: the Class C The Standard Building and Main Alley – M3, and the Class A Renfrew Business Centre – Phase 1. The latter two properties were located within the Vancouver Periphery submarket and contributed directly to the area’s elevated vacancy.
Ottawa’s availability rate increased by 20 bps year-over-year and stubbornly held between 12% and 14%. This trend was predominantly driven by shadow vacancies entering the market. These spaces represented leased office space that a tenant was not officially “occupying”, thereby masking the true amount of unused space in the market. Furthermore, the Public Services and Procurement Canada's (PSPC) original plan to offload half of its surplus office space has been hindered by the government’s effort to increase in-office work. Consequently, the volume of planned disposals was revised downward, with approximately 33% of surplus space now planned for sale or lease.
Meanwhile, Toronto’s availability rate reached 16.7%, decreasing by 210 bps year-over-year, and Montreal posted 16.9%, down 80 bps. Both markets observed consistent year-over-year decreases in their availability rates, reflecting the strength of their economic bases, the strong enforcement of return-to-office mandates, and the absence of new construction during the quarter, which facilitated the absorption of existing vacancies.
Quebec City’s office availability rate increased by 170 bps year-over-year to 13.9%, representing the largest increase among office markets. The national “flight-to-quality” trend was less evident here, with a stronger preference for Class B properties, which have an availability rate of 11.3%, compared to 17.7% for Class A. This preference for Class B office space stemmed from the market’s specific tenant profile, which included a smaller corporate presence and more tenants seeking cost-effective options. These tenants often favoured the less central locations with ample free parking, common in Class B buildings. This market dynamic highlighted that local economic factors and tenant profiles significantly influenced the city’s real estate trends, often diverging from national patterns.
Employment and the office market
The Canadian labour market exhibited signs of moderation during the latter half of 2025, characterized by incremental employment gains that failed to keep pace with a rising national unemployment rate. While the final quarter of the year initially followed three consecutive months of employment gains, the year concluded with a softened labour landscape as the increase in active job seekers outpaced total job creation.
According to Statistics Canada’s Labour Force Survey (LFS) for December 2025, national employment remained relatively stable with a marginal increase of 8,200. Concurrently, the unemployment rate rose by 0.3 percentage points to settle at 6.8%. This upward trend was primarily attributed to an influx of 81,000 entrants into the labour force, the majority of whom were not immediately absorbed by new employment opportunities
Sectoral performance remained mixed throughout the month. Employment gains were concentrated in health care and social assistance, which added 21,000 jobs, and in ‘other services’ such as personal and repair services. Conversely, notable declines were recorded in professional, scientific, and technical services, accommodation and food services, and utilities.
Regionally, Quebec recorded the most pronounced employment increase, marking the first significant gain since June 2025. In Western Canada, employment decreased in Alberta, partly offsetting the gains recorded in November. Employment also fell in Saskatchewan in December. Meanwhile, Ontario saw little change in employment for the second consecutive month, although its provincial unemployment rate rose significantly to 7.9%.
These labour market fundamentals remained highly relevant to the Canadian office market as a primary indicator of demand for commercial space. While the broader recovery in late 2025 established a foundation of cautious optimism, the contraction in office-using sectors, specifically professional and technical services, in December suggested a weakening in near-term demand for this particular sector.
Furthermore, this positive momentum remained structurally challenged by two powerful forces. The enduring preference for hybrid work and space efficiency among major corporations continued to structurally limit the total volume of space required per employee, effectively decoupling job gains from traditional office occupancy rates. Additionally, the moderation of population growth, particularly within the immigrant and non-permanent resident categories, was projected to dampen the long-term rate of new workforce expansion, thereby limiting the fundamental driver of new office demand.
National office completions and new supply dynamics
Canada saw the completion of four new office buildings, totalling approximately 644,000 square feet, with all new supply concentrated exclusively in British Columbia. Of the newly completed space, only 6.5% remained available for lease, signalling mounting interest in modern, high-quality office space. The concentration of new supply in Vancouver temporarily tempered the decline in availability rates. In contrast, the absence of new supply in Toronto and Montreal accelerated absorption and contributed to the general downward trend in their availability rates.
National office construction pipeline
The national office construction pipeline recorded 17 office buildings under construction, comprising nearly 3.1 million square feet. This figure represented a multi-year low in construction activity, underscoring a pronounced slowdown in new supply coming to market. Of this limited supply, 24.4% remained available for lease, indicating sustained, albeit selective, pre-leasing demand for new inventory prior to completion (Figure 2).
Figure 2: Office Under Construction (Q4 2025)
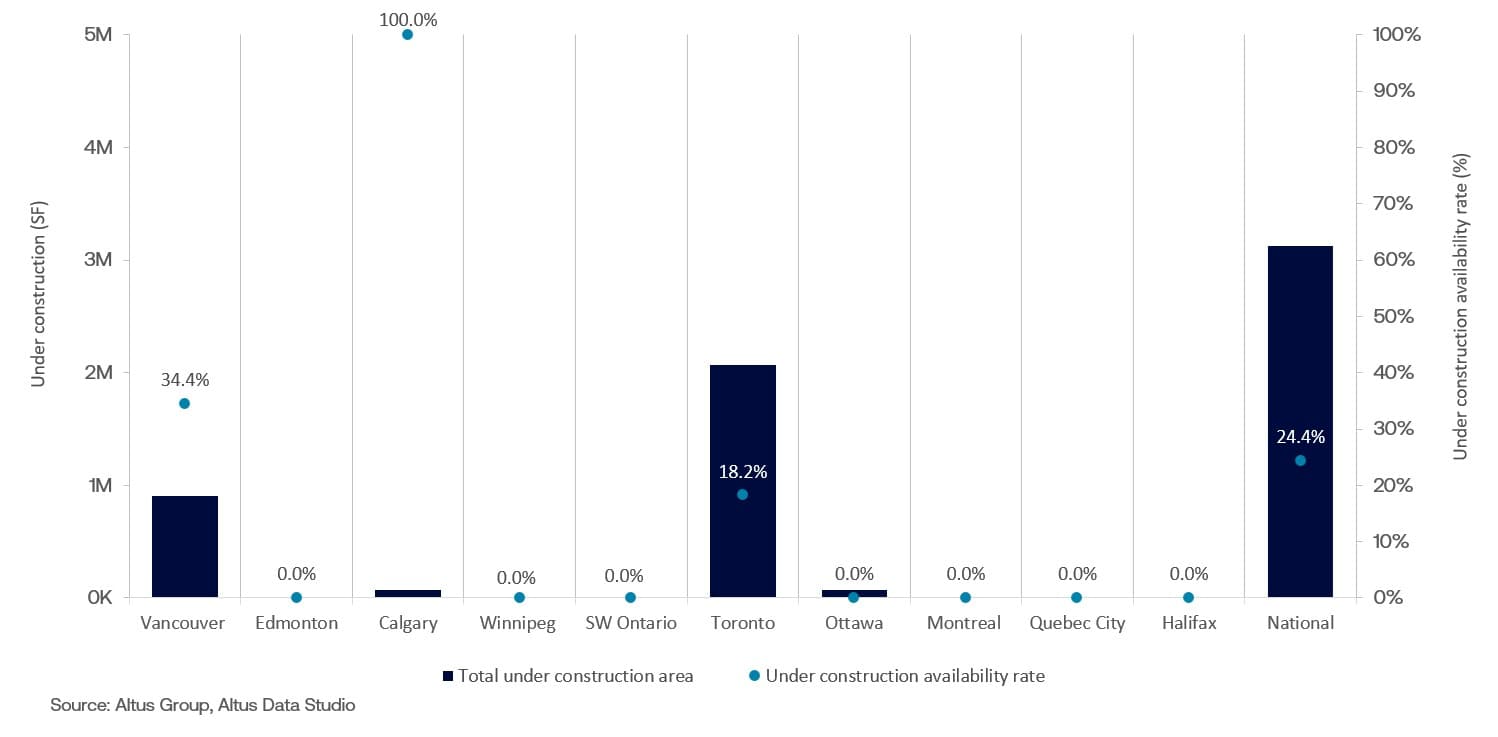
Vancouver and Toronto remained the epicentres of office development activity, collectively accounting for the dominant share of the nation’s ongoing construction. Vancouver has eight office buildings under construction, totalling nearly 910,000 square feet, with 34.4% of the space available for lease. Meanwhile, Toronto has seven office buildings, totalling nearly 2.1 million square feet. Toronto’s office market demonstrated stronger tenant interest, with only 18.2% of the space available for lease.
The continued contraction of the new office development pipeline presented a significant challenge for tenants seeking premium contiguous office space. The increasing demand for Class AAA spaces has spilled over into the older, well-maintained Class A office buildings and, in smaller markets or for smaller requirements, Class B assets. This shift coincided with increasing occupancy and lower vacancy rates for these existing buildings, as tenants, by necessity, broadened their search beyond the dwindling supply of new Class AAA inventory to fulfill their space requirements. This market rebalancing ultimately indicated a strategic shift from a “build-new” approach to a “reposition-existing” market, where capital investments shifted towards the strategic upgrading of older properties to meet modern tenant demands.
Looking ahead
The Canadian office market’s performance in the fourth quarter of 2025 demonstrated a cyclical recovery that solidified a foundation of optimism entering 2026, primarily through the successful absorption of existing vacancies and enforcement of return-to-office policies in several major markets. This stability, however, was framed by enduring structural challenges and a fundamental market shift. Looking ahead, the sector’s trajectory will be defined by its ability to navigate three critical factors:
Long-term demand will be set by the equilibrium of hybrid work and space efficiency, maintaining pressure on overall space utilization
The multi-year low in the national construction pipeline is projected to be the single most potent factor supporting the market through 2026 and 2027, as the lack of new supply could force occupiers to compete for existing, premium space, thereby sustaining the decline in Class A and B availability rates
The market is undergoing a fundamental shift from a “build-new” model to a “reposition-existing” model
The future competitive landscape will be transformed by the success of property owners in revitalizing older Class A and well-maintained Class B assets through targeted investment in infrastructure, wellness amenities, and ESG retrofits, moving the core market narrative from one of raw job growth to one of strategic differentiation and modernization necessary to meet evolving corporate and employee demands.
Want to be notified of our new and relevant CRE content, articles and events?
Disclaimer
This publication has been prepared for general guidance on matters of interest only and does not constitute professional advice or services of Altus Group, its affiliates and its related entities (collectively “Altus Group”). You should not act upon the information contained in this publication without obtaining specific professional advice.
A number of factors may influence the performance of the commercial real estate market, including regulatory conditions and economic factors such as interest rate fluctuations, inflation, changing investor sentiment, and shifts in tenant demand or occupancy trends. We strongly recommend that you consult with a qualified professional to assess how these and other market dynamics may impact your investment strategy, underwriting assumptions, asset valuations, and overall portfolio performance.
No representation or warranty (express or implied) is given as to the accuracy, completeness or reliability of the information contained in this publication, or the suitability of the information for a particular purpose. To the extent permitted by law, Altus Group does not accept or assume any liability, responsibility or duty of care for any consequences of you or anyone else acting, or refraining to act, in reliance on the information contained in this publication or for any decision based on it. The distribution of this publication to you does not create, extend or revive a client relationship between Altus Group and you or any other person or entity. This publication, or any part thereof, may not be reproduced or distributed in any form for any purpose without the express written consent of Altus Group.
Authors

Jennifer Nhieu
Senior Research Analyst

Ray Wong
Vice President, Data Solutions
Authors
Jennifer Nhieu
Senior Research Analyst
Ray Wong
Vice President, Data Solutions
Resources
Latest insights