Canadian industrial market update - Q1 2026
The national availability rate reached 6.2%, a 40 bps year-over-year increase driven by the delivery of several large-scale projects that outpaced leasing velocity.
Key highlights:
Source: Altus Data Studio market data and analysis
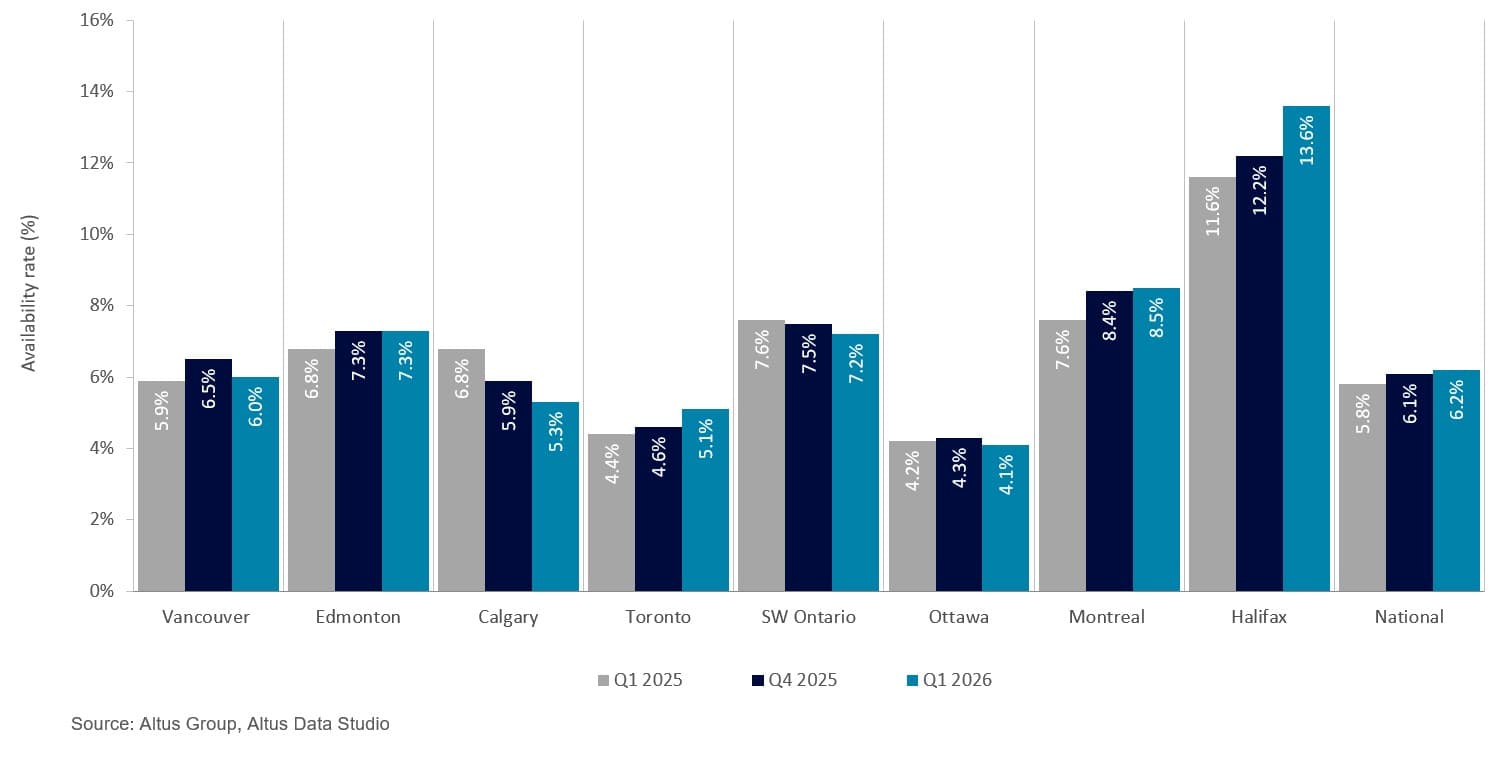
Canada’s national industrial availability rate increased by 40 basis points (bps) year-over-year to 6.2%
Ottawa reported the nation’s lowest availability at 4.1%, while Halifax’s availability was the highest at 13.6%
Selective tenant demand and a short-term oversupply caused rental rate appreciation to plateau or enter a downward trajectory in specific submarkets, shifting leverage toward well-capitalized occupiers
National construction completions saw a notable decrease, with the delivery of 18 new industrial buildings adding approximately 2.2 million square feet to the national inventory
National industrial construction pipeline comprised 109 active projects, representing an aggregate of 21.3 million square feet of future inventory, of which 50% remained available
The national industrial availability rate increased year-over-year to 6.2% in the first quarter of 2026
The Canadian industrial sector entered a period of stabilization in the first quarter of 2026 as the market continued to digest the significant supply wave of previous years. Investor sentiment shifted toward a “flight-to-quality” strategy, with narrowing bid-ask spreads as cap rates plateaued around 6.0%. While the upcoming mandatory review of the Canada-United States-Mexico (CUSMA) agreement in July remains a macro risk wildcard, the market has largely priced in these trade uncertainties and is focusing instead on stabilizing fundamentals.
Based on a market analysis conducted using data from Altus Data Studio, the national availability rate reached 6.2%, a 40 basis point (bps) year-over-year increase. The rise was primarily driven by the delivery of several large-scale speculative projects that outpaced current leasing velocity. Despite this upward pressure, average national net asking rates have found a sustainable floor at the $16 per square foot range, as a rebound in net absorption for high-spec functional assets begins to counterbalance the active development pipeline.
Figure 1: Industrial availability (Q1 2025 vs. Q4 2025 vs. Q1 2026)
Regional performance and market disparities
Regional performance across Canada’s industrial sectors revealed significant disparities during the first quarter of 2026, driven by a combination of new supply deliveries and shifting occupier strategies. In Toronto and Vancouver, availability rates reached 5.1% and 6.0%, respectively. Despite both markets recording three consecutive quarters of positive net absorption, this steady demand was insufficient to offset the influx of new inventory. Toronto’s imbalance was primarily due to stagnant pre-leasing of new completions and a cautious stance by major occupiers reassessing their operational footprints. Similarly, Vancouver's decade-high availability was compounded by “stacked” multi-level deliveries and an elevated sublease inventory of 1.7 million square feet, as firms sought to mitigate holding costs.
Montreal’s availability rate climbed to 8.5%, driven by waning tenant demand and the departure of major occupiers like Amazon. The market saw a pronounced disconnect in the large-bay segment, where diminished interest in massive distribution blocks left significant square footage vacant. Regional stability was further tested by ongoing trade disputes that disproportionately impacted the steel, aluminum, and lumber sectors, industries that serve as cornerstones of the Quebec economy, thereby cooling expansion sentiment among manufacturing and logistics cohorts.
Conversely, Southwestern Ontario observed a 40 bps year-over-year decrease in availability to 7.2%. While primary hubs like Toronto grappled with speculative supply shocks, this region benefited from disciplined supply management and a strategic shift in tenant strategy. The market’s lower barrier to entry and resilient manufacturing base allowed it to reach a state of equilibrium more rapidly than its larger counterparts. By maintaining a stable balance between new construction and consistent tenant interest, Southwestern Ontario avoided the volatility seen in the broader national landscape.
Halifax maintained the highest availability rate among the major Canadian industrial hubs, reaching a record high of 13.6%. Unlike regions driven by construction cycles, Halifax’s peak stemmed from a subdued demand environment struggling to absorb existing inventory. As a thin market, Halifax is uniquely sensitive to single-asset changes, particularly significant direct vacancies in submarkets like Bayers Lake that materially shift regional data in a way that would be negligible in larger hubs. This elevated availability was not a product of overbuilding or a secondary sublease market, but rather a fundamental inability to absorb existing direct vacancies. This characterized a period of significant structural adjustment as physical goods consumption temporarily decoupled from the region’s robust population growth.
National supply dynamics and inventory trends
National supply dynamics recorded a notable decrease in construction completions during the first quarter, as the delivery of 18 new industrial buildings added approximately 2.2 million square feet to the national inventory (Figure 2). Although approximately 71% of this newly delivered space remained available at the end of the quarter, the total volume reflected a deliberate moderation by developers relative to the historic peaks of 2023 and 2024. This strategic deceleration indicated a broader effort to align future supply with stabilizing demand nationwide.
Figure 2: Industrial completions and availability (Q1 2026)
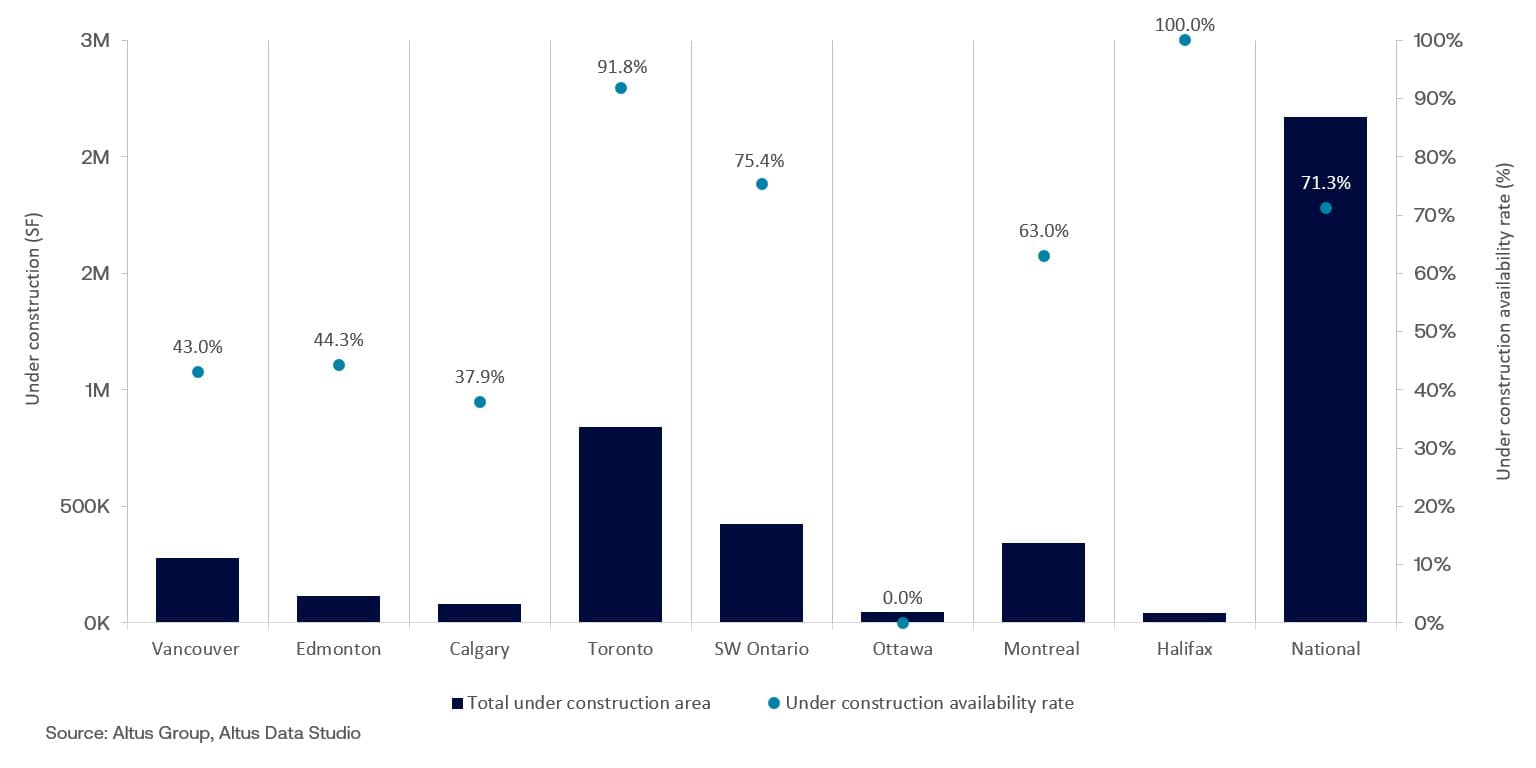
The Greater Toronto Area (GTA) saw a transition in industrial supply during the first quarter of 2026, as the market began absorbing the influx of speculative deliveries from the previous year. Following a period where over 20 buildings reached completion, first-quarter activity moderated to three properties totalling nearly 841,000 square feet. Despite this diminished output, nearly 92% of this space remained available for lease, as the market continued to work through uncommitted inventory.
Southwestern Ontario mirrored the national trend of disciplined supply growth, recording three completions that added approximately 424,000 square feet to the regional inventory. Availability for these new deliveries held at approximately 75%, reflecting a transition toward more rigorous underwriting and conservative project timelines. By moving away from the rapid pre-leasing typical of the post-pandemic era, the region focused on maintaining a manageable delivery schedule that aligned with a more selective tenant base.
Vancouver reported four properties totalling approximately 279,000 square feet reaching completion. While 43% of the space remained available for lease, these deliveries largely targeted the industrial condominium and multi-tenant segments. Smaller owner-occupier units within these projects saw rapid uptake as businesses sought long-term operational stability and equity growth within a land-constrained market. The scarcity of available large-bay inventory remained a defining characteristic in the region, forcing larger logistics providers to look toward the periphery, where the few remaining expansive land parcels could still support traditional horizontal distribution centres.
Montreal recorded three completions totalling nearly 342,000 square feet. However, 63% of this recently delivered space remained available at quarter-end, as the region continued to face significant absorption headwinds. This softened demand was particularly evident in the large-bay segment, where the rightsizing of logistics footprints led to a net loss of occupied space. Consequently, the combination of stagnant tenant activity and the delivery of uncommitted speculative projects exerted continued upward pressure on the regional availability rate.
National industrial construction pipeline
The national industrial construction pipeline comprised 109 active projects, totalling 21.3 million square feet of future inventory (Figure 3). Pre-leasing activity for these ongoing developments remained sluggish at approximately 50%, prompting a strategic moderation of new project commencements to prevent further inventory imbalances in oversupplied markets.
Figure 3: Industrial under construction and availability (Q1 2026)
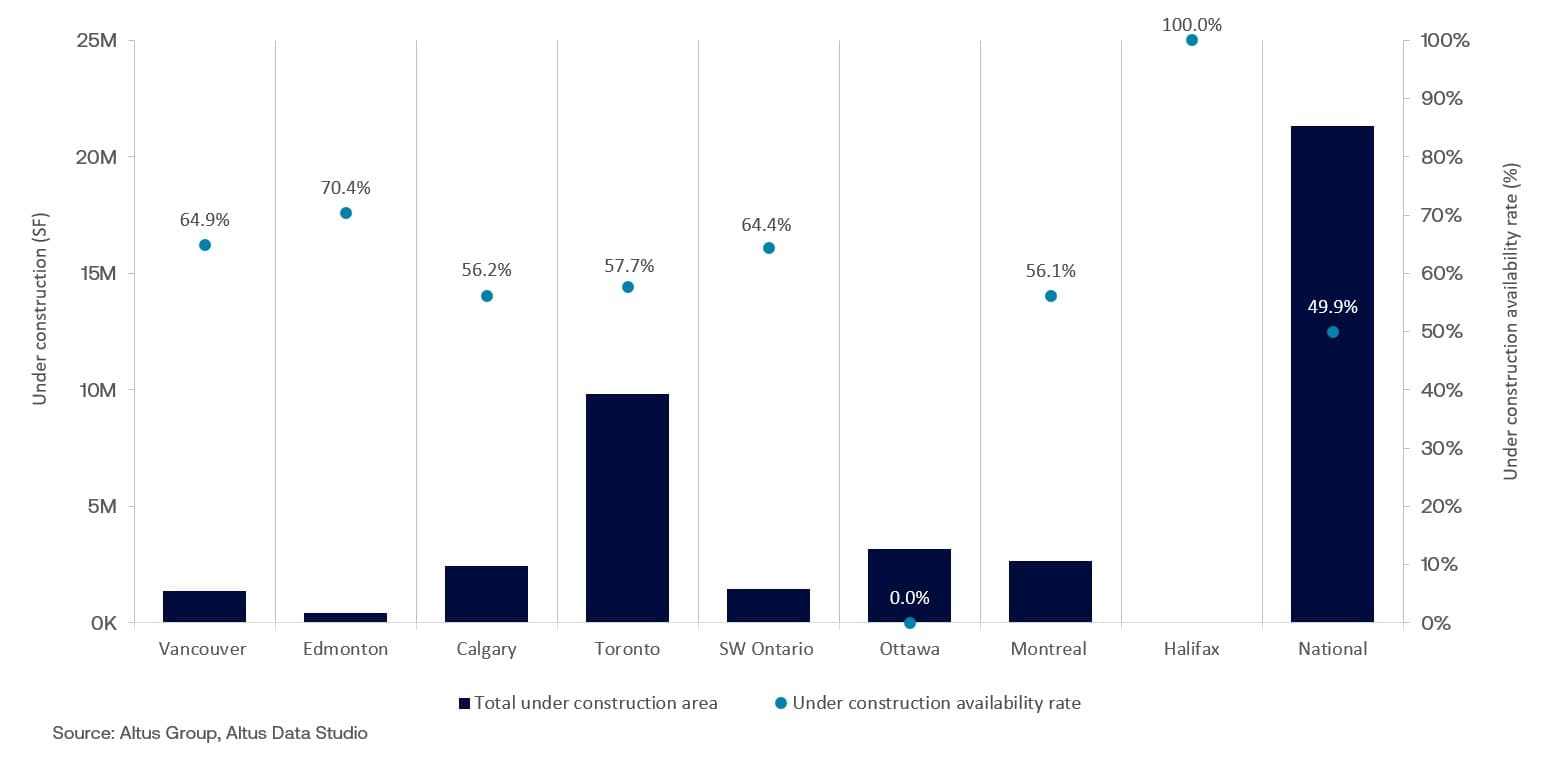
The GTA maintained its status as the nation’s primary hub for industrial development, with 9.8 million square feet actively under construction. Consistent with recent trends, nearly 58% of this pipeline remained available to the market. Given the GTA’s scale as Canada’s largest industrial gateway, this elevated availability indicated that developers continued to utilize speculative models. This strategy reflected measured optimism regarding a potential medium-term market recovery, notwithstanding the temporary softening of tenant demand observed throughout 2025. Development activity focused predominantly on Class A facilities, under the assumption that modern, high-specification assets would be the first to secure occupiers as market conditions improved.
The Vancouver development pipeline comprised 25 industrial buildings, totalling nearly 1.4 million square feet, with approximately 65% of this space remaining available. This contraction in active projects, particularly among large-bay builds, reflected a strategic pivot as tenant demand softened and developers hesitated to break ground on projects without pre-committed tenants. Similarly, Calgary’s pipeline contracted to 2.4 million square feet, marking a deliberate transition toward supply-side discipline following a period of rapid, speculative expansion.
Ottawa’s pipeline is defined by the 3.1 million square foot Amazon fulfillment centre in Barrhaven. Once operational, this facility will become the third Amazon fulfillment centre in Ottawa and the largest of its kind in Canada. This project functioned as a clear indicator of Amazon’s long-term commitment to the region’s distribution infrastructure, establishing it as a primary logistical node situated between Toronto and Montreal.
Montreal’s construction activity remained resilient with 13 buildings totalling 2.6 million square feet under construction, centred largely in the North Shore Laurentides and Laval regions. Despite 56% of this pipeline remaining available, developers maintained long-term conviction in the market’s fundamental need for modern infrastructure. However, with extended periods of negative net absorption observed over the last three years, the delivery of these speculative projects continues to exert upward pressure on regional availability
Navigating future market dynamics
The first quarter of 2026 marked a definitive transition for the Canadian industrial sector, as the market moved from rapid expansion toward a period of supply-side discipline. As availability rates plateaued and tenant demand became increasingly selective, both developers and investors shifted their focus toward the digestion of existing inventory. Looking ahead, a gradual rebalancing is anticipated as the construction pipeline moderates in response to these absorption headwinds. While the substantial volume of uncommitted space in major hubs requires time to be integrated, the sustained interest in Class A, high-specification assets indicates that a “flight-to-quality” trend will remain the primary driver of leasing activity, as developers anticipate that these “future-proofed” assets will be the first to capture the next wave of expansionary demand.
Regional strategies have also evolved to prioritize the long-term efficiency of national logistics networks. The development of high-capacity distribution nodes in secondary markets, alongside vertical intensification in land-constrained urban centres, points toward a more resilient, multi-tiered supply chain. This structural evolution demonstrated that while near-term vacancy fluctuations persisted, the underlying conviction in Canada’s industrial fundamentals remained intact. Moving forward, stakeholders remained focused on the stabilization of financing costs and the resolution of trade uncertainties, preparing for a medium-term recovery characterized by more synchronized supply-demand dynamics and a renewed emphasis on functional utility.
Want to be notified of our new and relevant CRE content, articles and events?
Disclaimer
This publication has been prepared for general guidance on matters of interest only and does not constitute professional advice or services of Altus Group, its affiliates and its related entities (collectively “Altus Group”). You should not act upon the information contained in this publication without obtaining specific professional advice.
A number of factors may influence the performance of the commercial real estate market, including regulatory conditions and economic factors such as interest rate fluctuations, inflation, changing investor sentiment, and shifts in tenant demand or occupancy trends. We strongly recommend that you consult with a qualified professional to assess how these and other market dynamics may impact your investment strategy, underwriting assumptions, asset valuations, and overall portfolio performance.
No representation or warranty (express or implied) is given as to the accuracy, completeness or reliability of the information contained in this publication, or the suitability of the information for a particular purpose. To the extent permitted by law, Altus Group does not accept or assume any liability, responsibility or duty of care for any consequences of you or anyone else acting, or refraining to act, in reliance on the information contained in this publication or for any decision based on it. The distribution of this publication to you does not create, extend or revive a client relationship between Altus Group and you or any other person or entity. This publication, or any part thereof, may not be reproduced or distributed in any form for any purpose without the express written consent of Altus Group.
Authors

Jennifer Nhieu
Senior Research Analyst
Authors
Jennifer Nhieu
Senior Research Analyst
Resources
Latest insights