Parsing the data: Altus Group’s Q3 2023 NCREIF ODCE index analysis
Our NCREIF ODCE index analysis reveals the latest market trends and breaks down market results by both sub-property type classification and geography. Click here to read the latest update.
Altus Group's Q3 2023 NCREIF ODCE index analysis

Key highlights
The unlevered commercial real estate total return declined 1.4% in Q3 2023, marking the fourth consecutive quarter-on-quarter of negative returns
The return variance between the top-performing property sector (retail, 0.3%) and the bottom-performing sector (office, -4.5%) contracted to 480 basis points (bps)
All property sectors are down from their post-pandemic peaks, with values on a downward trajectory against a backdrop of a higher cost of capital environment, coupled with declining cash flow growth
The NCREIF ODCE index is one of the most referenced commercial real estate price indexes in the market.
Each quarter, our performance analytics team and senior advisory leaders identify main themes in the latest market results, provide a breakdown of the most recent quarterly returns, and cover property value variances across the major metropolitan markets.
Q3 2023: The latest performance results and insights for the NCREIF ODCE index
Through the third quarter of 2023, unleveraged commercial real estate (CRE) declined 1.4% compared to the second quarter. The Q3 2023 decline marked the fourth consecutive quarterly of negative returns, albeit a more moderate setback than the prior three quarterly declines.
Figure 1 - Headline returns – Quarterly to Q3 2023
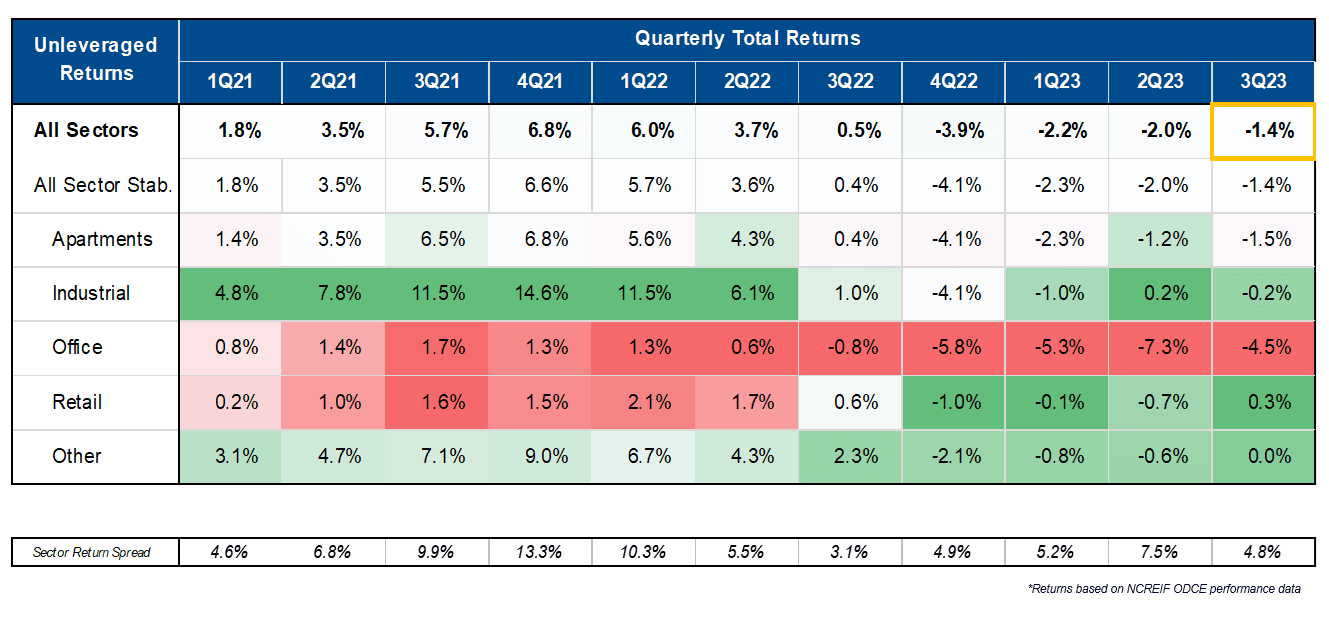
The sector return spread, or return variance between the best and worst performing sector for the quarter, narrowed in Q3 2023 to 480 bps, down 270 bps from the prior quarter. While the retail sector took the “best performing” title from the industrial sector in Q3, office remained the “worst performing”.
Current corrective phase
In Q3 2023, all property sectors saw cumulative quarterly declines; to this effect, CRE values have fallen more than 9.1% from their post-pandemic peak set one year ago. However, those declines (when compared to recent peaks) vary substantially by property type. The office sector has seen the most significant declines, falling more than 21.6% since peaking in Q2 2022, while apartments (-8.8%), industrial (-5.1%), and retail (-1.5%) have all come down more modestly from their Q3 2022 peaks.
Figure 2 - All property quarterly returns
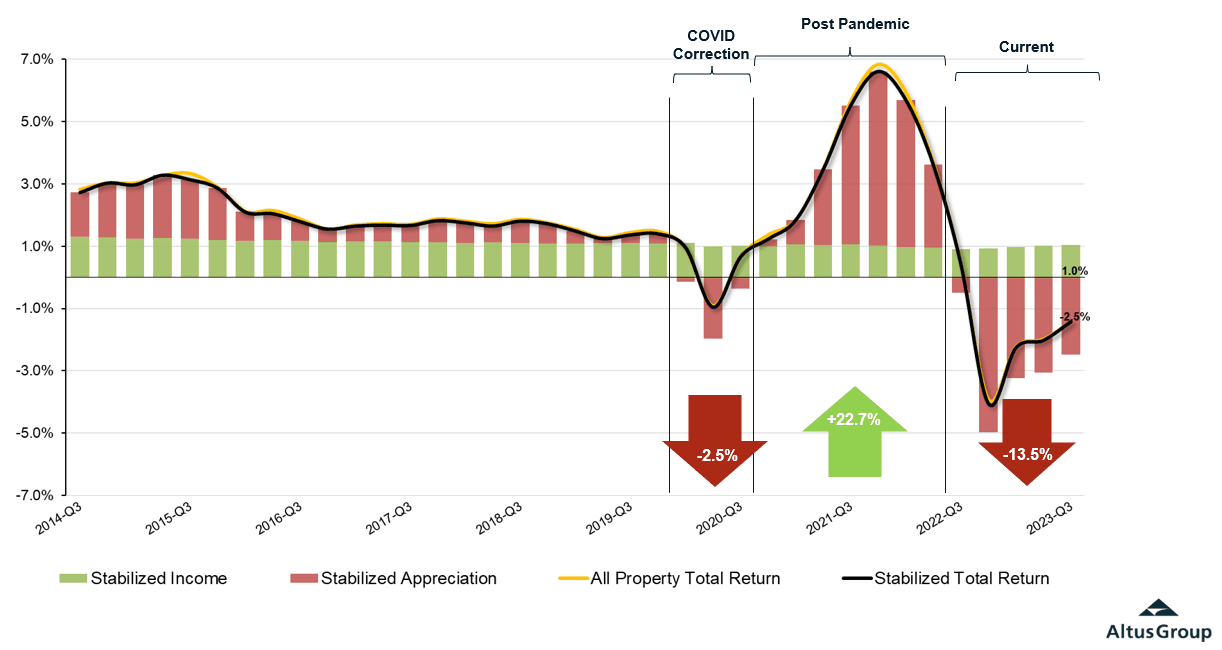
The recent negative returns across CRE have been driven predominantly by negative appreciation, as income has remained steady. Looking back over the last few years, we can see that we are clearly in a new phase of total return drivers. Prior to the pandemic (between 2017 and 2020), total returns were driven mostly by stabilized income with a smaller contribution from asset appreciation. During the COVID correction phase, however, negative appreciation was partially offset by stabilized income, but ultimately knocked about 2.5% off total returns.
While the COVID correction phase was sudden, it was also short-lived, ending around Q4 2021. The post-pandemic period marked the next phase of the returns, characterized by steady return contributions from stabilized income, but significantly larger contributions from positive appreciation as stimulative monetary policy and economic reopening spurred a surge in activity and bolstered robust valuations. The post-pandemic period saw 7 consecutive quarters of growth, adding nearly 23% to property values. This phase came to an end when we entered the current period a year ago, as the impact of tighter monetary policy began to reverberate across the capital markets.
It is the yield increases that have taken down values in all sectors, and this has coincided with a somewhat static (fallow) period for the cashflows that are being priced. That rather muted cashflow outlook is somewhat reflective of the uncertain economic backdrop; market growth rates assumptions have been factored down from the post-pandemic peaks at a time of increased costs, with the office sector being by far the worst affected.
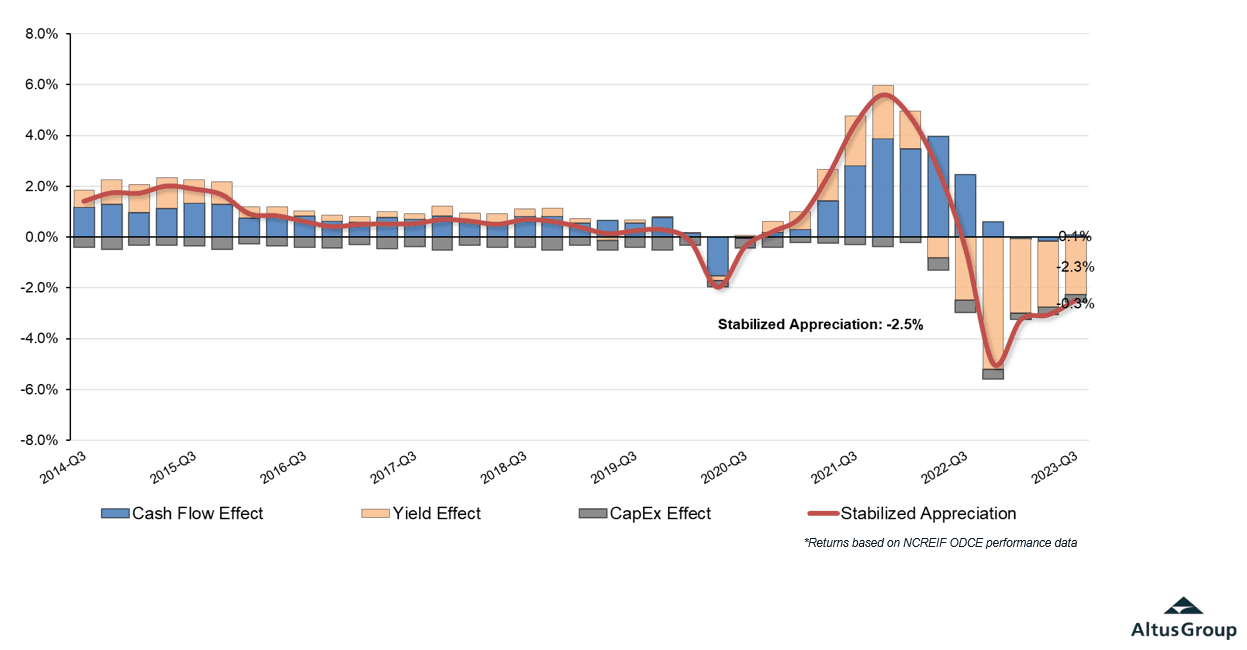
Figure 3 - Drivers of stabilized appreciation returns
Get the latest valuation benchmarks by market and asset class
Join this webinar as we analyze the latest performance results and insights of the NCREIF ODCE index - one of the most referenced commercial real estate price indexes in the market.
Sector appreciation return drivers
In aggregate, property cash flows for the quarter remained positive for all property types except for office, but the scaled-back cash flow gains were not enough to offset the negative effect of further yield increases. Variation across property sectors remained, but the overall higher cost of capital dampened transaction activity, and expectations for slowing economic growth weighed heavy on all property outlooks and valuations.
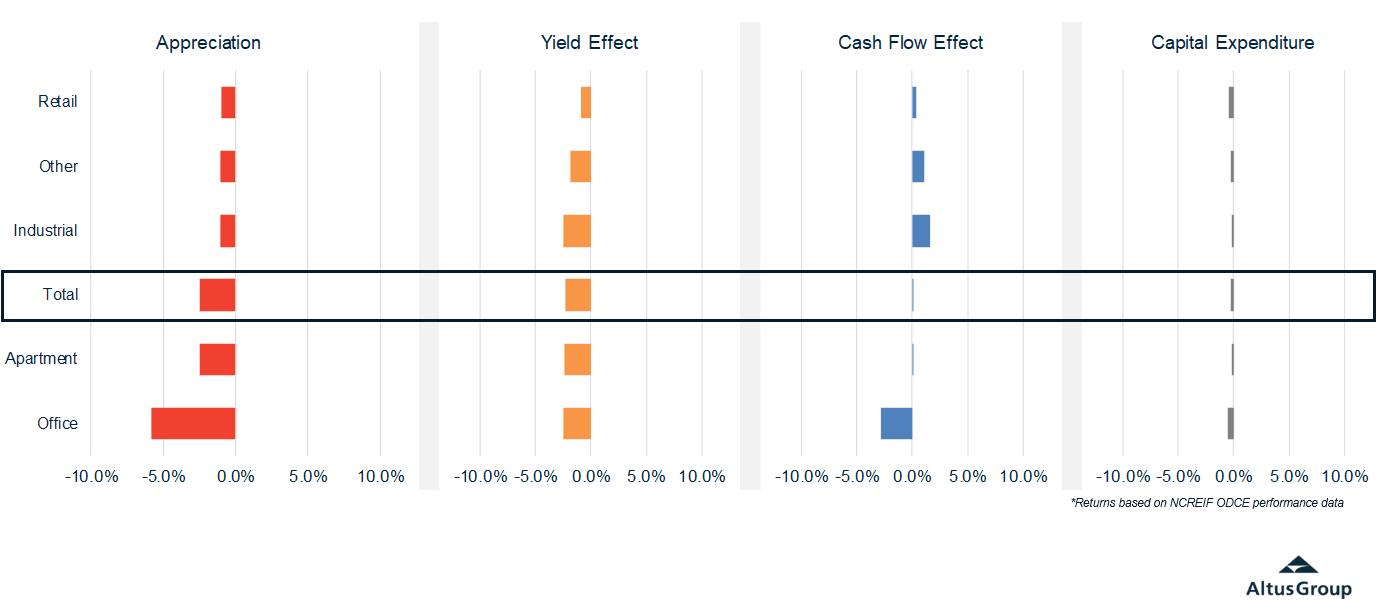
Figure 4 - Attribution of appreciation returns across property types
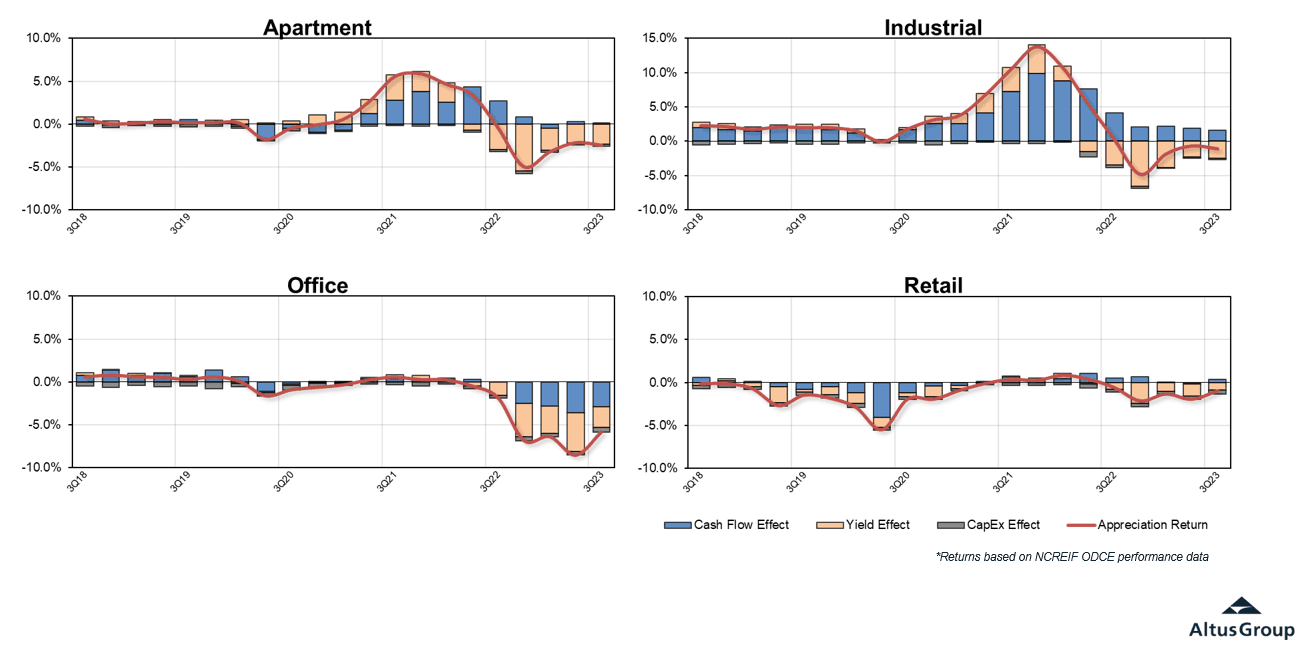
Breaking down trends in appreciation returns across the four main property sectors:
Industrial: The long-time darling of the post-pandemic period, the property sector, continues to see more mild corrections than other sectors. Since the pandemic, the industrial sector’s appreciation return has benefited from having significant cash flow growth (“cash flow effect” in chart above), which has helped to offset much of the negative impact from the yield effect since Q2 2022. However, the protection from this cash flow effect has largely deteriorated in the most recent quarters. While there are still many markets where industrial is commanding premium pricing and higher rents, it is no longer property sector-wide.
Multifamily: Another post-pandemic favored property type, apartments and multifamily, follow a similar trajectory to industrial. Interest rate adjustments have dragged down the negative yield effect, more than offsetting any of the cash flow effect that would serve as protection for overall appreciation returns. The multifamily cash flow effect buffer, which cushioned the negative yield impact early on when interest rates began to rise, has but been eliminated as revenue growth projections have flattened and increases in operating expenses are taking their toll.
Office: The hardest hit sector, office, continues to see the biggest declines in total return and appreciation return. Declines in the office sector are driven by compounding impacts from negative cash flow, yield, and capital expenditure effects. Concerns of over-supplied markets, lack of demand, and unavailable or expensive financing are all headwinds that challenge the property sector. Combined, these forces are putting significant downward pressure on cash flows and the yield effect, and ultimately driving the negative appreciation.
Retail: The retail sector has had a more mixed and muted trajectory than the other sectors, but has recently been trending in the right direction. The negative yield effect is starting to narrow for the sector, and cash flow projections are starting to show positive signs, albeit very narrowly. While the retail sector has not been able to fully buck the impact of the rising rate environment, the appreciation return has benefited from the continued strength of the US consumer and right-sizing of the retail landscape.
Figure 5 - Yield and cash flow effect – Q2 2023 to Q3 2023
Breaking down cash flow effect
While the yield effect has been the primary driver of the quarterly decline, diving deeper into the Altus valuation data provides an enhanced perspective of six of the key drivers of the cash flow effect – occupancy, contract rent, market rent, market rent growth, operating expense ratios, and capital expense ratios. Overall, the cash flow effect seems muted on a quarter-on-quarter basis when all properties are looked at together, but there are large variations across the different sectors and their respective cash flow effect drivers.
Figure 6 - Cash flow effect – Quarterly Q2 2023 to Q3 2023
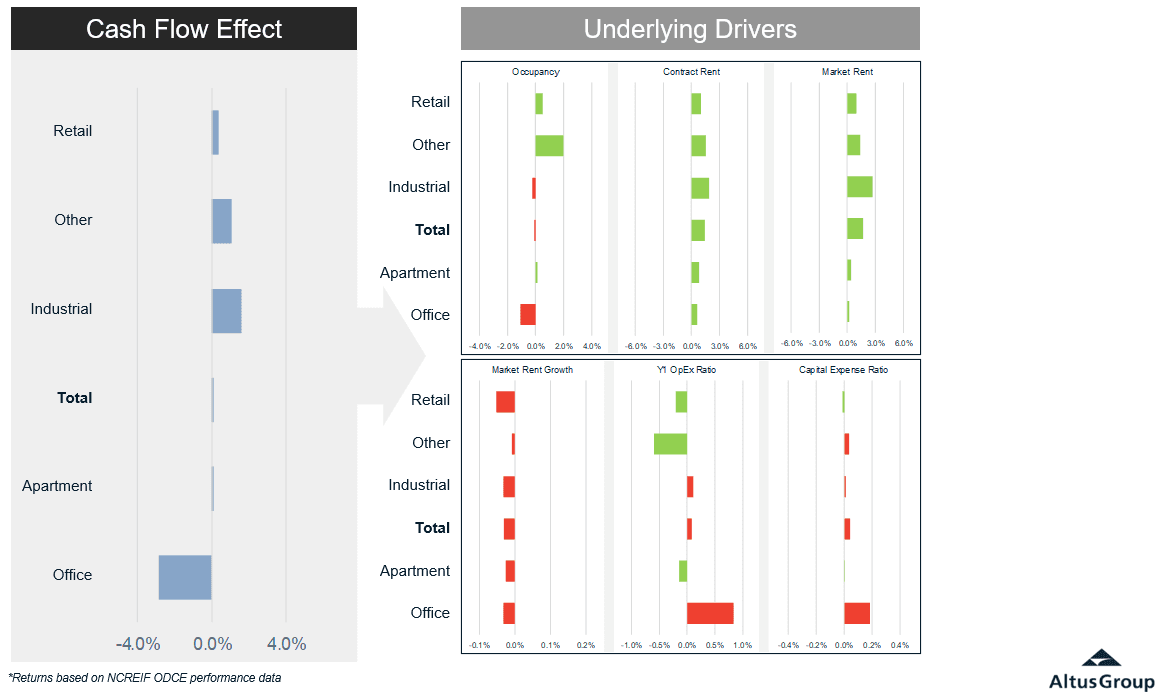
Occupancy rates improved quarter-on-quarter for retail and other sectors, remained mostly stable for apartment and industrial, and declined for office. While there were cash flow positive effects from contract rents (in-place rents) for all property sectors when compared to the prior quarter, and generally positive increases in market rents, market rent growth assumptions for valuations are being pared back and are net negatives to the most recent quarter’s cash flow effect for all property sectors. While retail, apartment, and the other sectors benefited from improved year 1 operating expense ratios, the industrial and office sector valuation assumptions had increased operating expense ratios in year 1 of discounted cash flow (DCF) for the third quarter compared to the prior quarter. Finally, capital expenses were little changed quarter-on-quarter, with the exception of the office sector, contributing to the overall negative cash flow effect for the sector.
Authors

Omar Eltorai
Senior Director of Research, Altus Group

Phil Tily
Senior Vice President, Performance Analytics

Alexander Jaffe
Senior Director, Valuation & Advisory
Authors
Omar Eltorai
Senior Director of Research, Altus Group
Phil Tily
Senior Vice President, Performance Analytics
Alexander Jaffe
Senior Director, Valuation & Advisory
Resources
Latest insights