Key highlights
US commercial real estate (CRE) investment activity across all property types was down significantly through 2023 compared to recent years
Although transaction volume remained significantly depressed, the fourth quarter did show a slight increase in transaction activity compared to the three prior quarters
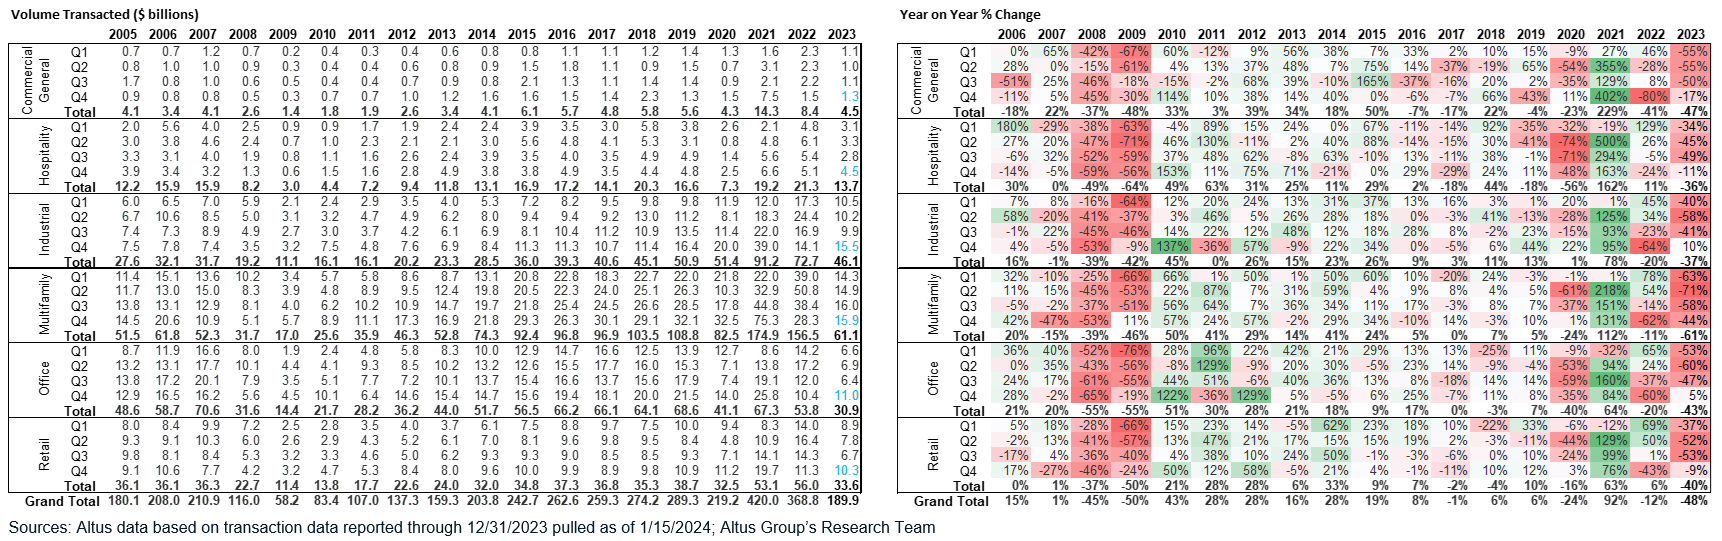
The number of single-asset transactions completed throughout 2023 was also down significantly compared to prior years; transaction volume totaled $58.5 billion in the fourth quarter, up 36% from Q3 2023, but down 17% from Q4 2022
The final quarter of the year reflected a bump in transaction volume which was slightly above the historical quarterly average in terms of both count of transactions and volume ($) transacted, albeit not enough to get the overall transaction volume up to its historical trend line
Average transaction size in Q4 2023 continued to fall on both quarter-over-quarter (QoQ) and year-over-year (YoY) basis
Q4 2023: Transaction volume remains low as US CRE industry grapples with macroeconomic headwinds
Cumulative transaction volume across US CRE in 2023 was the lowest level of volume ($) since 2013. Investment activity (measured by non-distress single-asset transactions, across all property types) was down significantly compared to recent years, driven by the disruption of the rapidly rising cost of capital and volatile financing conditions for CRE – which drove uncertain outcomes at properties and valuations.
Figure 1 - Cumulative weekly transactions
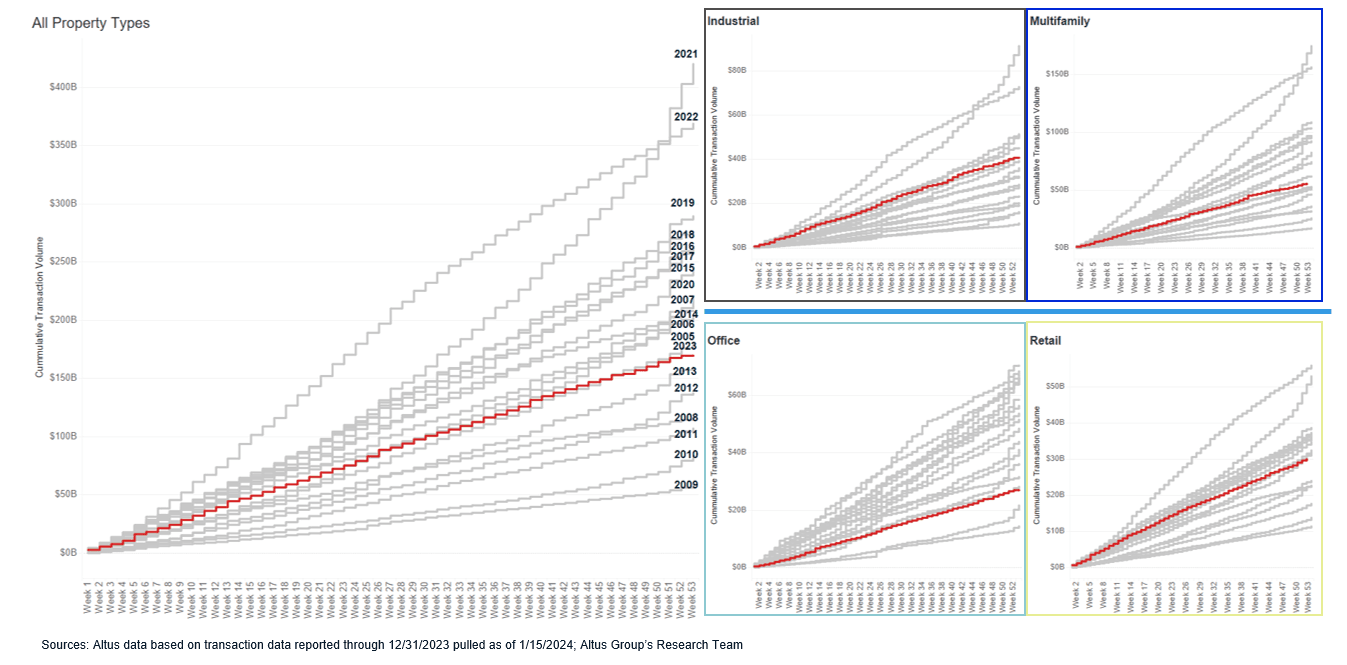
Through the fourth quarter of 2023, cumulative CRE transaction volume remained significantly depressed compared to prior years; however, the fourth quarter did show a slight increase in transaction activity compared to the three prior quarters. The cumulative $189.9 billion invested across the major property types through 2023 was down 48% compared to the prior year. The aggregate transaction volume over the full 2023 year marked the slowest level of activity since 2013, down from the 2021 peak year by 55%.
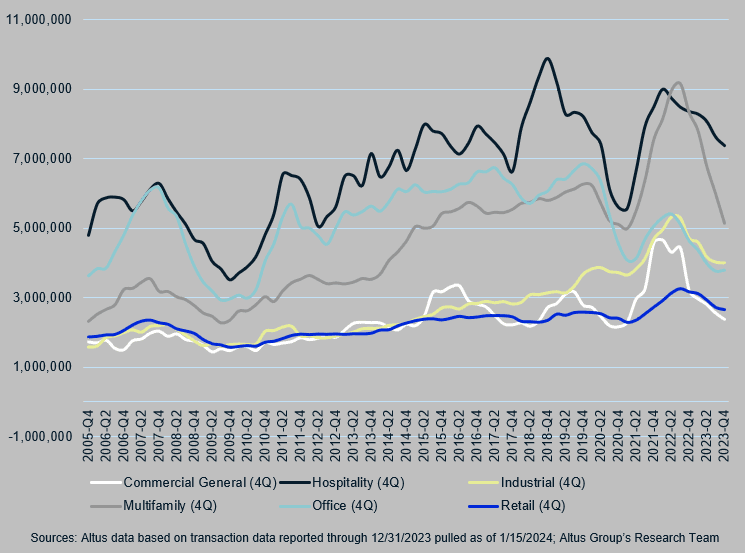
Transaction volumes totaled $58.5 billion this quarter, up 36% from Q3 2023, but down 17% from Q4 2022. On a quarter-over-quarter basis, the Q4 2023 volumes were up vs the Q3 2023 volumes across all property types, with the exception of multifamily.
Figure 2 - Quarterly investment activity ($ volume)

Predictive analytics and market insights
Altus Market Insights incorporates market intelligence and predictive analytics into your daily workflows and key decision-making.
A steep decline in single-asset transactions
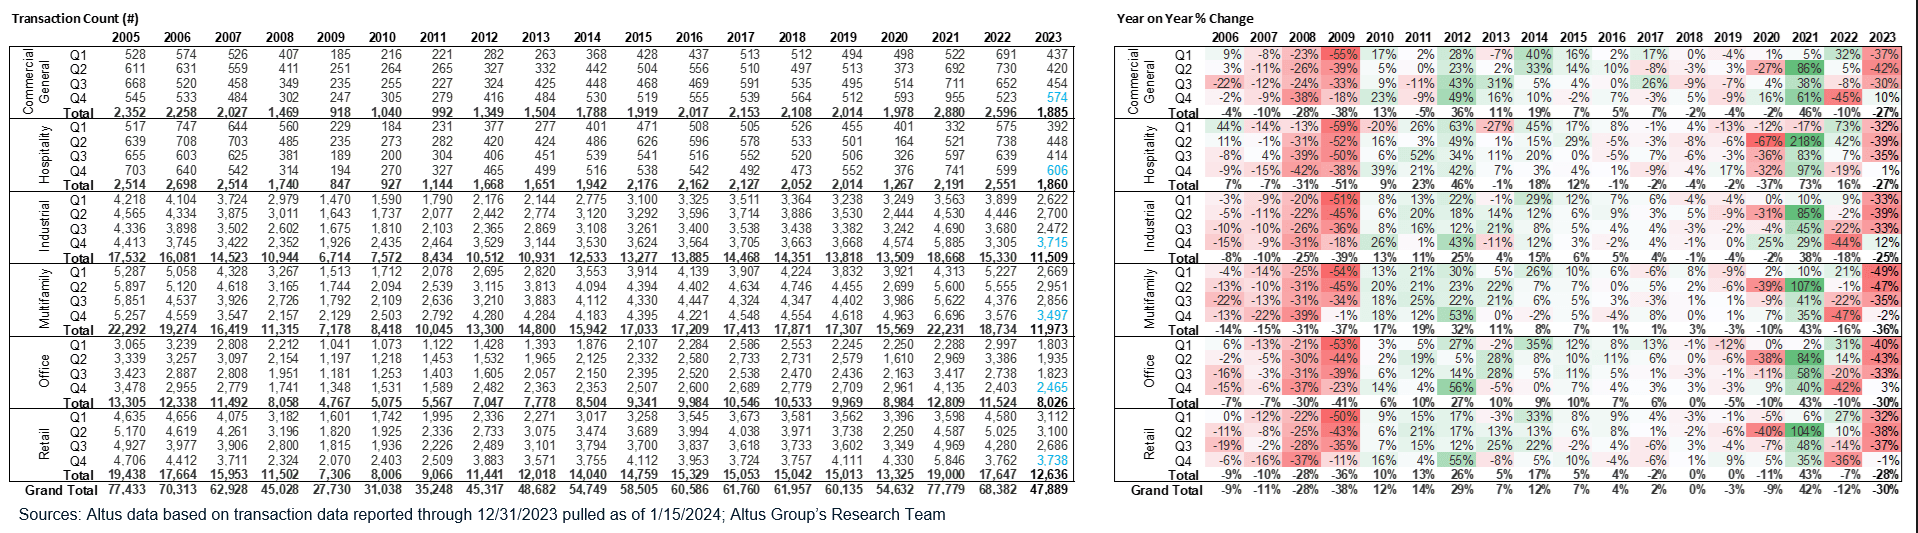
The number of single-asset transactions completed throughout 2023 was also down significantly compared to prior years. The 47,889 properties transacted during 2023 was down 30% compared to 2022 and marked the slowest year since 2012.
In Q4 2023, CRE transactions totaled 14,595, nearly flat (3%) from Q4 2022 and up 36% from Q3 2023. For the fourth quarter, all property types saw the count of transactions increase by more than 20% when compared with Q3 2023, with industrial leading (50%) and multifamily lagging (20%). However, much of the increase can be attributed to seasonality in the data, as fourth quarters are usually the biggest quarter due to recording dates.
Figure 3 - Quarterly investment activity (# traded)
What’s the silver lining?
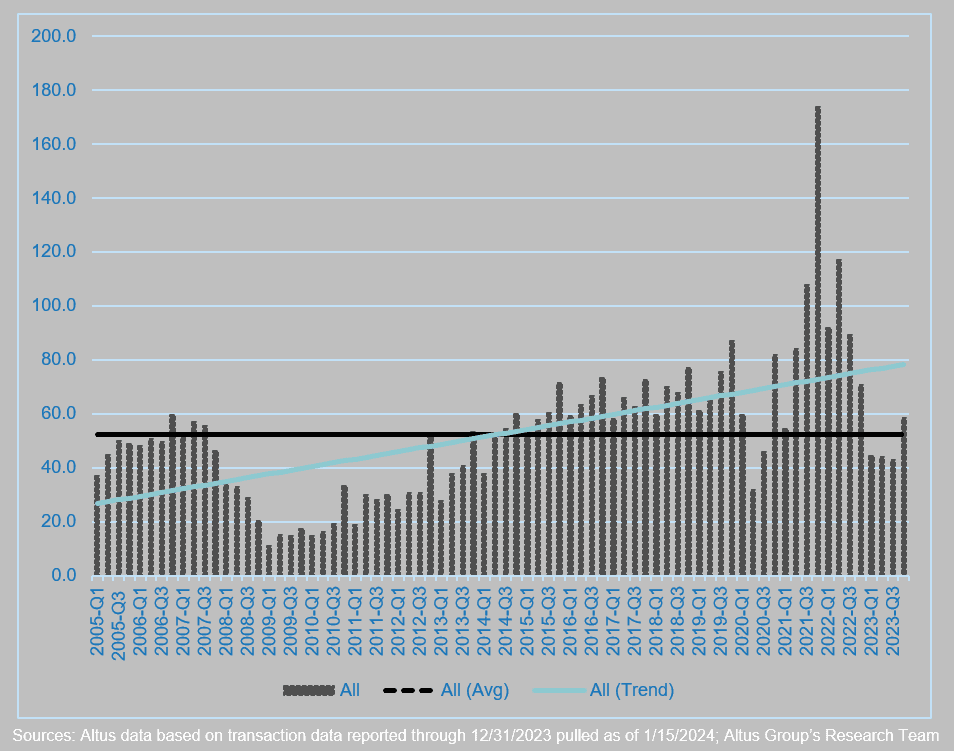
While overall levels for 2023 remained depressed, the final quarter of the year reflected a bump in transaction volume which was slightly above the historical quarterly average in terms of both count of transactions and volume ($) transacted. However, this final quarter bump was not enough to get the overall transaction volume up to its historical trend line.
Figure 4 - Current ($ billion) activity across all major CRE sectors versus trend
Transaction size continues to decline
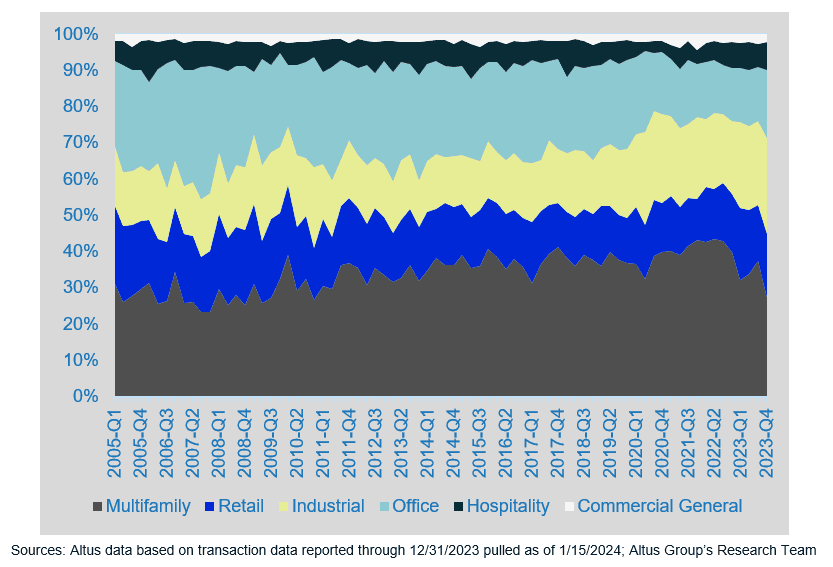
Industrial properties accounted for 27% of the transaction volume in Q4 2023, up 9 percentage points (pp) from its long-run historical average share (18%). Multifamily accounted for 27%, down 8pp from its historical average share (36%). Office transactions accounted for 19% of total volume, down 4pp from its historical average share (23%). Retail accounted for 18% of Q4 2023 volume, up 2pp from its 15% historical average share. Hospitality transactions accounted for 8% of total volume in Q4 2023, up 2pp from its historical average share of 6%.
Figure 5 - Sector composition of transactions ($ volume) – Q4 2023
Average transaction size in Q4 2023 continued to fall on both a quarter-over-quarter (QoQ) and year-over-year (YoY) basis. Average deal size for multifamily fell the most, -38% on a YoY basis and -14% on a QoQ basis, followed by Commercial General average deal size, which were down -26% compared to Q4 2022 and -7% compared to Q3 2023.
Figure 6 - Average transaction size ($) - Q4 2023 simple moving average
CRE is an interest rate-sensitive asset class and, as a result, it will always react to the interest rate environment. While rates have been high – and economic predictions have remained somewhat apocalyptic – transaction activity has, unsurprisingly, stalled across the market. However, as the broad economy continues to grow, inflation cooling, and central banks appear to be readying for a shift to easing monetary policy, the ‘soft-landing’ narrative prevails.
Author

Omar Eltorai
Senior Director of Research, Altus Group
Author
Omar Eltorai
Senior Director of Research, Altus Group
Resources
Latest insights