Top five takeaways from the Q3 2024 Canada CRE industry conditions and sentiment survey

Key highlights
Community and regional concerns have shifted, with zoning reform, provincial/local regulations , and employment and income growth emerging as top priorities
Industrial and multifamily properties have lost ground as the top "best performer" property sectors, while expectations for student housing have surged
Overall transaction intentions and net buying intentions have seen a significant increase compared to the previous quarter
Perceived pricing for the majority of property sectors are considered to be overpriced
1-year outlook on key operating and performance metrics moderate, while collective confidence in outlook declines
Our Q3 2024 market survey results reveal a rise in community and regional concerns, shifts in pricing perception and transaction intentions, and growing conviction for little change across key operating and performance metrics
In the most recent Canada Q3 2024 Commercial Real Estate Industry Conditions and Sentiment survey conducted by Altus Group, the results shed light on key insights related to capital availability, priority issues, property performance, transaction intentions, and expectations for key metrics. This article shares additional details from Altus Group’s Research Team on these key takeaways.
Community and regional concerns underwent significant shifts, with zoning reform, provincial/local regulations , and employment and income growth emerging as top priorities
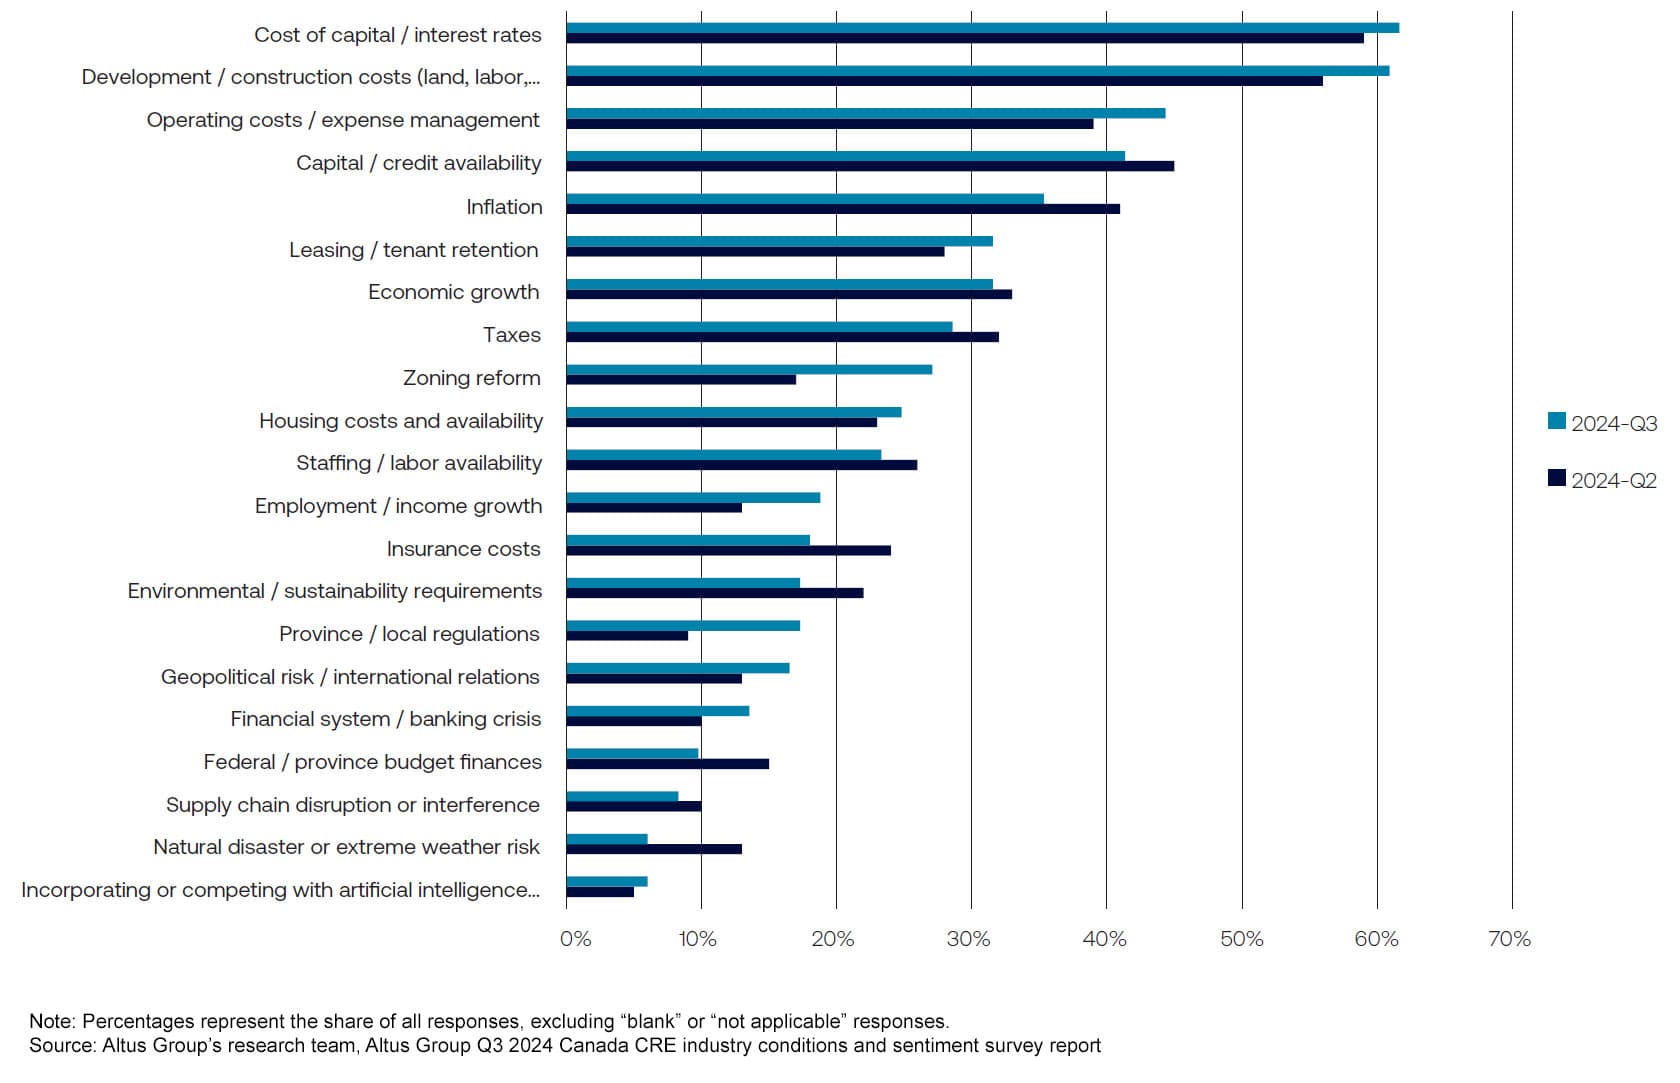
In Q3 of 2024, there was a noticeable increase in community-related concerns compared to the previous quarter. Zoning reform became a top priority, surging by 10 percentage points over the prior quarter results, followed by an 8 percentage point rise in state/local regulations, and a 6 percentage point increase in employment and income growth.
At the property-level, there was a decline in the percentage of respondents mentioning "weather risk" and "insurance costs" as concerns, with both issues dropping by 7 and 6 percentage points respectively in Q3 over Q2, marking the most significant decreases among all issues.
Figure 1 - Priority issues over the next 12 months
Industrial and multifamily remain most favored, but lose ground as the top “best performer” property sectors, while expectations for student housing surged
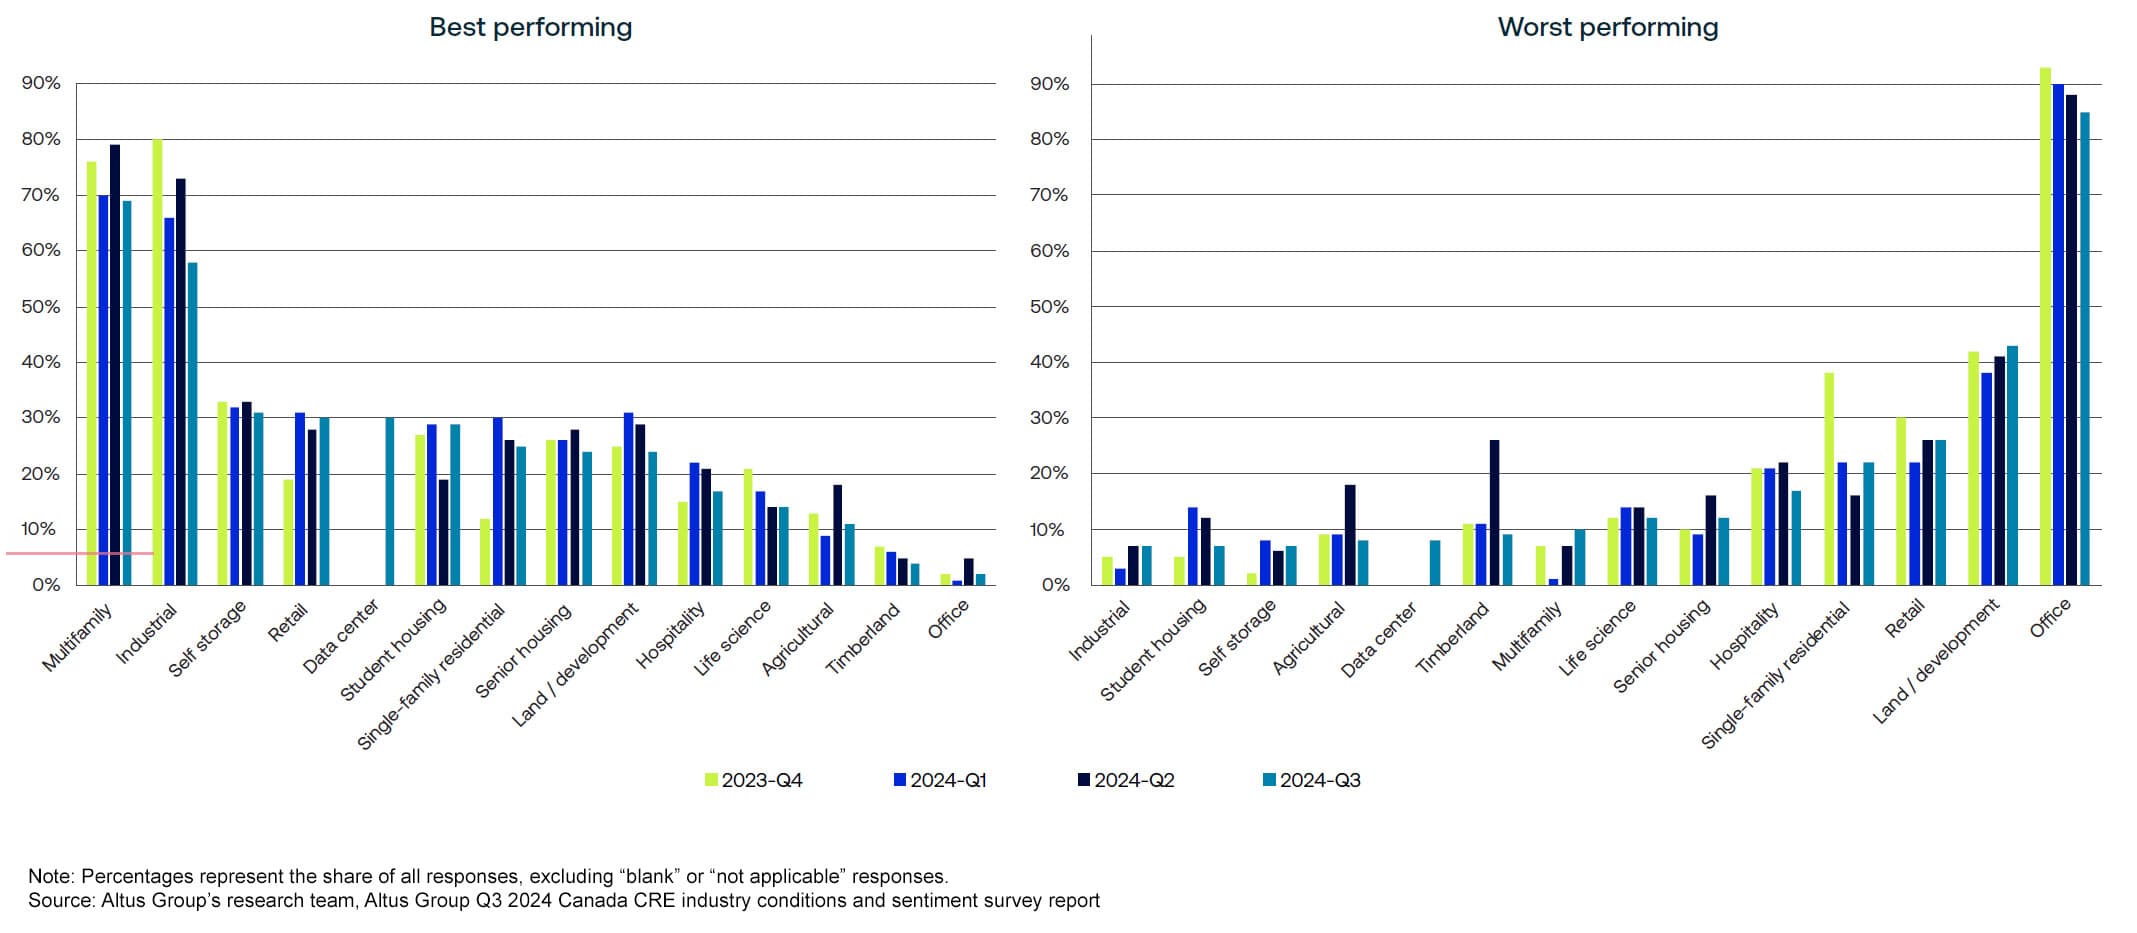
During the quarter, there was a shuffle in sentiment towards the performance of various property types. Despite being considered second among best performers for the last three quarters, people who viewed industrial properties as potential "best performers" dropped from 73% to 58% compared to the previous quarter. Sentiment towards the highest-rated best performer, multifamily properties, also suffered a 10 percentage point decline from the previous quarter to 69%.
On a more positive note, student housing experienced the largest gain in performance expectations advancing 10 percentage points to 29%. As further support to this shift in sentiment, those considering student housing to be a potential "worst" performer shrunk from 12% to 7%.
Figure 2 - Expectations for best and worst performing property types
Overall transaction intentions and net buying intentions rise over quarter
Participants in the survey were asked about their firms' transaction intentions for the next 6 months. In the most recent quarter, a significant majority (75%) of respondents stated that they plan to transact (buy and/or sell) in the near term, up 10 percentage points from the previous quarter and the highest level in four quarters.
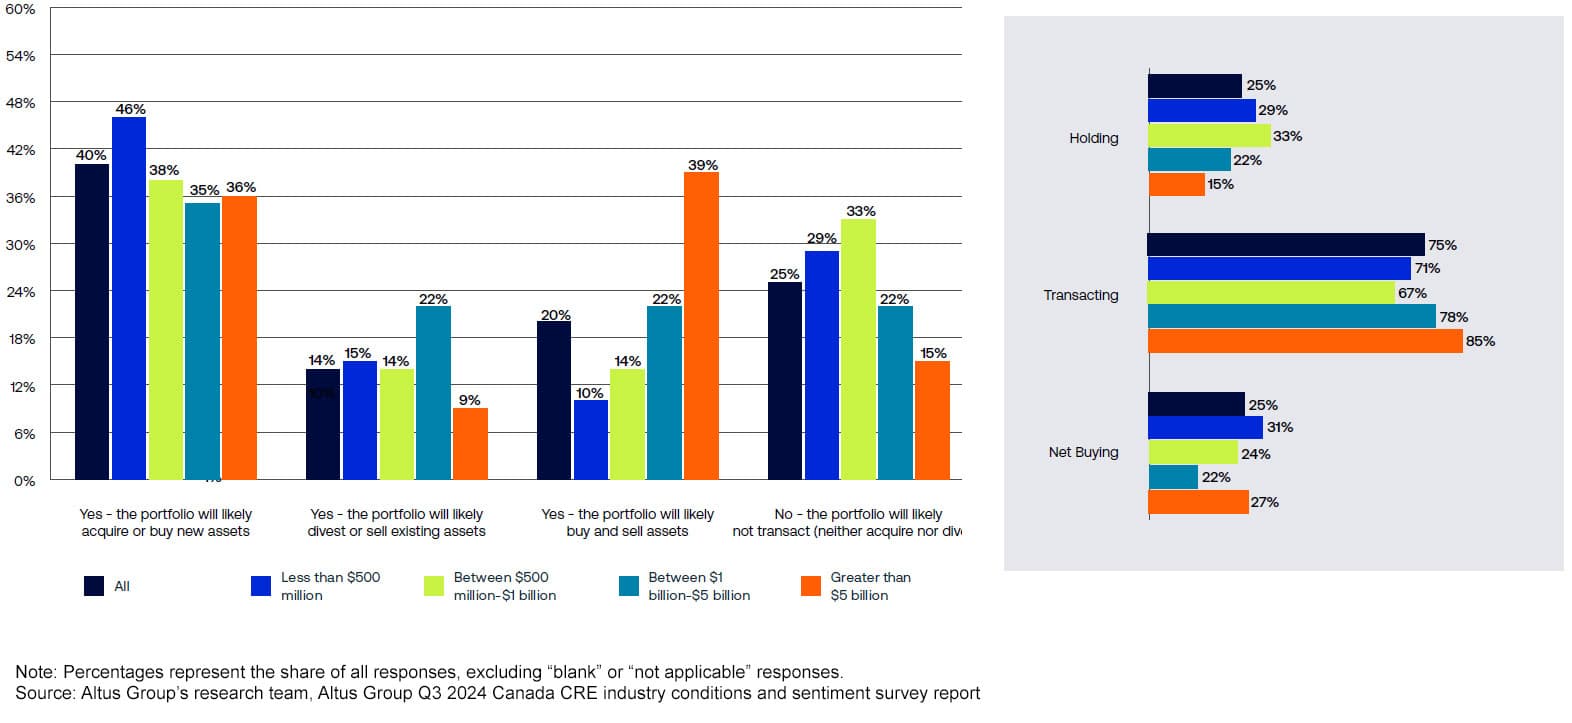
Additionally, net buying intentions saw a substantial rise to 26%, up by 8 percentage points from Q2 2024. Respondents from small firms (those with a CRE exposure less than $500 million), said they planned to be net buyers, while the largest firms (those with greater than $5 billion) reported the greatest intentions to both buy and sell.
Figure 3 - Transaction intentions over the next 6 months
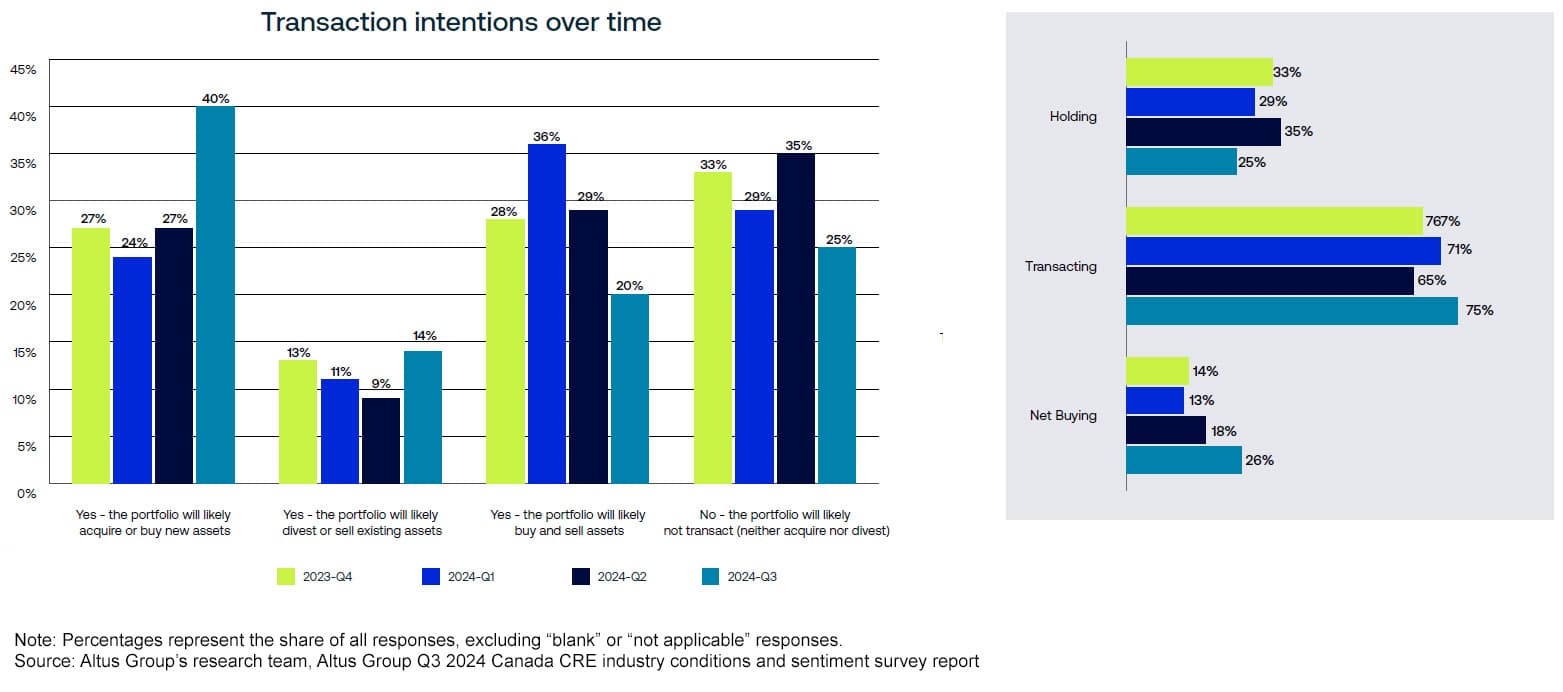
Figure 4 - Transaction intentions over the next 6 months by firm size
Perceived pricing varied significantly across property sectors, with an overwhelming majority considering land/development and single-family residential properties overpriced
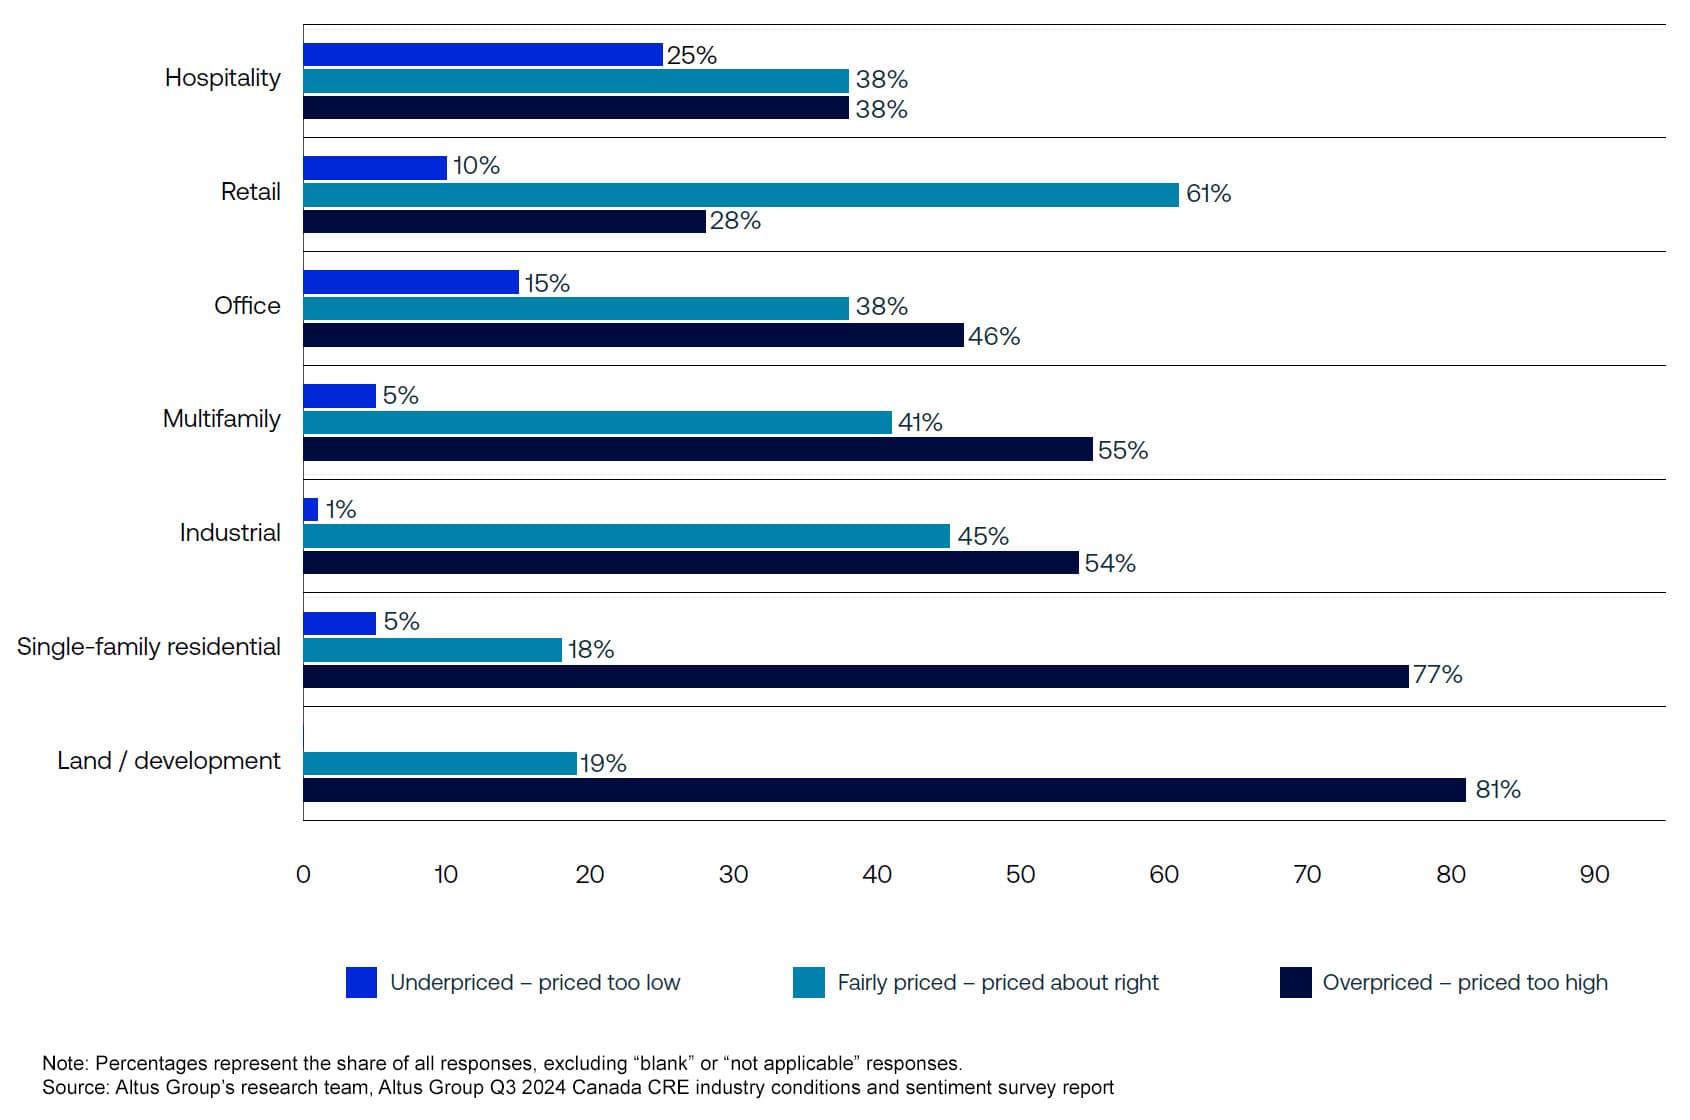
Participants were asked to categorize different property types based on how they perceived their pricing. The majority of respondents viewed land/development and single-family residential properties as "priced too high", with 81% and 77% of responses, respectively. Multifamily and industrial properties followed closely behind, with 55% and 54% of participants characterizing them as also overpriced. Retail was the only property type considered "fairly priced" by a majority at 61% of respondents.
Figure 5 - How would you characterize current pricing for the following property types?
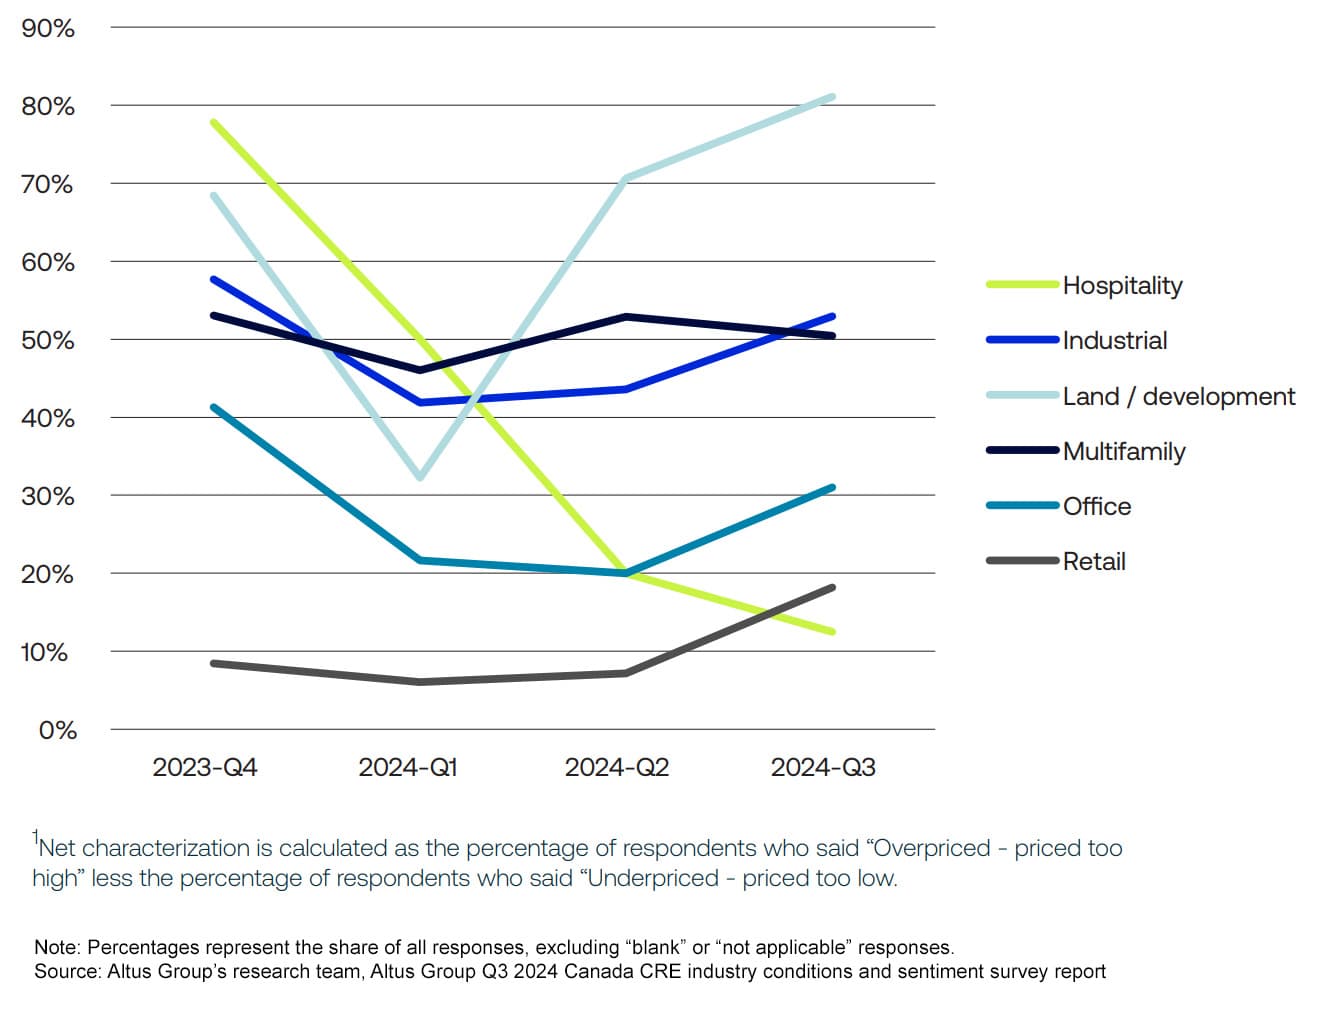
The net characterization of Hospitality properties continued its downward trend across four quarters with nearly 23% of participants moving away from considering it "fairly priced" to either "underpriced" (15 percentage point increase) or "overpriced" (8 percentage point increase), this signified the biggest quarterly shift across all property types.
Figure 6 - Net characterization of current pricing
1-year forward expectations for key metrics moderates while conviction declines
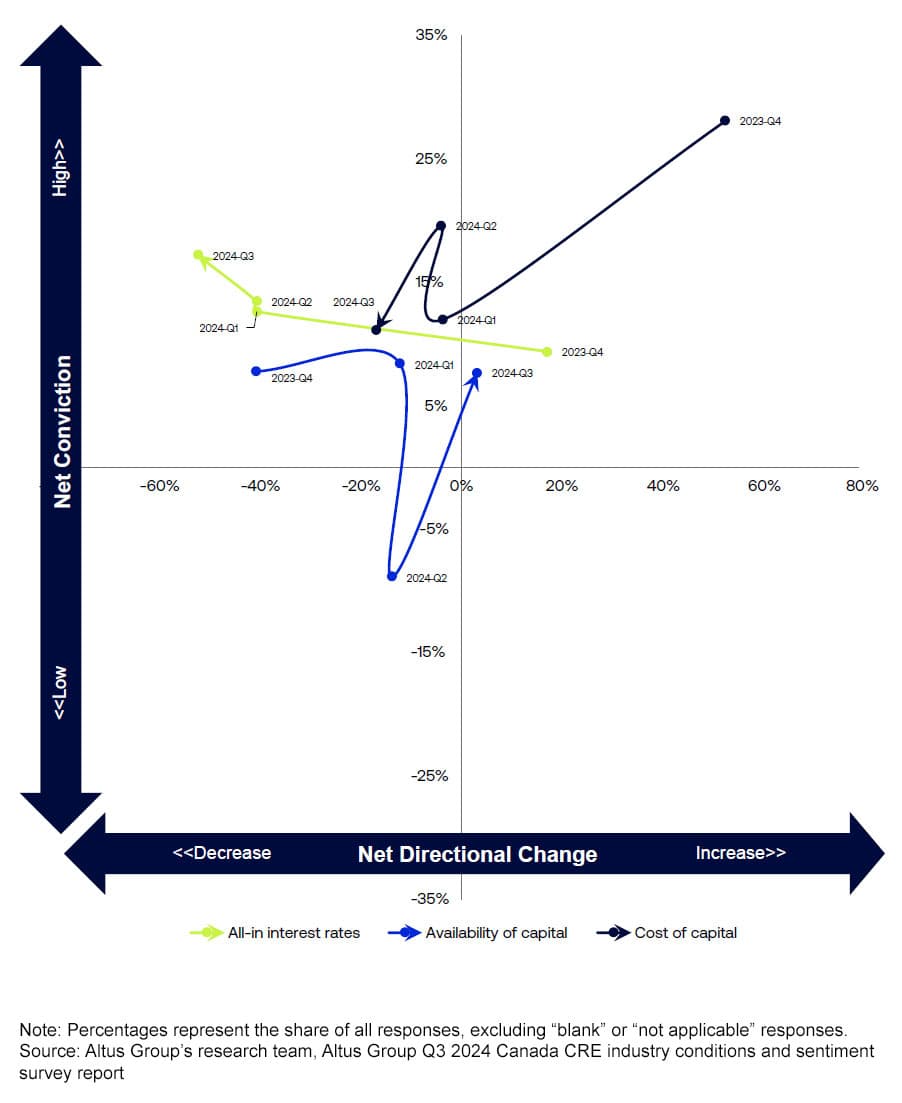
Survey participants were queried about their expectations and conviction regarding various key metrics. Participants broadly expect capital conditions to improve over the next 12 months – as all-in interest rates and the cost of capital are anticipated to come down. While these paint a positive outlook and would be supportive of more transaction activity, the Q3 results showed that capital availability is not expected to improve as meaningfully, which could pose a challenge to those who are looking to access the capital they need.
Figure 7 - Capital: Interest rates, availability, cost of capital
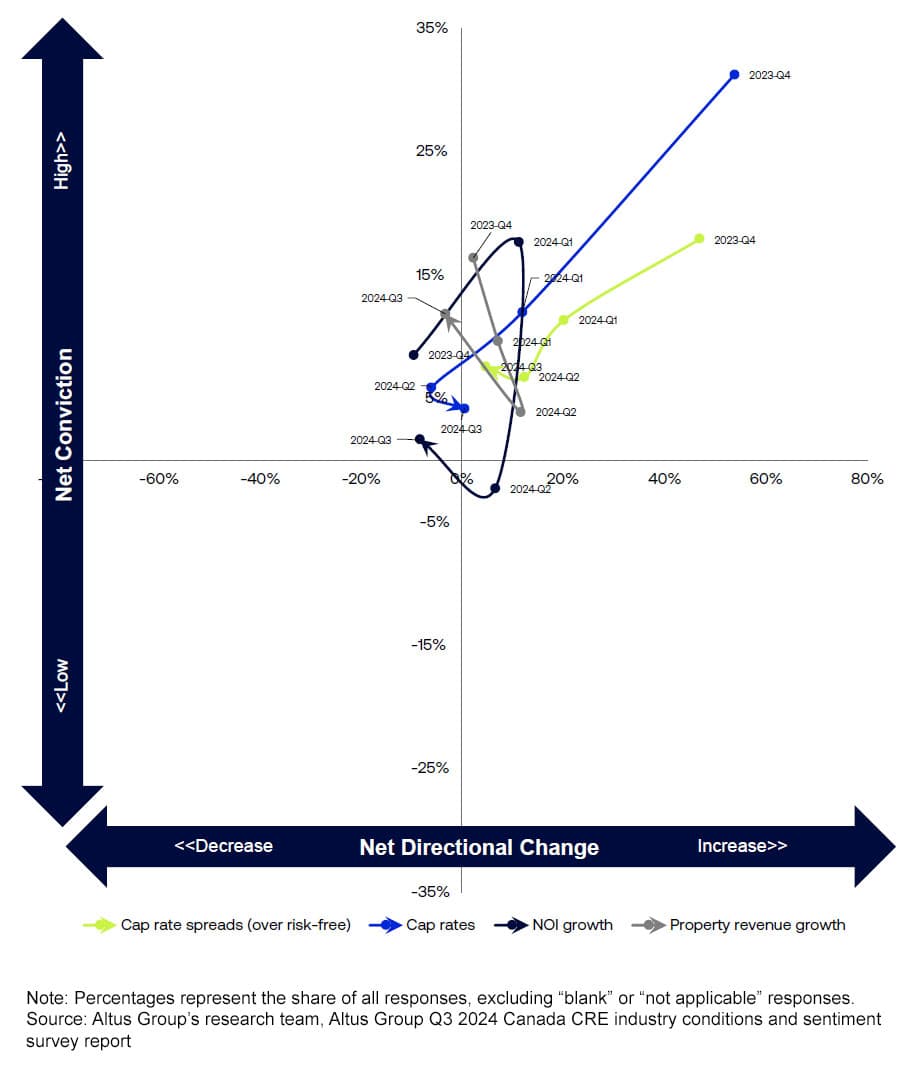
Regarding fundamental metrics, the survey participants do not expect significant movement in property cash flow metrics (such as revenue growth and NOI growth). The Q3 results also showed that cap rates (spreads over risk-free rate and absolute cap rates) are anticipated to remain stable over the coming year.
Figure 8 - Fundamentals: Revenues, NOI, cap rates
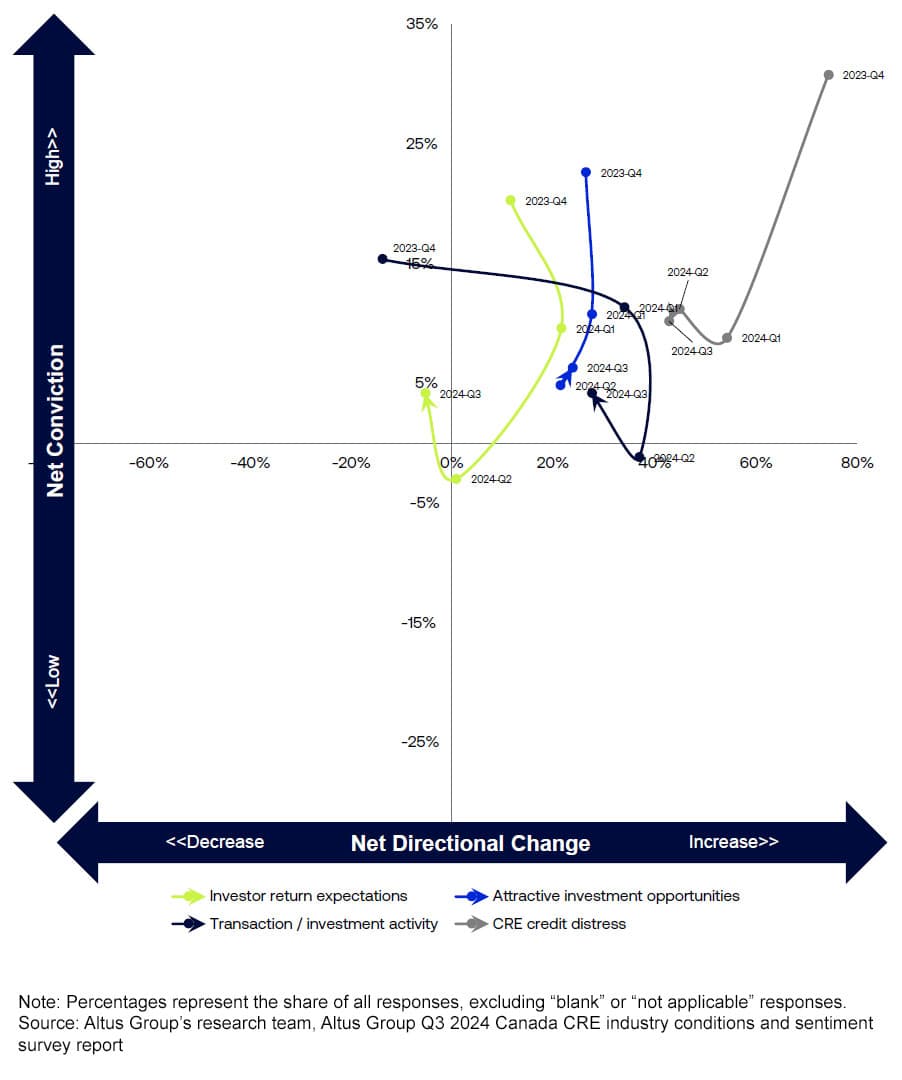
With a backdrop of a lower-cost of capital environment with persisting constraints on capital availability, coupled with sound but stable cash flow metrics and steadying cap rates, the outlook for investment activity and returns remains unclear. While the Q3 results showed areas of positivity in terms of expectations for an increase in attractive investment opportunities and overall transaction activity, these were accompanied by an expectation for increased levels of CRE credit distress and overall lower expected return from investors. Over the last four quarters, all of these metrics have seen a notable decline in conviction from respondents – which could be interpreted as a sign of uncertainty about the coming year ahead for Canadian CRE.
Figure 9 - Investments: Returns, distress, activity
A request for your participation
Our ability to share valuable market insights depends on the active participation of industry professionals like you. As we gather a diverse range of voices, the richness of the data deepens, allowing us to segment responses and paint a more detailed portrait of the industry’s collective outlook each quarter.
Your participation is instrumental in shaping the narrative of the commercial real estate landscape, please support this survey program by sharing your perspective on our next installment of the ICSS.
As an added benefit, Survey participants will receive the underlying and historical data associated with the report upon its release.
Want to be notified of our new and relevant CRE content, articles and events?
Authors

Omar Eltorai
Director of Research

Cole Perry
Associate Director of Research
Authors

Omar Eltorai
Director of Research

Cole Perry
Associate Director of Research


