
Key highlights
Commercial Real Estate (CRE) transaction volumes are at their lowest level in years, on track to fall below 2020 numbers
Cumulative office transaction volume is at its lowest level since 2010
Sellers and buyers cannot agree on prices and values; in other words, with so few comparable transactions, there is a significant mismatch between asking prices and bidding prices in prospective deals
Limited appetite for office properties and the challenging transaction environment are obscuring the anticipated distress in the sector
Lenders are hesitant to reclaim keys to foreclosed office properties; sales from foreclosure currently comprise a smaller fraction than the historical average
When will we get price discovery?
Understanding the market price of an asset is crucial in times of volatility. It provides reassurance to lenders and functions as a key term for financing – namely expected or realized returns, covenant triggers, or control party.
With transaction volume at its lowest level in years, panelists and attendees at June’s CREFC conference expressed continued frustrations and difficulties pertaining to “price discovery”. This is one of the reasons the CRE industry at large has been desperate for clarity on interest rates from the Federal Reserve. Higher interest rates mean higher cost of capital, which drives higher return hurdles for investments to look attractive. This generally results in a decline in transaction volume because fewer assets can meet these requirements.
On July 26, the Federal Reserve raised the target range for the Fed Funds rates by another 25 bps to a range of 5.25-5.50% and signaled that it was prepared to raise rates again. While CRE transactions can take place in all interest rate environments, the rapid rise in interest rates over the last 17 months has significantly disrupted CRE transaction activity. Given the current high-rate environment and the potential for additional rate hikes ahead, a quick recovery of CRE transaction volume to pre-hike trends through the second half of 2023 seems increasingly unlikely.
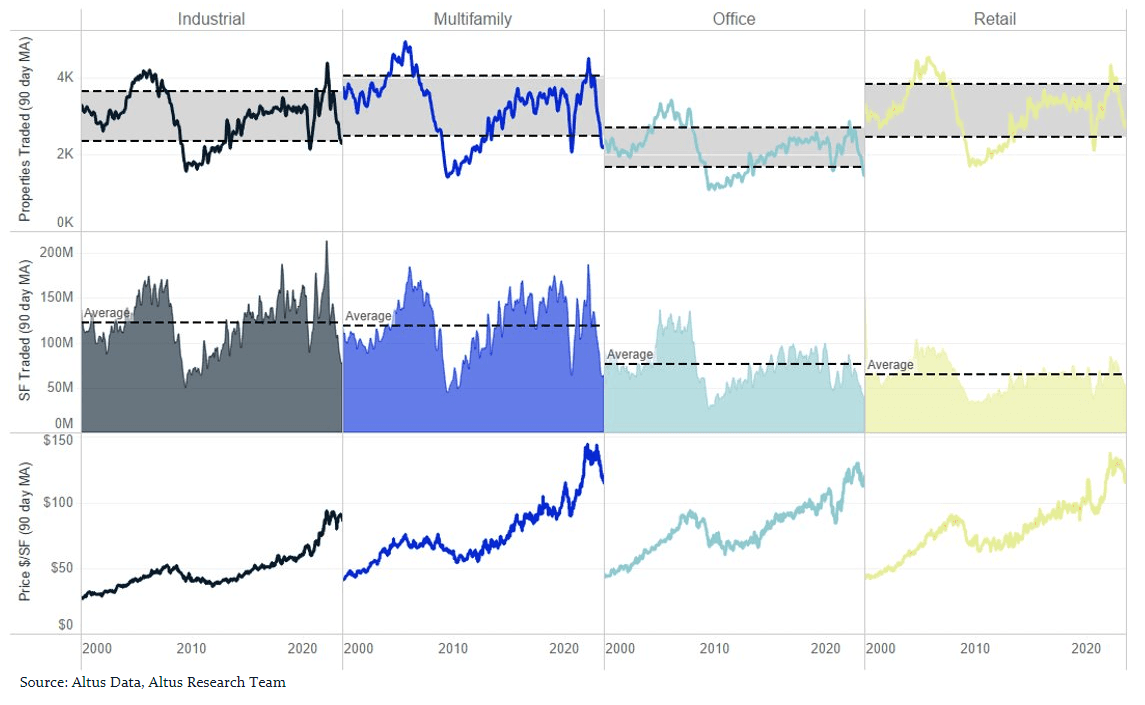
The current CRE transaction volume numbers are bleak. For all property types except retail, current transaction pacing falls outside one standard deviation of the average number of properties traded in any 90-day period since 2000. Similarly, square footage transacted is well below the average traded across the primary property types in the same period. And for transactions that are happening, national median prices have continued to fall from their 2022 peaks – mirroring the directional movements of other price measures.
Figure 1 - Transaction statistics by property type – 90-day rolling averages
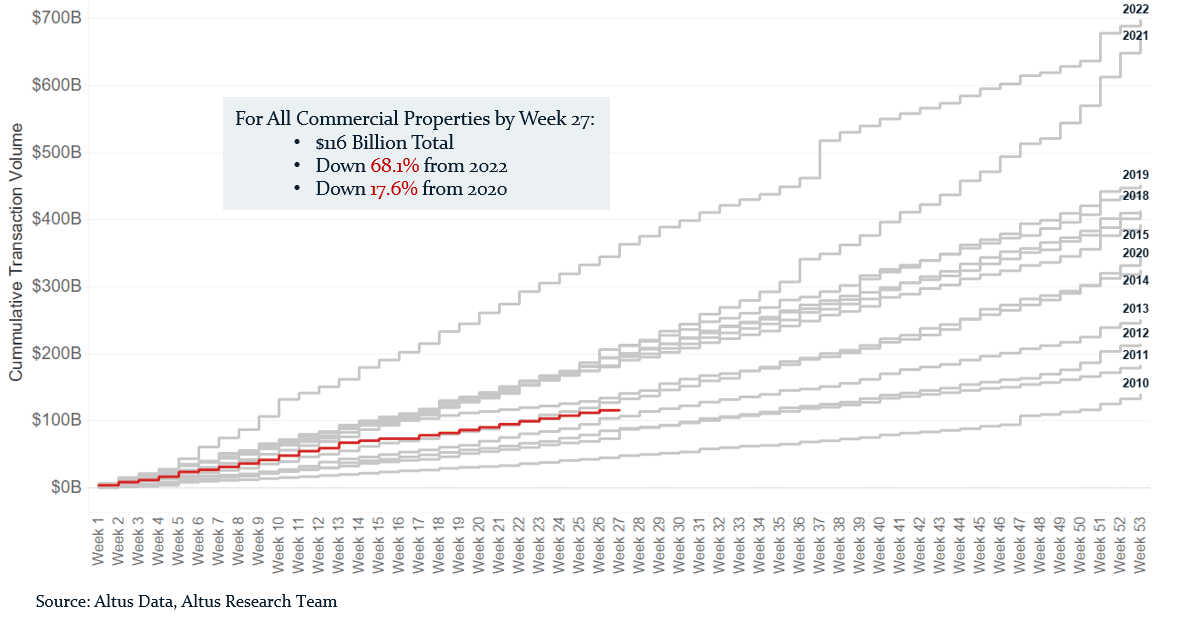
At the current pace, CRE transaction volumes are on track to fall well below 2020 levels, outpacing only 2010-2013 levels. By week 27 cumulative transaction volume for all commercial properties hit $116 billion, down 68.1% from the same point in 2022, and 17.6% from the same point in 2020. With such low transaction volume, there are few reference points for buyers and sellers in the commercial property market. This is causing a significant disparity between asking prices and bidding prices in prospective deals and is, in turn, propagating the low-volume cycle.
Figure 2 - Cumulative transaction volume by week for all commercial properties

Predictive analytics and market insights
Altus Market Insights incorporates market intelligence and predictive analytics into your daily workflows and key decision-making.
Who wants an office building?
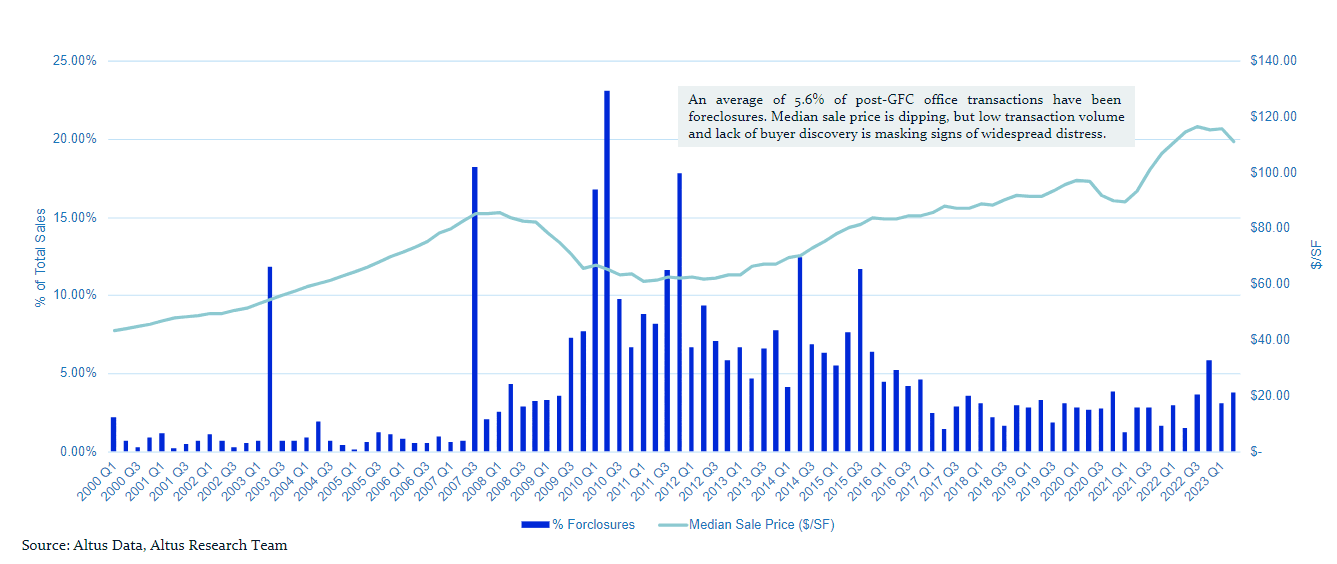
One might expect distress in the office market to be revealed through foreclosure sales, which have made up an average of 5.6% of post-GFC office transactions. However, such a small appetite for office properties in general – coupled with a poor transaction environment – is likely preventing such transactions from happening at all. In recent quarters, foreclosure sales of office buildings made up a lower percentage of total office sales relative to history, and levels have not varied much since 2017.
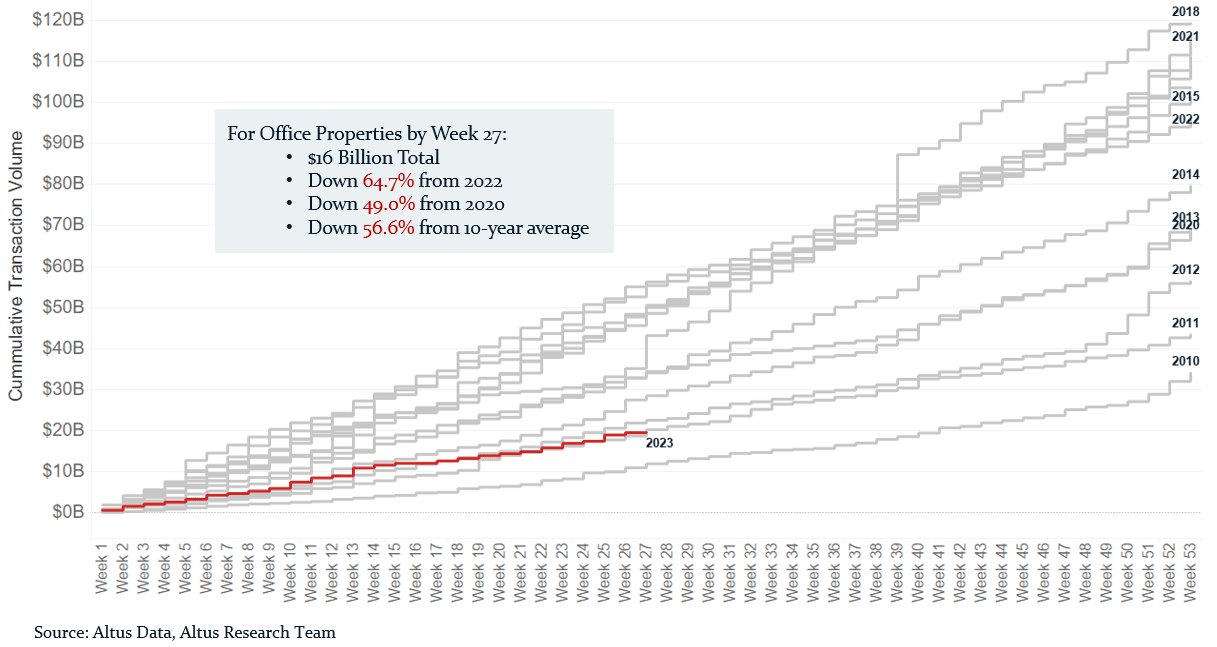
Figure 3 - Cumulative transaction volume by week for office properties
Cumulative transaction volume for office properties is evidently faring much worse than the commercial property market overall, relative to history. By week 27, cumulative volume was 64.7% below 2022 levels, 43.1% below 2020 levels, and 56.6% below the 10-year average over the same period.
Figure 4 - Percentage of total office transactions stemming from foreclosure sales
With respect to distressed office properties, many lenders do not want the keys back to what are now considered obsolete “commodity” buildings. These properties are often mid-century-built, amenity-poor, close to empty or completely unoccupied, and may have outstanding tax obligations. As such, for an investor to generate any meaningful return, they would have to hold onto the property for a significant period.
Greater clarity on interest rates from the Federal Reserve may well enable an acceleration in transactions, perhaps with many quarters worth of transactions condensed into one. But for now, buyers for many types of office properties are unknown. The high-rate, low-transaction-volume environment is therefore masking the long-expected distress.
Author

Cole Perry
Associate Director of Research, Altus Group
Author
Cole Perry
Associate Director of Research, Altus Group
Resources
Latest insights