Australian construction price outlook - Q1 2026
While some material categories remain relatively stable, projects exposed to electrical, freight-intensive or energy-linked inputs face escalation risk.

Key highlights
The Middle East conflict intensified a construction market already under pressure from weak productivity, rising insolvencies and tighter feasibility, with fuel and freight volatility flowing rapidly through supply chains
Copper, piping and petrochemical-linked products are emerging as key pressure points as electrification, utilities and data centre development reshape material pricing
The market is adapting through earlier procurement, material substitution and changing specifications, but future escalation will build on today’s elevated cost base
Overview
Australia’s construction sector entered 2026 with weak productivity, rising insolvencies and growing feasibility pressure already weighing on new development activity. The Middle East conflict has added a fresh layer of volatility across energy, freight and petrochemical supply chains – intensifying conditions that were already challenging before the first oil shock headlines appeared.
An important qualification sits over the March quarter’s data. Altus Group’s material pricing collections were completed prior to 28 February 2026, with the full impact of the Strait of Hormuz disruption not yet reflected in the figures contained in this report. The June quarter data will provide a clearer indication of how these conditions flow through construction supply chains.
The Reserve Bank increased the cash rate to 4.35% in May, citing higher fuel and commodity prices alongside persistent inflationary pressure. Expectations that inflation may remain elevated for longer are increasing uncertainty around the interest rate outlook. Higher financing costs weigh on project feasibility, particularly apartments. Total dwellings approved in March 2026 fell by 10.5%, with higher density dwellings down 26.0%.
The May 2026 Federal Budget reinforced the Australian Government’s focus on housing supply, with total housing investment forecast to reach a record $47 billion. Measures include an additional $2 billion for enabling infrastructure such as power, water and road connections. This brings total investment to $6.3 billion – although the Urban Development Institute of Australia estimates $16 billion is required – and is likely to sustain demand across materials linked to housing delivery, including concrete, copper, piping and electrical products.
The Budget introduced significant changes to negative gearing and capital gains tax settings for existing residential property, while retaining more favourable treatment for new housing supply. This may shift some investment toward new residential construction, potentially elevating demand for materials commonly used in housing delivery like structural timber.
The closure of the Strait of Hormuz had an immediate impact on oil markets, freight and transport costs. But a more complex story for the construction industry sits further upstream in the petrochemical supply chain. Disruption to manufacturing capacity and feedstock production is impacting chemicals, plastics, PVC, polyethylenes and piping products used in construction. Reece, for instance, confirmed price increases of 36% across selected pipe categories in March.
Copper and electrical products are also under pressure from electrification, utilities and data centre expansion. Microsoft’s $25 billion investment by 2029 is just one indicator of future demand. These projects also compete directly for electrical trades, mechanical services and utility infrastructure already operating under capacity pressure.
The composition of Australia’s infrastructure pipeline is also shifting. The Inland Rail project will terminate at Parkes – 1,000 kilometres short of the original destination in Brisbane – after costs exceeded $45 billion. For a sector already managing elevated insolvencies, this cancellation sends a signal to infrastructure investors about sovereign risk.
Overall, these conditions contribute to uneven pricing. While some material categories remain relatively stable, projects exposed to electrical, freight-intensive or energy-linked inputs face escalation risk. At the same time, higher borrowing costs and softer private sector conditions place greater focus on procurement strategy, feasibility assessment and project-specific cost planning.
Australia’s construction sector may be caught in a vicious circle. Slower private sector activity may ultimately require further stimulus to support housing delivery, yet additional demand entering an already capacity-constrained market risks prolonging inflationary pressure across labour and materials.
The June quarter data should provide the clearest picture yet of how these competing pressures are reshaping construction pricing, feasibility and market behaviour.
Outlook on construction cost escalation
| Figure 1 - Altus Group’s outlook on construction cost escalation
Sydney | Brisbane | Melbourne | Perth | |
|---|---|---|---|---|
2019 | 4.0% | 3.0% | 3.5% | 2.5% |
2020 | 3.5% | 2.5% | 3.75% | 3.75% |
2021 | 4.5% | 3.25% | 4.0% | 7.25% |
2022 | 7.5% | 8.5% | 7.5% | 7.5% |
2023 | 5.9% | 9.25% | 6.25% | 6.75% |
2024 | 5.50% | 7.50% | 4.75% | 5.50% |
2025 | 4.50% | 7.00% | 4.50% | 5.75% |
2026 (previous forecast) | 6.50% (4.50%) | 9.50% (7.50%) | 6.00% (4.00%) | 7.50% (5.50%) |
2027 (previous forecast) | 4.75% (4.25%) | 8.25% (7.75%) | 4.25% (3.75%) | 5.50% (5.00%) |
2028 (previous forecast) | 4.50% (~) | 8.00% (~) | 4.00% (~) | 5.25% (~) |
Note: These figures are general, and individual projects and asset classes may have dramatically different spreads of costs. Previous forecasts were made in March 2026.
Source: Altus Group
Projects priced before late February 2026 carry unpriced exposure across fuel, freight, concrete, aluminium and every petrochemical-derivative input.
Contractors are actively repricing energy-sensitive scopes and holding no fixed positions where supply chains remain unresolved. Escalation clauses, early procurement lock-in and project-specific cost reviews are baseline commercial discipline.
We are monitoring our forecasts for major cities based on two scenarios:
Scenario 1: Stabilisation by end of Q2
If shipping conditions and energy markets stabilise, current disruption may remain relatively contained. Freight surcharges and pressure on petrochemical-derived materials – including insulation, membranes, PVC conduit and sealants – would partially recover. The escalation forecasts published in this report (shown above) have already been adjusted to reflect current market conditions, but assume disruption eases before the end of June and supply chain confidence stabilises.
Scenario 2: Prolonged disruption
If energy and supply chain disruption persists, additional escalation pressure may emerge across fuel-intensive and petrochemical-linked materials, including aluminium, plastics and selected civil and façade products. Under this scenario, annual escalation forecasts could increase by an additional 2–3%, with the heaviest loading on projects with significant mechanical, façade and civil infrastructure scopes.
Given the variability across project type, size, location and materials, consultation with a professional quantity surveyor remains essential to ensure accurate forecasting and defensible risk management.
Material price snapshot
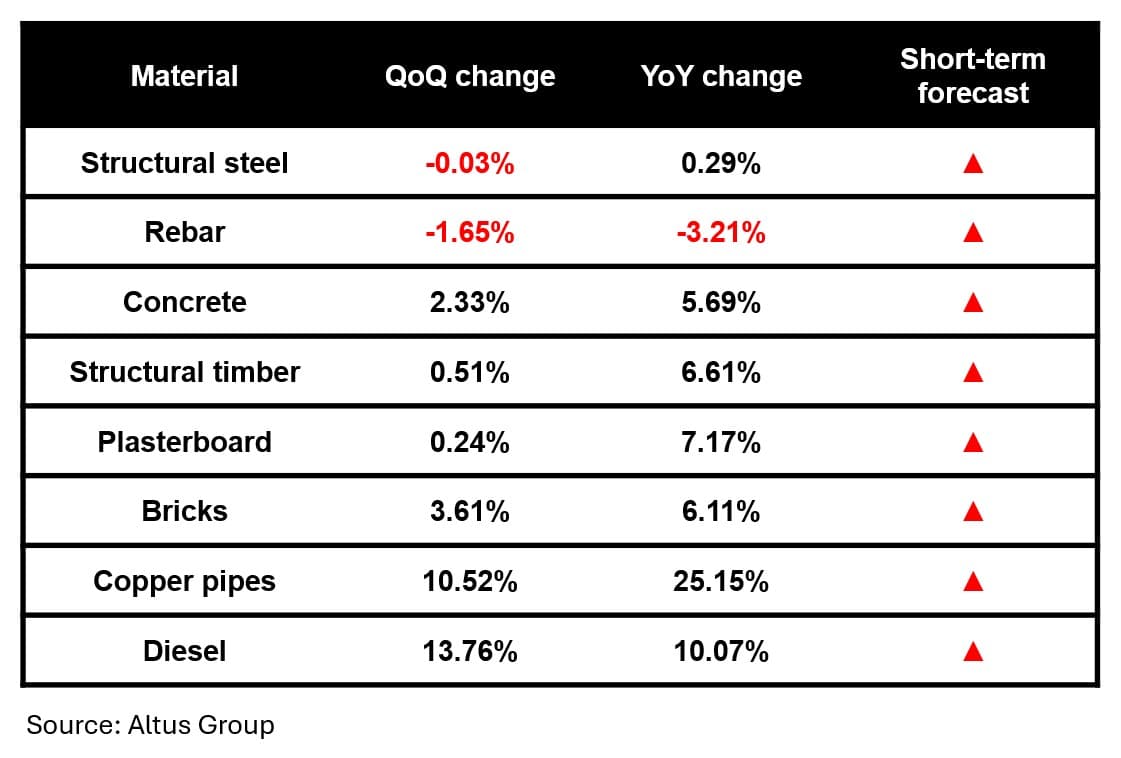
Figure 2 - A snapshot of Australian construction material price trends - Q1 2026
| Figure 3 - Altus Materials Escalation Index (Australia)
Altus Materials Escalation Index (Australia)
Download
Source: Altus Group
Material price movements
Structural steel and rebar: Prices were flat to slightly down this quarter, although recent anti-dumping measures on imported steel products may place upward pressure on pricing. The Australian Government has imposed duties of up to 82% on Chinese hot-rolled coil steel and increased duties on rebar imports (23.7% in May 2026, up from 19% in April). Preliminary levies have also been imposed on Malaysia, Thailand, Turkey and Vietnam. Combined with Hormuz-related freight disruption, upward price pressure is expected to build materially from Q2 onward.
Concrete: Prices continue to rise. Holcim and Heidelberg Materials have already applied fuel surcharges of $8.67 and $8.10 per cubic metre respectively. Operators have reported imported cement cost escalation of 15%, local grinding costs up by 10%, and trucking adding a further 12–15%. As these surcharges post-date the data collection period, Q2 pricing is still expected to reflect higher transport and energy costs, although some fuel surcharge pressure has recently begun to soften..
Structural timber: A modest quarterly rise understates the underlying structural tension in the timber market. Australia’s 12-month plywood import volume crossed 500,000 cubic metres for the first time in January 2026, a 21.8% uplift year-on-year, with China supplying 43.8% of Australia’s $3 billion wood products import bill, keeping headline prices in check. However, domestic production has scaled back in response to import competition, and the year-to-date figure of +6.61% signals that underlying inflation is running well ahead of the quarterly read. Engineered wood products sourced predominantly from Asia are most exposed to further increases.
Plasterboard: This high-volume, bulky product is freight-sensitive; logistics costs represent a meaningful share of landed price, and the Hormuz-driven diesel surge will flow into delivery costs before appearing in spot pricing data. Further upward pressure is expected in the June quarter, as fuel surcharges already active in the market work through the supply chain.
Bricks: The largest quarterly rise among structural materials was recorded, consistent with the energy intensity of kiln firing and with sustained housing construction demand. The Hormuz shock is amplifying both production and delivery costs, with further quarterly increases are expected.
Copper: The +25.15% year to date rise is the largest of any tracked material, and was recorded before the Hormuz disruption had any measurable freight effect. The Gulf conflict has disrupted sulphur supply – a critical input for SX-EW copper and HPAL nickel processing – with some producers already reducing run rates. Continued expansion in energy and digital infrastructure is expected to support pricing pressure across electrical materials and services.
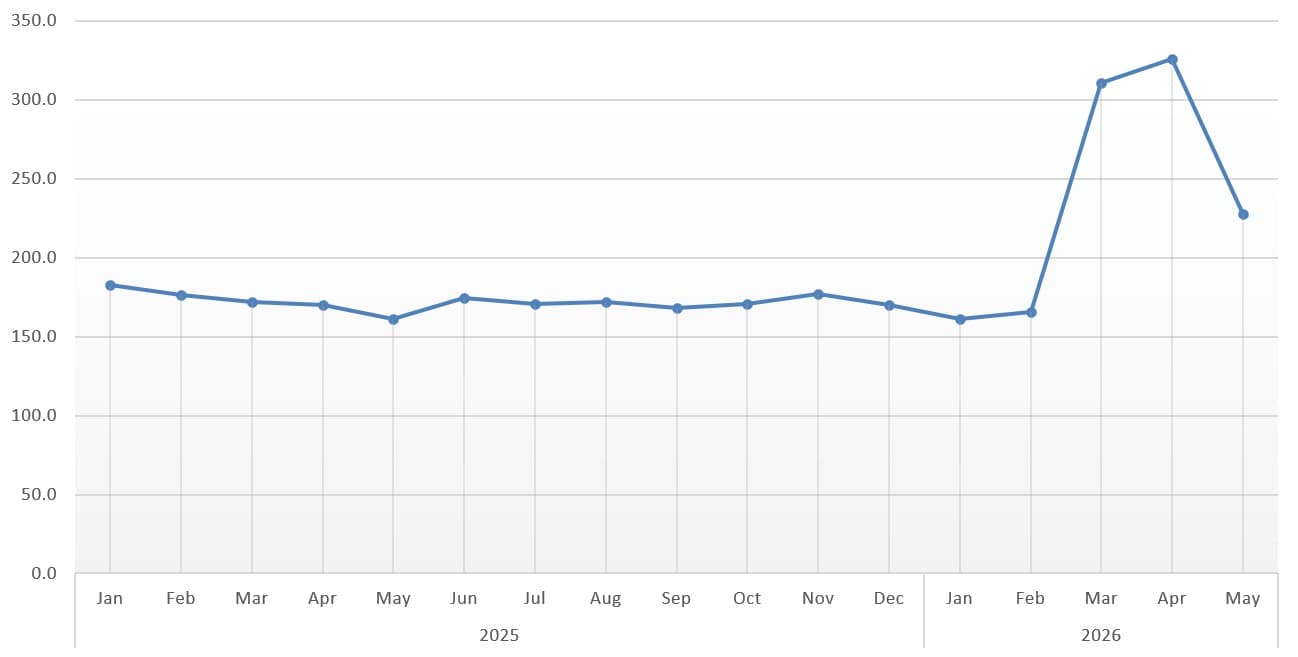
Diesel: This cost multiplier is embedded in every other material category. Australia imports roughly 90% of its fuel, and prices spiked sharply in March following disruption to Middle East oil supply, although much of this movement falls outside the Australian Bureau of Statistics’ collection period. The June quarter will deliver the first full data read of a confirmed market event: diesel rose 41% in March alone, from 181 to 256 cents per litre.
Figure 4 - Diesel price (Average National)
Source: Australian Bureau of Statistics

Make informed decisions on your projects
Expert construction cost advice to effectively manage your large residential, commercial and infrastructure development projects throughout Australia.
Macro-economic review
Consumer Price Index
| Figure 5 – All groups CPI, Australia, quarterly and annual movement (%)
All Groups CPI Australia
Quarterly and annual movement (%)
Download
Source: Australian Bureau of Statistics | Altus Group
Australia’s headline CPI rose 4.6% in the 12 months to March 2026 – the highest annual rate since September 2023 – driven largely by fuel and transport costs following disruption to global oil supply. Automotive fuel posted a 32.8% monthly increase – the largest since the series began in 2017. For construction cost forecasting, this is the most consequential CPI read in recent years: fuel is a cost multiplier across materials delivery, plant operation, concrete batching and freight. The 8.9% annual rise in transport and 6.5% rise in housing – the two groups most directly connected to construction activity – confirm that cost pressure is neither transient nor narrowly concentrated.
Producer Price Indices – Input
| Figure 6 – Producer Price Indices (PPI) – Input, Australia
Producer Prices Indexes (PPI) - Input, Australia
Download
Source: Australian Bureau of Statistics | Altus Group
Prices for input materials used in house construction rose this quarter, driven by increases in raw material costs, particularly for manufactured construction products. Copper and aluminium recorded large increases, contributing to higher prices for electrical equipment, most notably electric cable and conduit. Ready-mixed concrete rose by 1.7%, consistent with the energy-intensive production dynamics and fuel surcharges. A modest fall in timber and board products was driven by weak demand for timber windows rather than any structural easing in the supply chain. These input index movements reflect conditions before the Hormuz shock was priced.
Producer Price Indices – Output
| Figure 7 – Producer Price Indices (PPI) - Output, Australia
Producer Prices Indexes (PPI) - Output, Australia
Download
Source: Australian Bureau of Statistics | Altus Group
Building construction output prices rose 1.0% this quarter, as house construction recorded its third consecutive quarter of growth of 1% or more. Public infrastructure activity continues to drive competition for limited resources, including labour and concrete, with higher copper prices flowing through to electrical scopes. Annual building construction output price growth of 4.2% remains above the trimmed mean, confirming that construction is still inflating faster than the broader economy. Labour shortages of skilled resources in the Tier 1 subcontractor market, combined with major unions targeting pay increases of at least 4%, translates directly into higher project costs. Output price pressure is therefore structural rather than cyclical.
Wage Price Index
| Figure 8 – Wage Price Index (WPI), Australia
Wage Price Index (WPI), Australia
Download
Source: Australian Bureau of Statistics | Altus Group
The seasonally adjusted Wage Price Index rose 0.8% this quarter, with annual growth reaching 3.4% over the 12 months to December 2025. This modest rise understates the commercial reality. Pressure for above-WPI settlements in the next round of enterprise bargaining agreement negotiations will occur as construction insolvencies further tighten the available subcontractor pool and give surviving trades stronger pricing power. EBA renewal timing, trade availability and market capacity will influence costs over the remainder of 2026.
Building approvals
| Figure 9 – Building approvals, Australia
Building Activity
Source: Australian Bureau of Statistics | Altus Group
Net overseas migration reached 306,000 in 2024–25, while housing delivery was well below the levels required to meet demand. Total dwellings approved in March 2026 fell 10.5% to 17,300 seasonally adjusted, with private sector dwellings excluding houses down 26.0%. Only 174,030 homes were completed in the first year of the National Housing Accord – 27.5% below the 240,000 annual rate required. The National Housing Supply and Affordability Council now projects a shortfall of 262,000 dwellings over the full five-year Accord period, with no state or territory on track to meet its share of the target.
Summary
Highly optimised construction supply chains are sensitive to disruption, but they are also adaptive.
The diesel spike following the Strait of Hormuz closure is illustrative. Supply did not disappear overnight, but demand surged rapidly as Australians moved to secure fuel availability – echoing the stockpiling behaviour during COVID-19. Prices have since moderated, but the episode shows how limited buffers can quickly intensify pricing movements.
The issue is not simply fuel at the bowser, but the flow-on effect from oil and feedstocks into plastics, PVC, polyethylenes, chemicals for manufacturing or refining and other construction products. Manufacturing capability in the Middle East has been damaged, and prices will remain elevated even after fuel stabilises.
The greatest risk is not simply higher costs, but feasibility instability. With timelines for delivery of long lead items remaining compromised it is also pressurising project durations. The real economic impact of sustained volatility will be projects delayed, redesigned, value-engineered or abandoned.
However, the market continues to adapt faster than headlines suggest. On some projects, copper piping is being replaced by stainless steel – historically the more expensive option. Builders are locking in procurement earlier, suppliers are repricing selectively and contractors are changing specifications. These are all signs of adaptation.
Projects that succeed over the next cycle will be flexible across procurement, design, materials selection and delivery strategy as the market continues to stress-test every assumption built into modern construction supply chains.
Methodology
Market research into the supply cost of core materials is conducted on a quarterly basis with manufacturers and suppliers. Our market assessment also involves a thorough analysis of secondary sources of market data on materials and labour prices.
These sources include the Australian Bureau of Statistics (ABS), the Australian Institute of Quantity Surveyors (AIQS), Fuel Price Index, Metal and Raw Material Price, and proprietary cost data from Altus Group.
Disclaimer
This publication has been prepared for general guidance on matters of interest only and does not constitute professional advice or services of Altus Group, its affiliates and its related entities (collectively “Altus Group”). You should not act upon the information contained in this publication without obtaining specific professional advice.
No representation or warranty (express or implied) is given as to the accuracy, completeness or reliability of the information contained in this publication, or the suitability of the information for a particular purpose. To the extent permitted by law, Altus Group does not accept or assume any liability, responsibility or duty of care for any consequences of you or anyone else acting, or refraining to act, in reliance on the information contained in this publication or for any decision based on it.
The distribution of this publication to you does not create, extend or revive a client relationship between Altus Group and you or any other person or entity. This publication, or any part thereof, may not be reproduced or distributed in any form for any purpose without the express written consent of Altus Group.
Disclaimer
This publication has been prepared for general guidance on matters of interest only and does not constitute professional advice or services of Altus Group, its affiliates and its related entities (collectively “Altus Group”). You should not act upon the information contained in this publication without obtaining specific professional advice.
No representation or warranty (express or implied) is given as to the accuracy, completeness or reliability of the information contained in this publication, or the suitability of the information for a particular purpose. To the extent permitted by law, Altus Group does not accept or assume any liability, responsibility or duty of care for any consequences of you or anyone else acting, or refraining to act, in reliance on the information contained in this publication or for any decision based on it.
The distribution of this publication to you does not create, extend or revive a client relationship between Altus Group and you or any other person or entity. This publication, or any part thereof, may not be reproduced or distributed in any form for any purpose without the express written consent of Altus Group.
Want to be notified of our new and relevant CRE content, articles and events?
Authors

Niall McSweeney
Head of Development Advisory, Asia-Pacific

Cody Bui
Quantity Surveyor
Authors
Niall McSweeney
Head of Development Advisory, Asia-Pacific
Cody Bui
Quantity Surveyor
Resources
Latest insights