Australian construction price outlook – Q4 2025
Q4 2025 data shows copper prices surged 16.5%, Brisbane leads national escalation through 2027 as structural cost pressures intensify for 2026.

Key highlights:
Copper is emerging as the next construction shock, driven by global electrification, data centres and grid investment – and this flows through to Australian services trades
A two-speed escalation market has emerged, with Brisbane the national hotspot as Olympic works, energy infrastructure and housing converge, Perth is elevated but stable while Sydney and Melbourne cool
Cost risk is structural, where public investment, delayed delivery and protracted insolvency rates mean timing, sequencing and trade mix now matter more than headline averages
Overview
Australia’s next construction shock is copper – and it runs straight through the services trades as a key commodity.
Copper prices surpassed US$13,000 per tonne in early 2026, driven by tight mine supply and a structural surge in demand from electrification, renewables and data centres.
S&P Global expects copper demand to rise from 28 million tonnes in 2024 to 42 million tonnes by 2040. Without major new supply, annual deficits could reach 10 million tonnes – around 25% below projected demand.
This matters for Australia because copper is no longer just a commodity; it is a signal of global industrial pressure that local markets must absorb. China alone consumes around half of global supply, while power grids and AI-driven data centres are the fastest-growing sources of demand.
This pressure shows up on Australian construction sites, as it flows directly through the services trades – electrical, mechanical, plumbing and vertical transport — where copper is embedded late in the build and difficult to substitute or defer.
Altus Group’s data shows copper prices are up 16.5% year on year, with electricians, plumbers, mechanical contractors and lift installers increasingly exposed to escalation between pricing and mobilisation. On larger jobs, that cost escalation is frequently measured in six figures. Altus Group is expecting two further price rises in electrical cable this year.
At the same time, ASIC statistics show construction has the highest rate of insolvencies, with 1,894 recorded in the financial year to 10 February 2026. In this environment, copper is the rare material where global demand pressure and on-site delivery risk reinforce each other, turning time itself into a cost multiplier.
The impact of a key services subcontractor failure is greater than that of a main contractor, because the subcontractor provides the warranty and is potentially exposed across multiple general contractors at the same time.
Construction cost pressures are amplified by factors beyond any single project. Public investment is absorbing a growing share of national construction capacity, particularly across infrastructure, energy and transmission, competing directly with private-sector projects for the same labour and services trades.
At the same time, delivery timelines are stretching: housing approvals and commencements have lifted, but completions have not followed. In a market where delays are now structural rather than exceptional, late-stage, services-heavy materials like copper carry disproportionate risk and escalation accelerates the longer projects take to reach site.
Outlook on construction cost escalation
| Figure 1: Altus Group’s outlook on construction cost escalation
Sydney | Brisbane | Melbourne | Perth | |
|---|---|---|---|---|
2019 | 4.0% | 3.0% | 3.5% | 2.5% |
2020 | 3.5% | 2.5% | 3.75% | 3.75% |
2021 | 4.5% | 3.25% | 4.0% | 7.25% |
2022 | 7.5% | 8.5% | 7.5% | 7.5% |
2023 | 5.9% | 9.25% | 6.25% | 6.75% |
2024 | 5.50% | 7.50% | 4.75% | 5.50% |
2025 | 4.50% | 7.00% | 4.50% | 5.75% |
2026 (previous forecast) | 4.50% (4.50%) | 7.50% (7.00%) | 4.00% (4.25%) | 5.50% (5.25%) |
2027 (previous forecast) | 4.25% (4.50%) | 7.75% (6.50%) | 3.75% (4.00%) | 5.00% (4.75%) |
Note: These figures are general, and individual projects and asset classes may have dramatically different spreads of costs. Previous forecasts were made in November 2025.
Source: Altus Group
A two-speed escalation story is emerging, and we have adjusted our forecast accordingly.
Brisbane is expected to remain the nation’s escalation hotspot through to 2027, fuelled by Olympic-related works, persistent labour shortages and supply chain pressures. The key challenge is timing. Multiple megaprojects – housing, transmission, renewables and Olympic infrastructure, including a $3.8 billion stadium – are converging in the same narrow window.
In comparison, cost escalation in Sydney and Melbourne has cooled due to weaker construction pipelines and fewer major project starts. Perth is also easing after its recent resource-driven spikes. Nevertheless, escalation rates remain well above pre-2021 levels, with meaningful relief unlikely before 2028 given entrenched material, labour and regulatory cost pressures.
Escalation rates vary widely by project type, size, location and material mix. Project-specific assessment, undertaken by professional quantity surveyors, is critical to understand cost exposure and escalation factors.
Material price snapshot
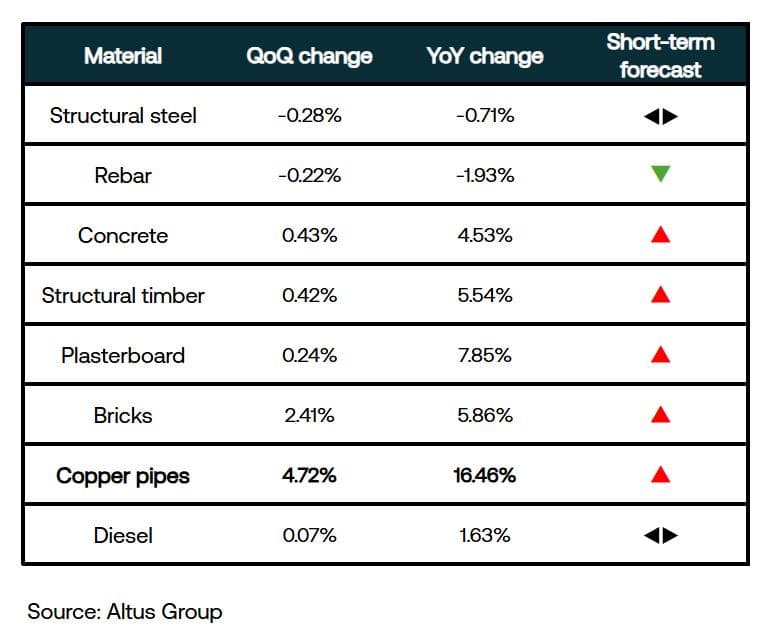
Figure 2: A snapshot of Australian construction material price trends – Q4 2025
| Figure 3 – Altus Materials Escalation Index (Australia)
Altus Materials Escalation Index (Australia)
Download
Source: Altus Group
Structural steel and rebar: Asian steel prices remain soft, reflecting weak Chinese construction demand and ample supply, which has flowed through to Australian import offers. Imported steel products are attracting anti-dumping scrutiny, raising the prospect of targeted tariffs that could tighten local supply and interrupt current price stability.
Concrete: Concrete prices continue to climb, fuelled by sustained infrastructure activity. Demand for this energy-intensive material is strong, with recent industrial attention on concrete transport and supply arrangements underscoring ongoing capacity constraints.
Structural timber: Timber prices remain relatively stable amid subdued housing demand, high inventory levels and a surge in low-priced imports. Australia’s forestry industry has sounded the alarm that Chinese imports, including lower-grade joinery products, are reaching Australia at about half the price of local timber. Timber mills have scaled back production, and this points to future supply-side pressure.
Plasterboard: Prices have trended higher this quarter, which may reflect construction activity moving into the later stages. As plasterboard is consumed in large volumes and typically installed late in the program, when delays, labour tightness and cost pressure are embedded, rising prices can be a signal of both price inflation and project risk exposure.
Bricks: Prices have softened slightly but remain elevated. Higher manufacturing costs, driven by energy-intensive production processes and increased transport expenses, continue to underpin prices.
Copper: Prices have risen this quarter and sharply over the year. See our opening commentary for further details.
Diesel: Diesel prices have fallen to pre-pandemic levels, reflecting a four-year low in global crude oil prices combined with lower global demand and increased production. This provides modest relief for transportation and logistics costs.

Make informed decisions on your projects
Expert construction cost advice to effectively manage your large residential, commercial and infrastructure development projects throughout Australia.
Macro-economic review
Consumer Price Index
| Figure 4 - All groups CPI, Australia, quarterly and annual movement (%)
All Groups CPI Australia
Quarterly and annual movement (%)
Download
Source: Australian Bureau of Statistics | Altus Group
The Consumer Price Index (CPI) rose 3.8% in the 12 months to December 2025, following a 3.4% rise in the 12 months to November 2025. Housing was the largest contributor to annual inflation, rising by 5.5%.
Housing is where inflation is most entrenched and where relief looks least likely. Rents rose by 4.8% in the year to December 2025, while the Reserve Bank of Australia (RBA) lifted the cash rate by 25 basis points to 3.85% in February and signalled further increases ahead.
Higher interest rates don’t just hit households – they also hit construction inventory strategies, willingness to discount, contract terms and escalation causes.
Producer Price Indices - Input
| Figure 5 – Producer Price Indices (PPI) – Input, Australia
Producer Prices Indices (PPI) - Input, Australia
Download
Source: Australian Bureau of Statistics | Altus Group
Input prices for house construction were mostly stable this quarter, with small overall increases due to higher costs for raw materials, energy, wages and fuel in manufactured building products. Ceramic products posted the largest increases, following annual price reviews, especially terracotta tiles. Timber, plasterboard and joinery prices rose slightly because of higher material and labour costs, though structural softwood prices fell. Cement products also lifted, driven by ongoing high energy and input costs.
Producer Price Indices – Output
| Figure 6 – Producer Price Indices (PPI) - Output, Australia
Producer Prices Indices (PPI) - Output, Australia
Download
Source: Australian Bureau of Statistics | Altus Group
Building construction prices increased this quarter as demand rose and higher labour costs were passed on. House construction prices rebounded after earlier declines, recording a second straight quarterly increase above 1%, with a 1.5% rise the strongest since late 2022. Public infrastructure projects continued to intensify competition for labour and materials.
Wage Price Index
| Figure 7 – Wage Price Index (WPI), Australia
Wage Price Index (WPI), Australia
Download
Source: Australian Bureau of Statistics | Altus Group
The Wage Price Index rose by 0.8%, and by 3.4% over the year. The RBA warns Australian workers are unlikely to see sustained real wage growth until at least mid-2027. This should not be read as easing labour cost pressure. Major unions are now openly targeting pay increases of at least 4% simply to keep pace with inflation. In construction, where enterprise agreements set the market rate, this can translate directly into higher project costs.
Building approvals
| Figure 8 – Building approvals, Australia
Building Activity
Source: Australian Bureau of Statistics | Altus Group
This graph suggests Australia’s housing problem is no longer about intent, but delivery.
Before 2020, housing completions typically lagged approvals and commencements by around 6-9 months, making them a reliable indicator of future housing supply. Post pandemic, approvals and commencements have lifted, but completions have failed to follow, leaving a widening gap between what is planned and what is delivered.
Labour shortages, builder failures, tighter financing and longer build times have stretched delivery well beyond historical norms. To meet the national target of 1.2 million new homes over five years, completions need to average around 60,000 dwellings each quarter. Current trends are materially short of that mark.
There is also growing evidence that some approvals are being pursued to lift land values, rather than to progress delivery – a key sign of a market bubble.
What we have is a structural supply problem: activity at the front end of the pipeline that is no longer translating into homes on the ground. The longer that gap persists, the more it amplifies cost, risk and delay across the system.
Summary
For the past two years, inflation has been framed as an imported problem: the residue of global supply shocks, energy volatility and geopolitics. That explanation no longer holds. Key imported inputs such as petrol and gas have eased, the Australian dollar has strengthened, and yet cost pressure remains stubborn. Inflation in Australia is now largely homegrown..
One major driver is fiscal policy. Federal government spending is forecast to reach 26.9% of GDP this financial year, the highest level outside the pandemic years since 1986. Long-dated programs – including the $330 billion defence pipeline and multi-billion-dollar investment in the energy transition – pull heavily on the same construction skills, services trades and delivery windows, as housing and commercial projects.
The result is a construction market where pricing power is returning, discounting has ended and late-stage materials like copper expose previously hidden risks.
For clients, the implication is clear: assumptions that once held about lead times, buffers and the absorbability of escalation no longer apply.
Methodology
Market research into the supply cost of core materials is conducted on a quarterly basis with manufacturers and suppliers. Our market assessment also involves a thorough analysis of secondary sources of market data on materials and labour prices.
These sources include the Australian Bureau of Statistics (ABS), the Australian Institute of Quantity Surveyors (AIQS), Fuel Price Index, Metal and Raw Material Price, and proprietary cost data from Altus Group.
Disclaimer
This publication has been prepared for general guidance on matters of interest only and does not constitute professional advice or services of Altus Group, its affiliates and its related entities (collectively “Altus Group”). You should not act upon the information contained in this publication without obtaining specific professional advice.
No representation or warranty (express or implied) is given as to the accuracy, completeness or reliability of the information contained in this publication, or the suitability of the information for a particular purpose. To the extent permitted by law, Altus Group does not accept or assume any liability, responsibility or duty of care for any consequences of you or anyone else acting, or refraining to act, in reliance on the information contained in this publication or for any decision based on it.
The distribution of this publication to you does not create, extend or revive a client relationship between Altus Group and you or any other person or entity. This publication, or any part thereof, may not be reproduced or distributed in any form for any purpose without the express written consent of Altus Group.
Want to be notified of our new and relevant CRE content, articles and events?
Authors

Niall McSweeney
Head of Development Advisory, Asia-Pacific

Cody Bui
Quantity Surveyor
Authors
Niall McSweeney
Head of Development Advisory, Asia-Pacific
Cody Bui
Quantity Surveyor
Resources
Latest insights