2025: The year of the CRE rebound
New data confirms 2025 was the year the CRE recovery went broad-based, with prices, deal counts, and transaction sizes all rising together.

Key highlights:
Source: Reonomy market data and analysis
According to an analysis based on data from Reonomy, 2025 was the first year since 2021 in which price growth, transaction counts, deal sizes, and building sizes all moved higher in tandem
That breadth of recovery stood in contrast to 2024, when rising dollar volume masked continued declines in properties sold as price per square foot continued a steady climb
The gap to pre-pandemic levels of activity is narrowing but uneven. Trailing four-quarter dollar volume in Q4 2025 sat just 5% below Q4 2019, yet 15% fewer properties sold and the median building was 8% smaller, offset by a 53% increase in price per square foot and a corresponding 41% rise in median deal size
Whether this broadening continues into 2026 will depend on the path of interest rates, capital availability, and investor conviction, but for the first time in several years, every major trend line is pointing in a positive direction
From patchy market improvement to broad-based recovery
Data from the Q4 2025 Investment & Transactions Quarterly Report confirms what many may suspect – that 2025 was the year the CRE recovery became broad-based. For the first time since 2021, every major measure of transaction activity moved higher in tandem. Price per square foot accelerated, more properties were sold, and the physical and dollar size of completed deals grew across all major property types. This stands in contrast to 2024, when rising dollar volume masked continued declines in the number of properties actually selling. With the benefit of hindsight, late 2023 to early 2024 now looks like the trough for US CRE transaction activity, and 2025 is where the market began to regain its footing. And to understand why this matters, it helps to look at what sits beneath headline dollar volume figures.
What dollar volume does and doesn't tell you
Dollar volume is among the most cited measures of commercial real estate market health, and for good reason: it captures the total sale amount of all completed transactions in a single, intuitive number. But on its own, it says little about the character of the activity beneath it. Are prices rising or falling? Are the properties that sell getting physically larger or smaller? Are more or fewer transactions closing?
Figure 1: Dollar volume and number of properties traded
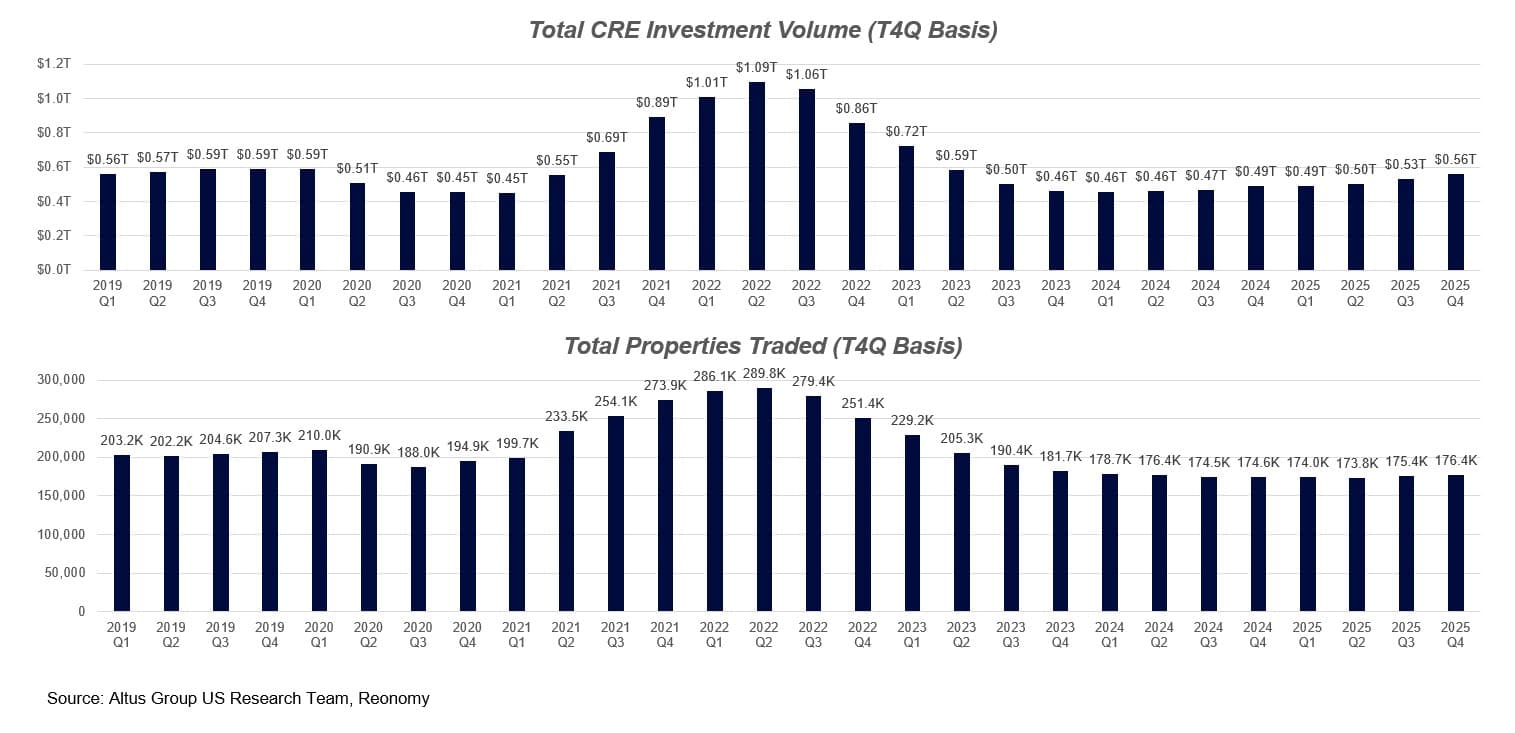
A walk through the last several years illustrates the point. In 2020, every underlying component of transaction activity drifted lower as the pandemic slowed the market across the board. Transacted price per square foot declined, the median size of a sold property fell, and the number of properties trading hands slipped, pushing trailing four-quarter dollar volume to just over 75% of Q4 2019 levels. The 2021 rebound was similarly uniform in the opposite direction: prices surged, transaction counts jumped, and dollar volume followed.
From there, the story grew more complicated. By 2022, rate hikes began to cool the market. Prices were still rising modestly relative to 2021, but building sizes and transaction counts started to contract, pulling dollar volume down with them. By 2023, the contraction deepened as prices softened, the properties that sold got smaller, and the number of completed deals fell sharply.
2024 is where the components started to diverge. Price per square foot began to recover, and building sizes ticked up slightly, but the number of properties selling continued to decline. The net effect was that dollar volume grew even as deal count shrank, likely reflecting a continued flight to quality as capital concentrated in higher-priced, institutional-grade assets while broader activity remained subdued. Pricing had stabilized, and investor confidence was returning in certain segments, but the recovery had not yet broadened out.
2025 broke the pattern
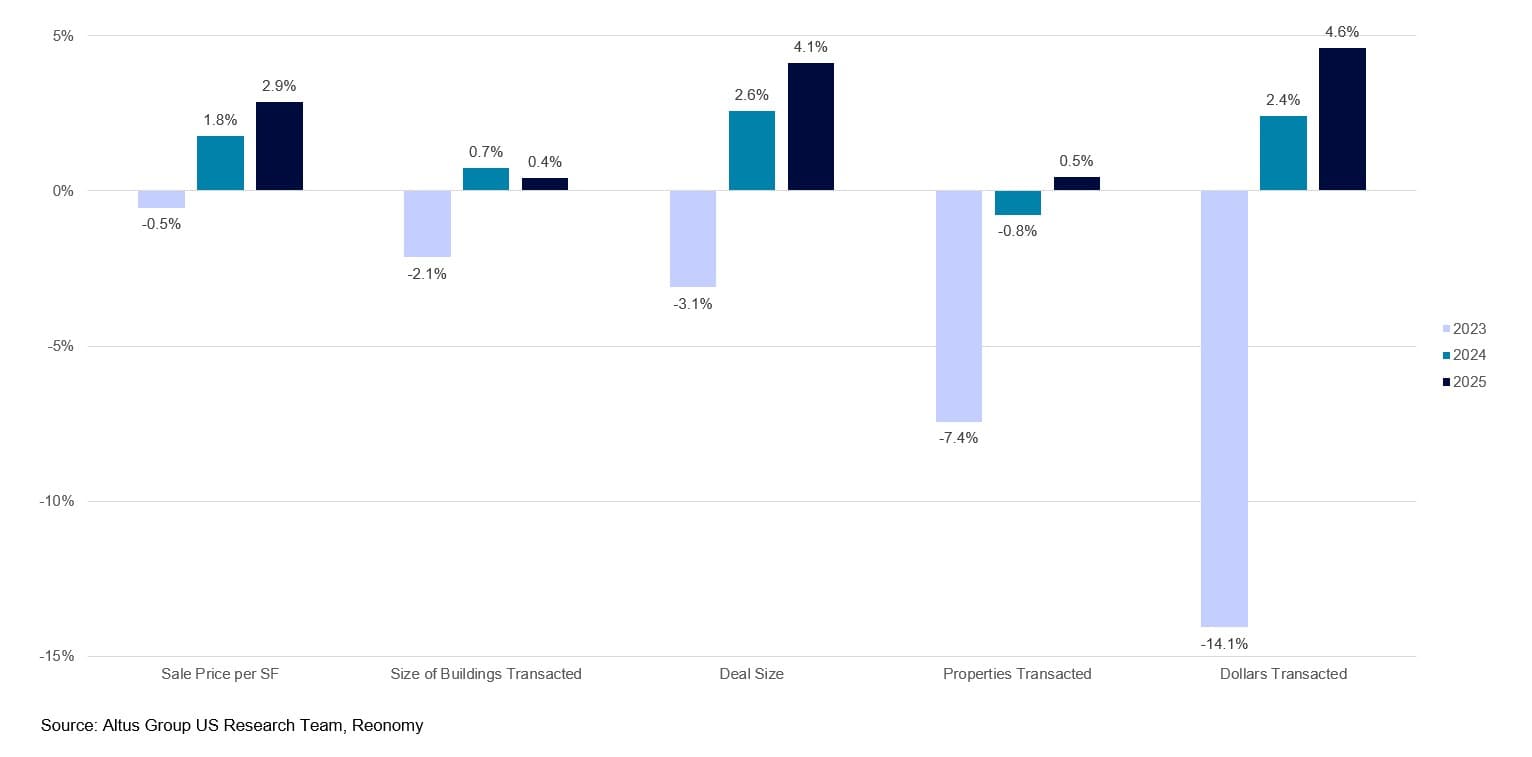
2025 is where the story changed. For the first time since 2021, all the underlying components moved higher together again: price per square foot, building sizes, transaction counts, and total dollar volume. The recovery was no longer carried by any single variable. Median sale price per square foot grew at a 2.9% compounded quarterly rate, the size of a sold building at 0.4%, and deal size at a resulting 4.1%. The number of properties sold grew at 0.5% per quarter, and dollars transacted at a strong 4.6% quarterly clip. In fact, all major growth metrics accelerated year-over-year, with the sole exception of building size, which while positive in 2025, slipped from 2024.
Figure 2: Compounded quarterly growth rates, key transaction activity metrics
Several additional milestones underline the shift. 2025 was the first full calendar year since 2021 to register an annual increase in the number of properties sold. It was the first four-quarter period since late 2021 in which all major property types posted double-digit year-over-year gains in median price per square foot. And after shrinking for much of 2022 through early 2024, the median physical size of sold assets grew throughout 2025 across every major property type, with median deal size in dollar terms following the same path.
Figure 3: Year-over-year gains in median price per square foot by property type
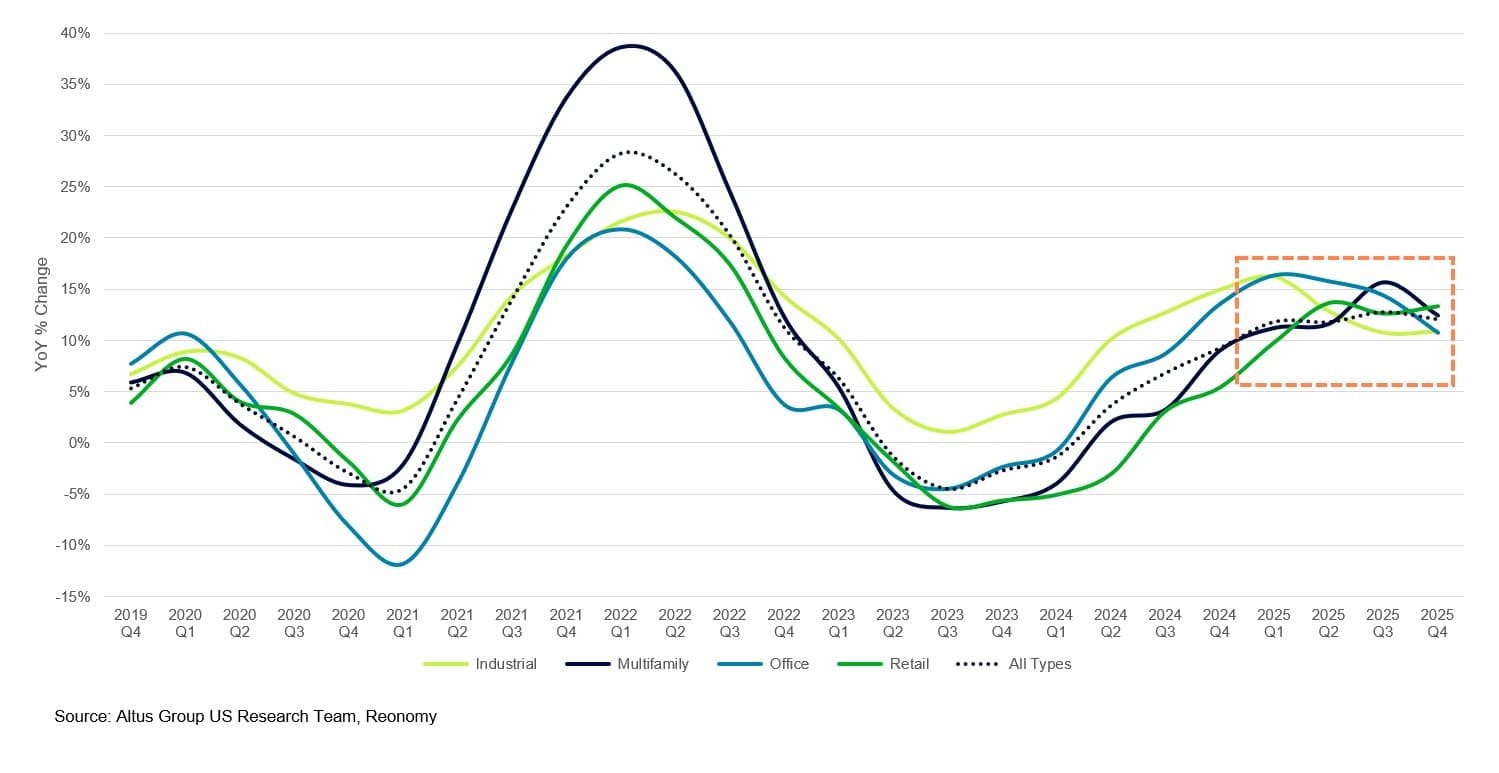
Prices kept climbing, but this time they were accompanied by more completed transactions involving larger buildings. That kind of broad synchronization hadn't been present since 2021.
Progress, but not a full recovery
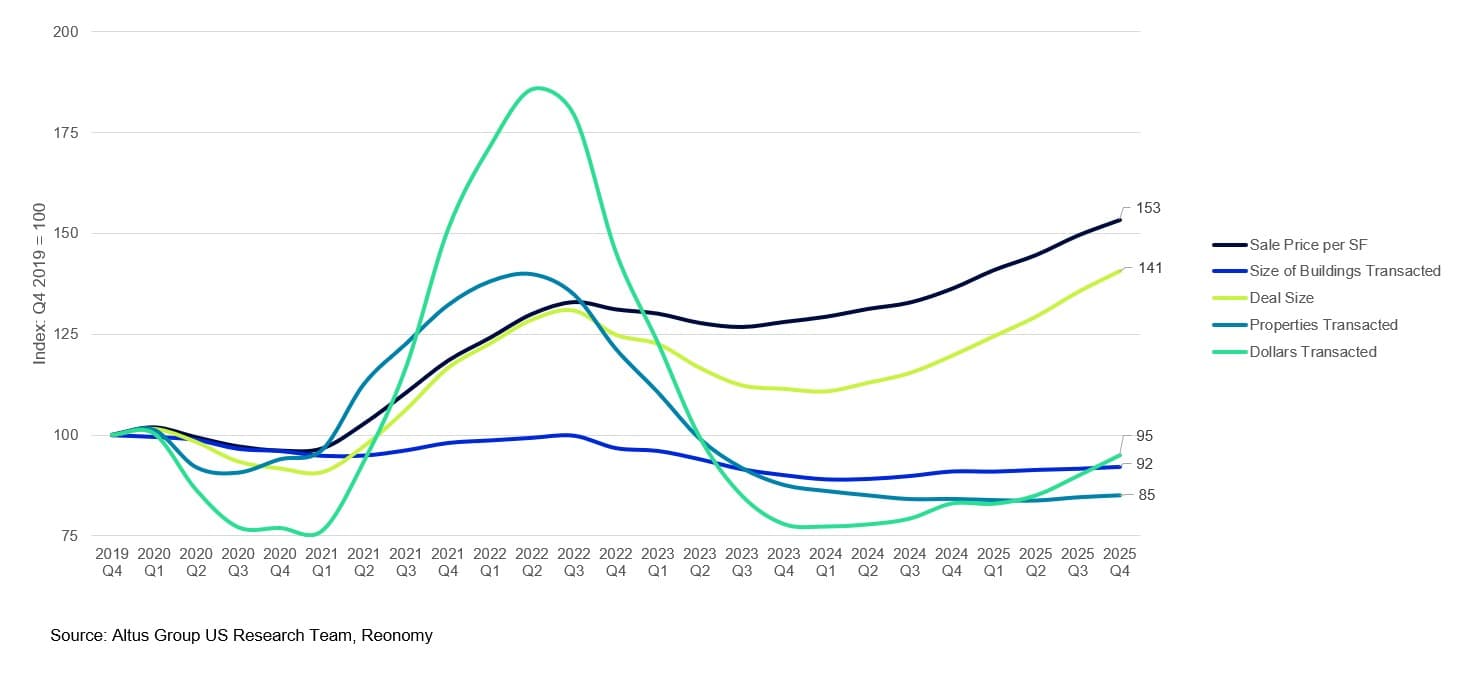
But for all the positive momentum, the market is still shy of its pre-pandemic baseline. On a trailing four-quarter basis, dollar volume in Q4 2025 sat just 5% below Q4 2019 levels. That near-parity sounds encouraging, but 15% fewer properties sold over the same period, and the median building that transacted was 8% smaller. What closed the gap was pricing: median price per square foot was up 53% relative to Q4 2019, and median deal size rose 41%. The recovery has been powered more by appreciation than by a full return of activity, which means there's still meaningful room to grow before transaction counts match where they were heading into 2020.
Figure 4: Components of transaction activity since Q4 2019
Looking ahead
The data increasingly points to late 2023 and early 2024 as the trough for CRE transaction activity, with 2025 marking the point where the market began to find its footing across the board. Not just in pricing, which had already turned the corner in 2024, but across the full suite of metrics that distinguish a broad recovery from a narrow one. Whether that broadening continues into 2026 will depend on the path of interest rates, capital availability, and investor conviction, but for the first time in several years, the trend lines are all pointing in the positive direction.
Want to be notified of our new and relevant CRE content, articles and events?
Disclaimer
This publication has been prepared for general guidance on matters of interest only and does not constitute professional advice or services of Altus Group, its affiliates and its related entities (collectively “Altus Group”). You should not act upon the information contained in this publication without obtaining specific professional advice.
A number of factors may influence the performance of the commercial real estate market, including regulatory conditions and economic factors such as interest rate fluctuations, inflation, changing investor sentiment, and shifts in tenant demand or occupancy trends. We strongly recommend that you consult with a qualified professional to assess how these and other market dynamics may impact your investment strategy, underwriting assumptions, asset valuations, and overall portfolio performance.
No representation or warranty (express or implied) is given as to the accuracy, completeness or reliability of the information contained in this publication, or the suitability of the information for a particular purpose. To the extent permitted by law, Altus Group does not accept or assume any liability, responsibility or duty of care for any consequences of you or anyone else acting, or refraining to act, in reliance on the information contained in this publication or for any decision based on it. The distribution of this publication to you does not create, extend or revive a client relationship between Altus Group and you or any other person or entity. This publication, or any part thereof, may not be reproduced or distributed in any form for any purpose without the express written consent of Altus Group.
Author

Cole Perry
Associate Director of Research, Altus Group
Author
Cole Perry
Associate Director of Research, Altus Group
Resources
Latest insights