
Q4 2024 Results
CRE industry conditions & sentiment survey - United States
Gain insights into the market sentiment, conditions, metrics, and issues affecting the US commercial real estate industry based on our Q4 2024 survey.
Q4 results indicate better access to capital, a greater interest in transactions, and data centers are gaining popularity
Altus Group conducted a survey across the United States to provide insights into the market sentiment, conditions, metrics, and issues affecting the commercial real estate (CRE) industry.
Key questions include:
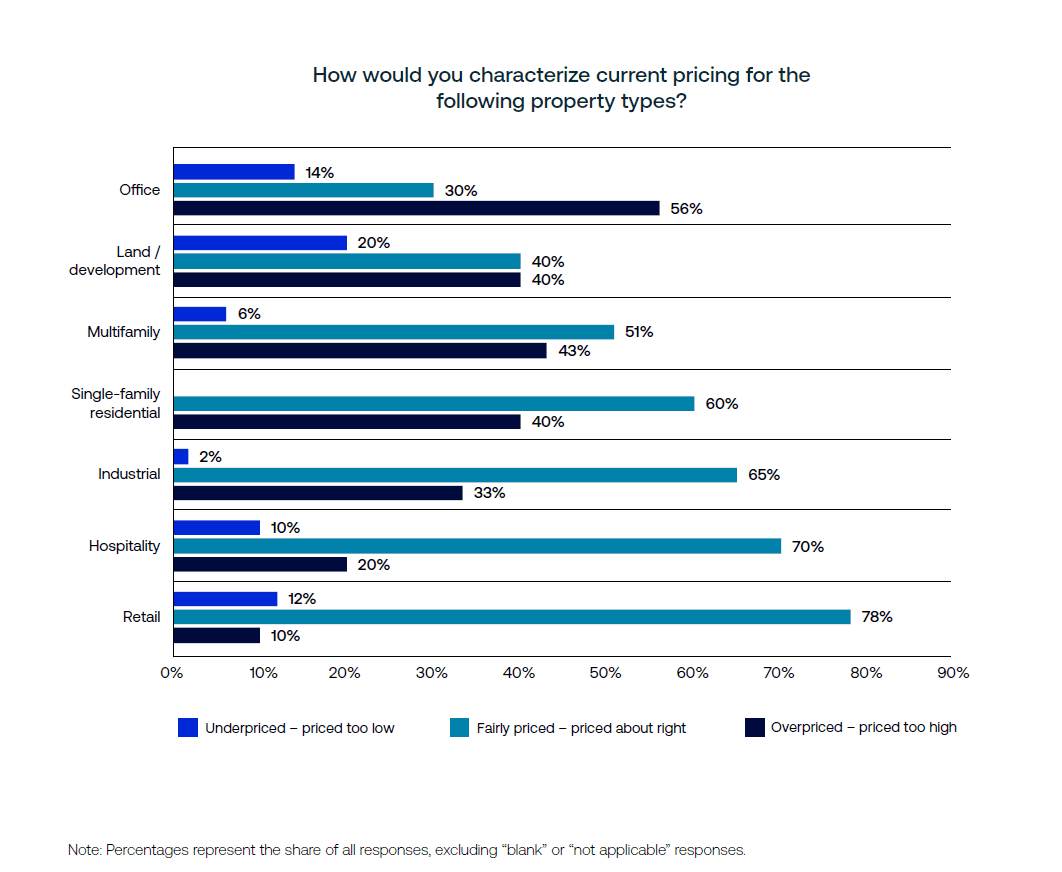
How would you characterize current pricing by property type?
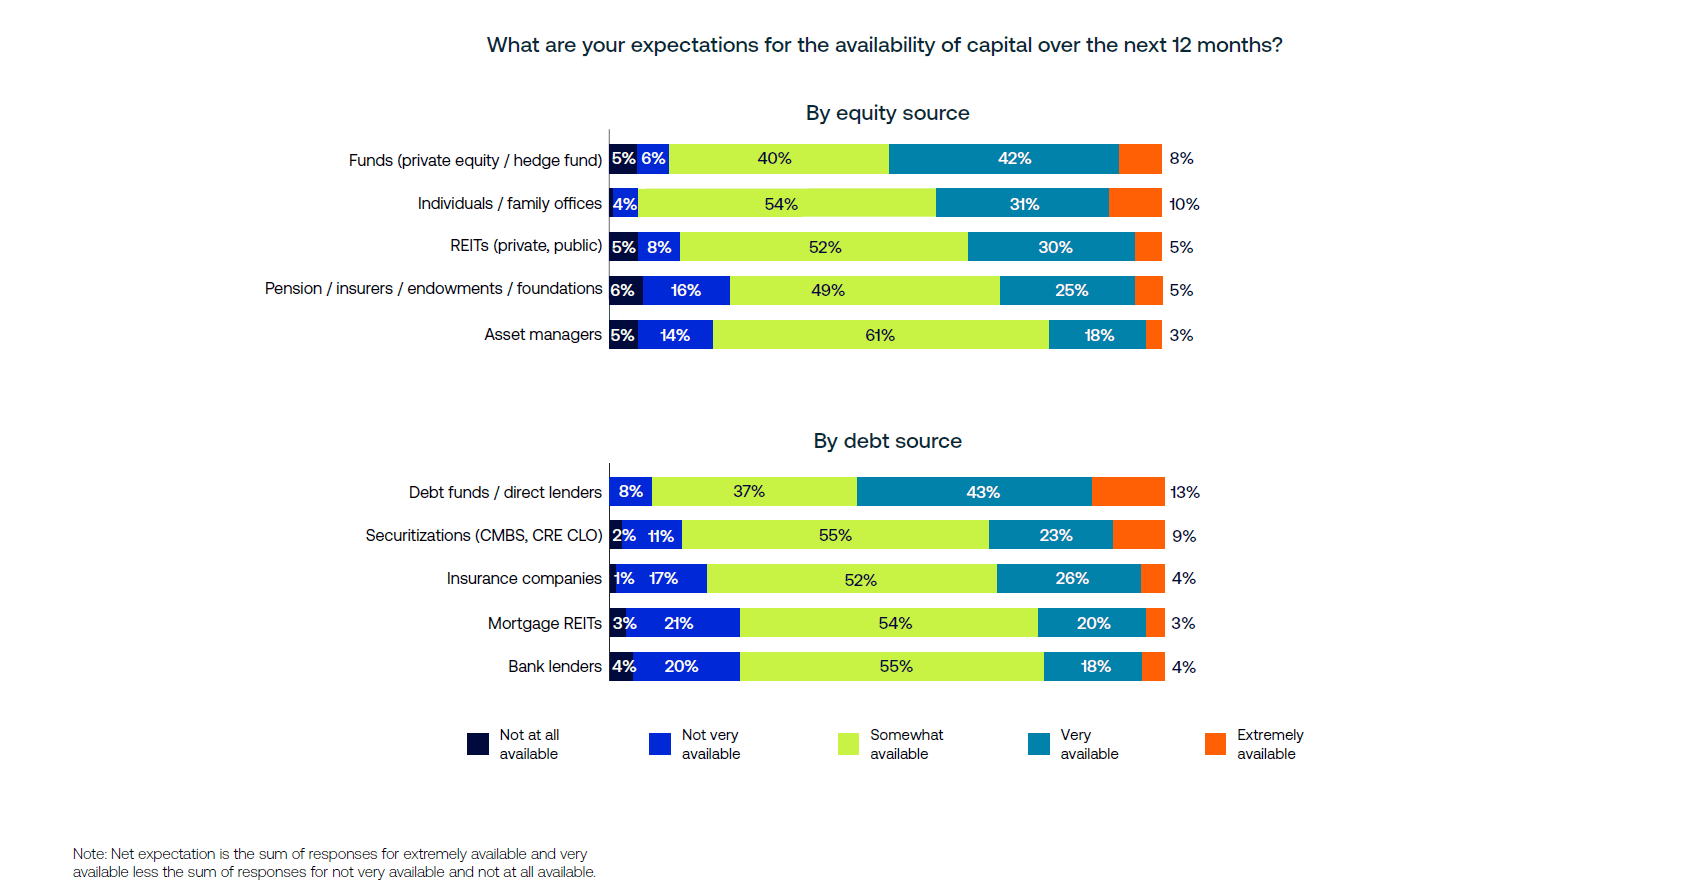
What are your expectations for the availability of capital over the next 12 months?
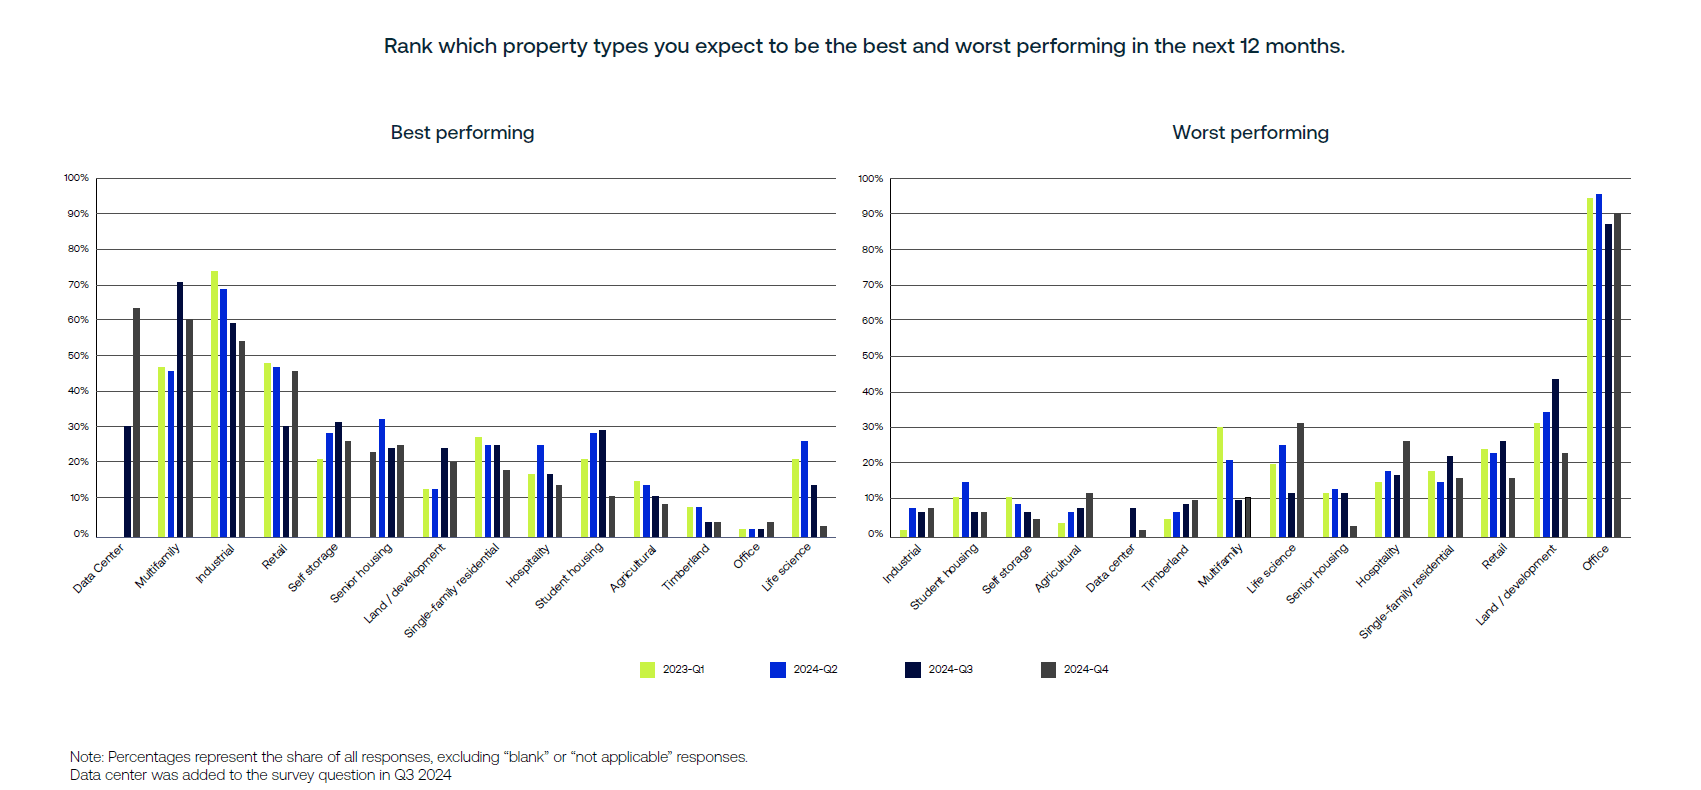
Rank which property types you expect to be the best/worst performing in the next 12 months.
We are happy to announce that the Q4 2024 results for the US are now available for download.
Key findings from the report
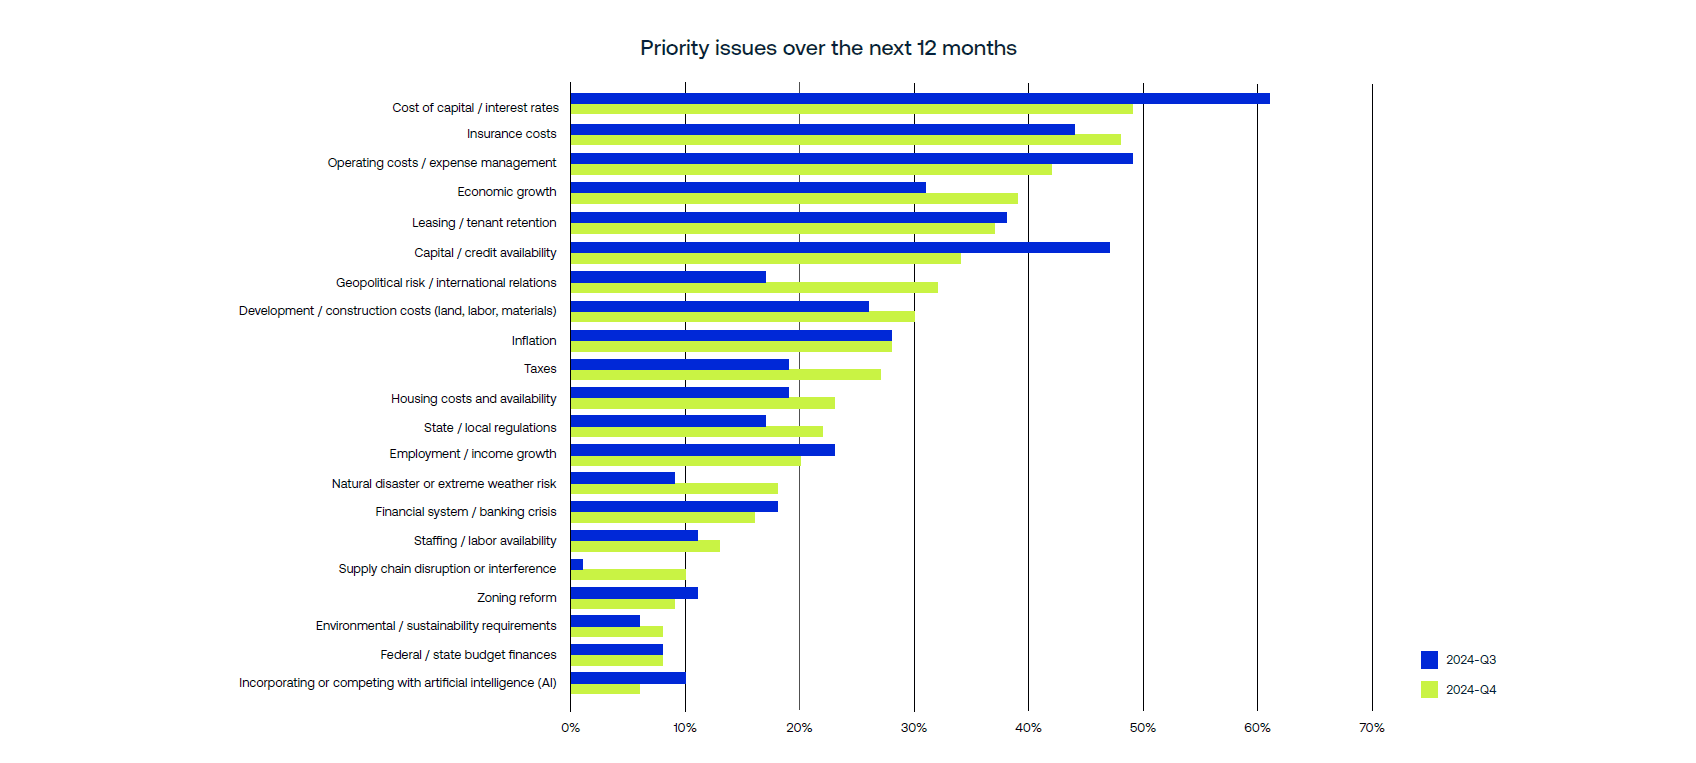
Despite an 11 percentage point decline over Q3, cost of capital remained the top concern with nearly half of US respondents citing it as a top priority for the next 12 months.
A majority of respondents indicated that they believe that current prices on retail, hospitality, industrial, single-family rental, and multifamily are "priced about right".
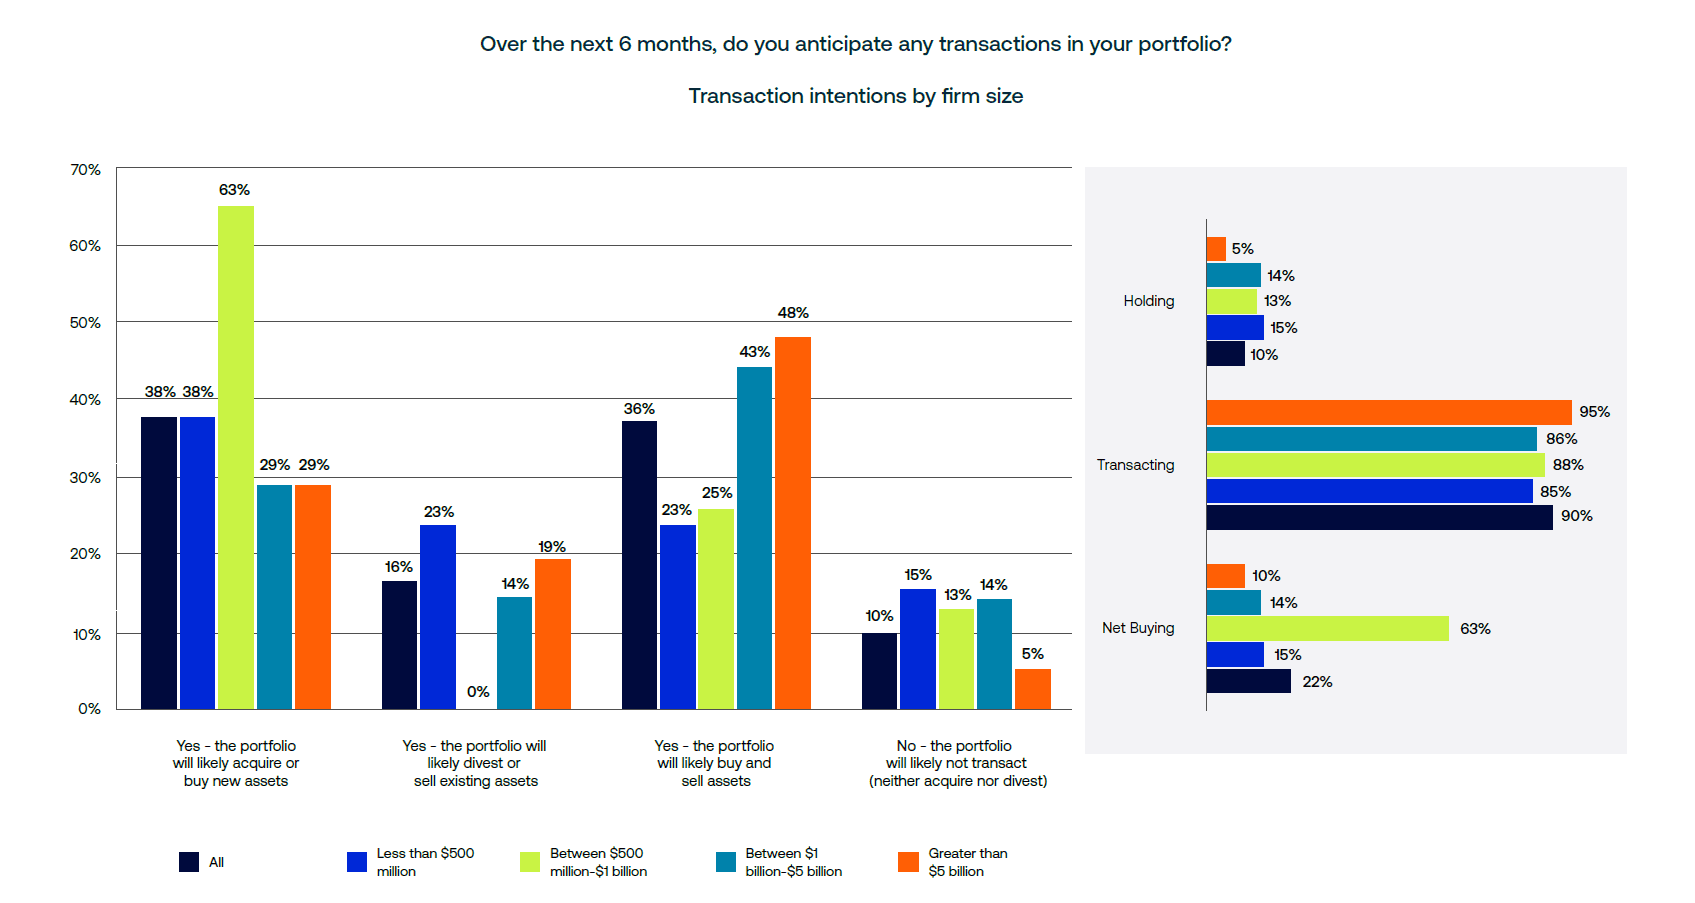
Ninety percent of respondents signaled intent to transact over the next 6 months, with incrementally more looking to sell than in prior quarter.
Fifty-six percent of respondents stated that they expected debt funds to be very or extremely available in the coming year, the most of any debt source.
Data centers surged into first place as the most anticipated top-performing property type, with 62% of respondents expecting it to rank among the best performers.

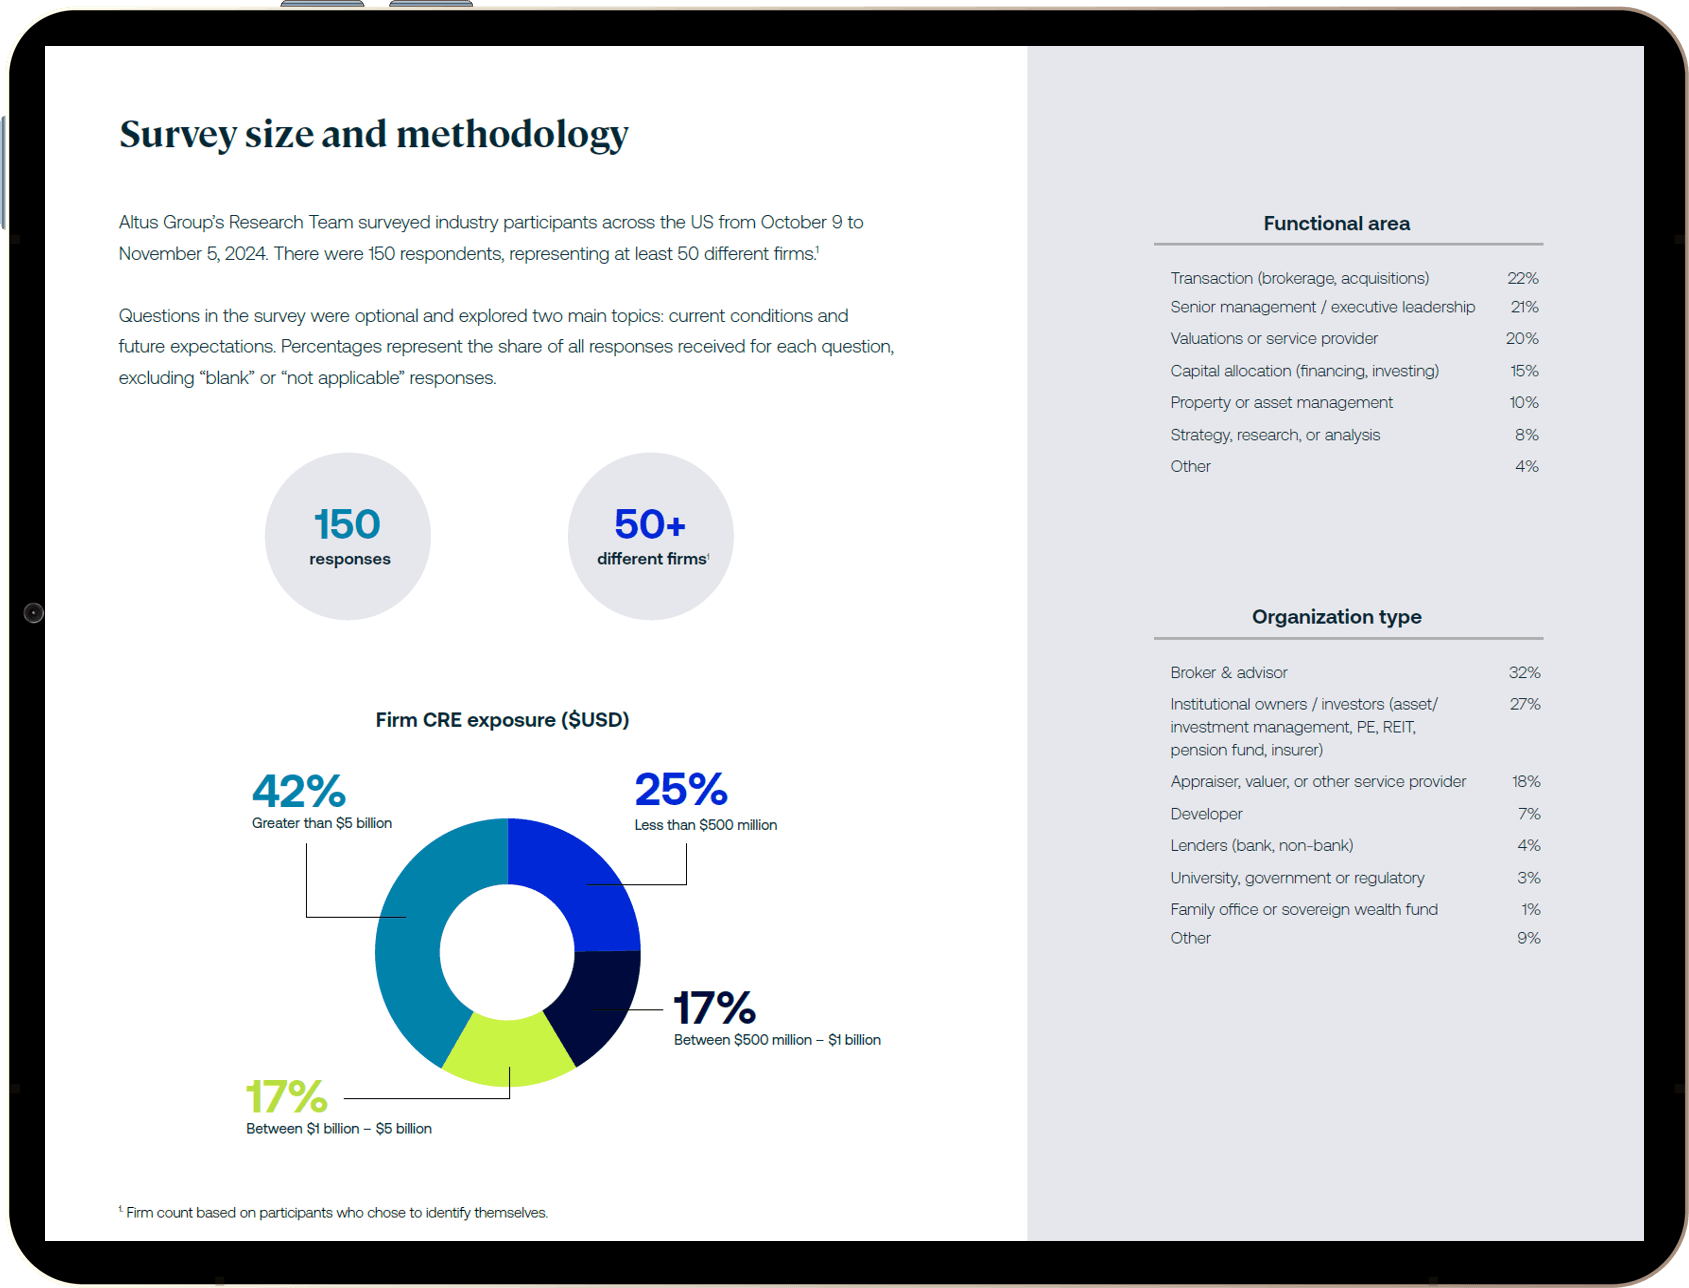
About the survey
The Commercial Real Estate Industry Conditions and Sentiment Survey is a quarterly survey providing insights into the market sentiment, conditions, metrics, and issues affecting the Canadian and United States commercial real estate industry.
The Q4 installment of the US survey was conducted between October 9th and November 5th, 2024. There were 150 respondents, representing at least 50 different firms.