Altus Data Studio
Access commercial listings and transactions, new home sales, and multifamily rental data across Canadian markets.


Discover ALTUS DATA STUDIO
Unlock intelligent real estate data across Canada

Quick and actionable insights from a centralized platform

Comprehensive coverage across key markets and sectors

Stay on top of market trends with expert analysis and insights
Discover the comprehensive catalogue of Canadian real estate market data available in Altus Data Studio

Commercial property listings
Explore the latest office and industrial property data including leasing, sales and availability across Canada.

CRE sales comparables
Access detailed sales transaction data for local Canadian markets such as Toronto, Vancouver and Calgary.
Development applications
Search development application monitoring data for local Canadian markets such as Toronto and Vancouver.

Multifamily rental
Discover multifamily rental data including market inventory, rental rates, vacancy, incentives across Canada.

New homes data
Analyze detailed new-home sales and historical data on new housing developments across Canada.
How Altus data studio works
Streamline your research and start searching faster

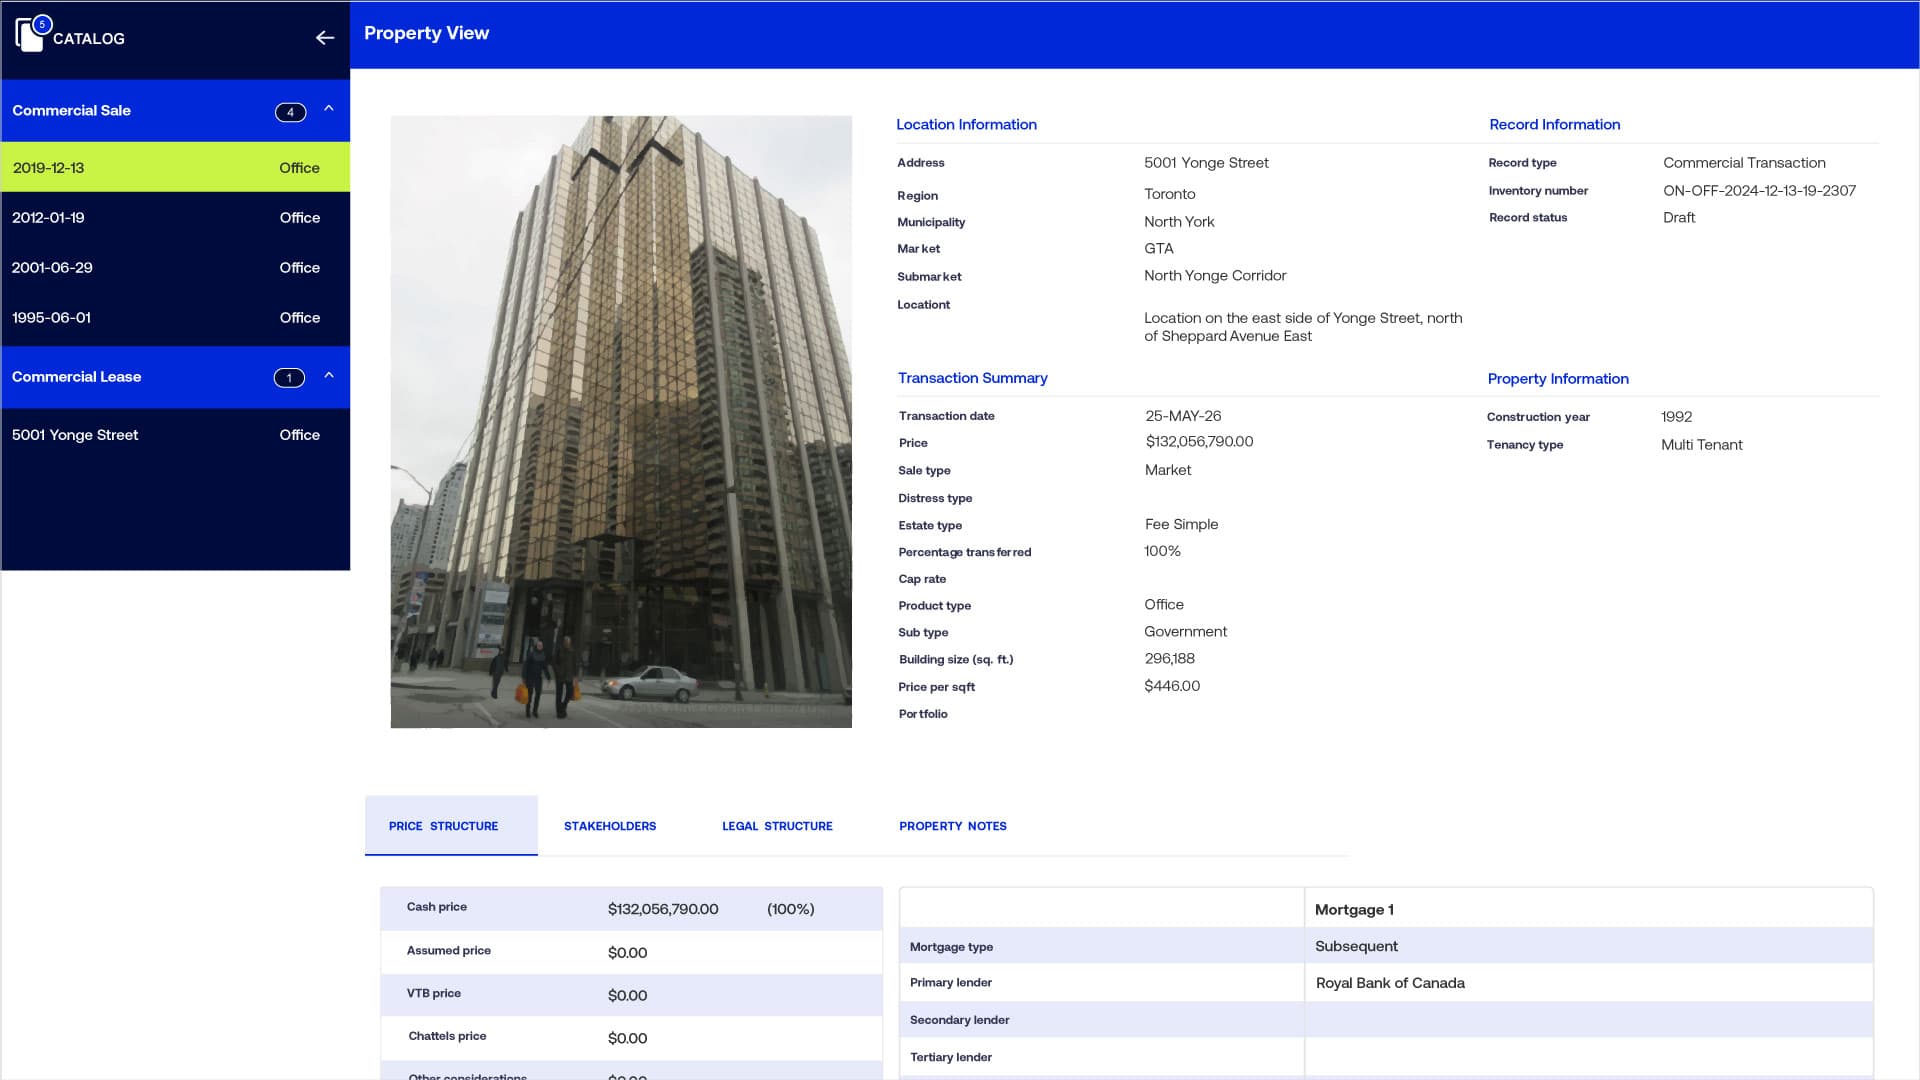
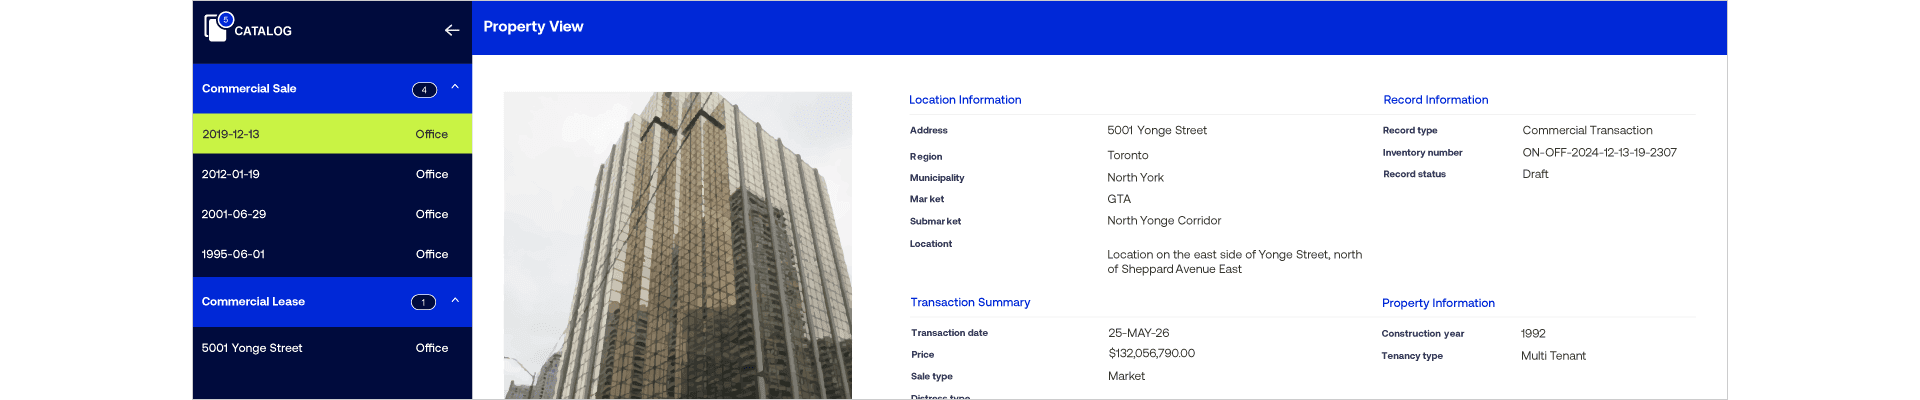
1. Select data catalogue
Start your research process by selecting from one of our five data catalogues.

2. Start searching
Select your market, sector, asset or property and see results based on your unique needs.

3. Apply advanced filters
Use multiple filters to drill down into search results and analyze data more precisely.
4. Analyze results
Instantly generate and customize powerful data visualizations to gain better insights.

5. Export data
Generate a custom built report directly from Data Studio or export to an Excel file for further analysis.
Testimonials
Hear what our customers are saying
FAQ
Get answers to commonly asked questions about Altus Data Studio
Did Altus Data Studio replace RealNet and Altus InSite?
Yes - RealNet and Altus InSite are no longer sold nor currently supported, and have been replaced by Altus Data Studio. In this upgraded experience, our R&D team has worked very hard to bring over all the functionality from our legacy software, combining them all into one complete solution.
How much does Altus Data Studio cost?
We have several subscription plans available to support businesses of all sizes. Discount packages are available for multi-year subscriptions. To find the best package for your business, please contact us.
What's different about the tools in Altus Data Studio?
The tools that were previously available to you in Altus InSite have been improved in Altus Data Studio to increase searching capabilities and allow you to work with the data with greater flexibility. The enhanced features include customizable filters and results grids, saved layouts, analytics tools, data dashboards, and more.
How do I access my market report subscriptions?
After logging in to Altus Data Studio, market reports can be found in the menu bar on the left side under 'Market Reports'. For greater insights, you can also generate your own custom reports by using the data dashboards.
Access to the Investment Trends Survey is unchanged and can be accessed here.
180K+
commercial real estate transactions records
50K+
industrial and office leasing data
11K+
new home development projects
5K+
multi-family rentals across Canada
Options
A powerful data analytics platform that provides you with access to market and transaction data
Solution
Data Studio web app
Ideal for investors, brokers, property developers and researchers looking for market and transaction data across key Canadian markets.
Solution
API & data feed
Power your applications and workflows with immediate access to Altus Data Studio data.